


Total staff
247
Employees
218
Contractors
29
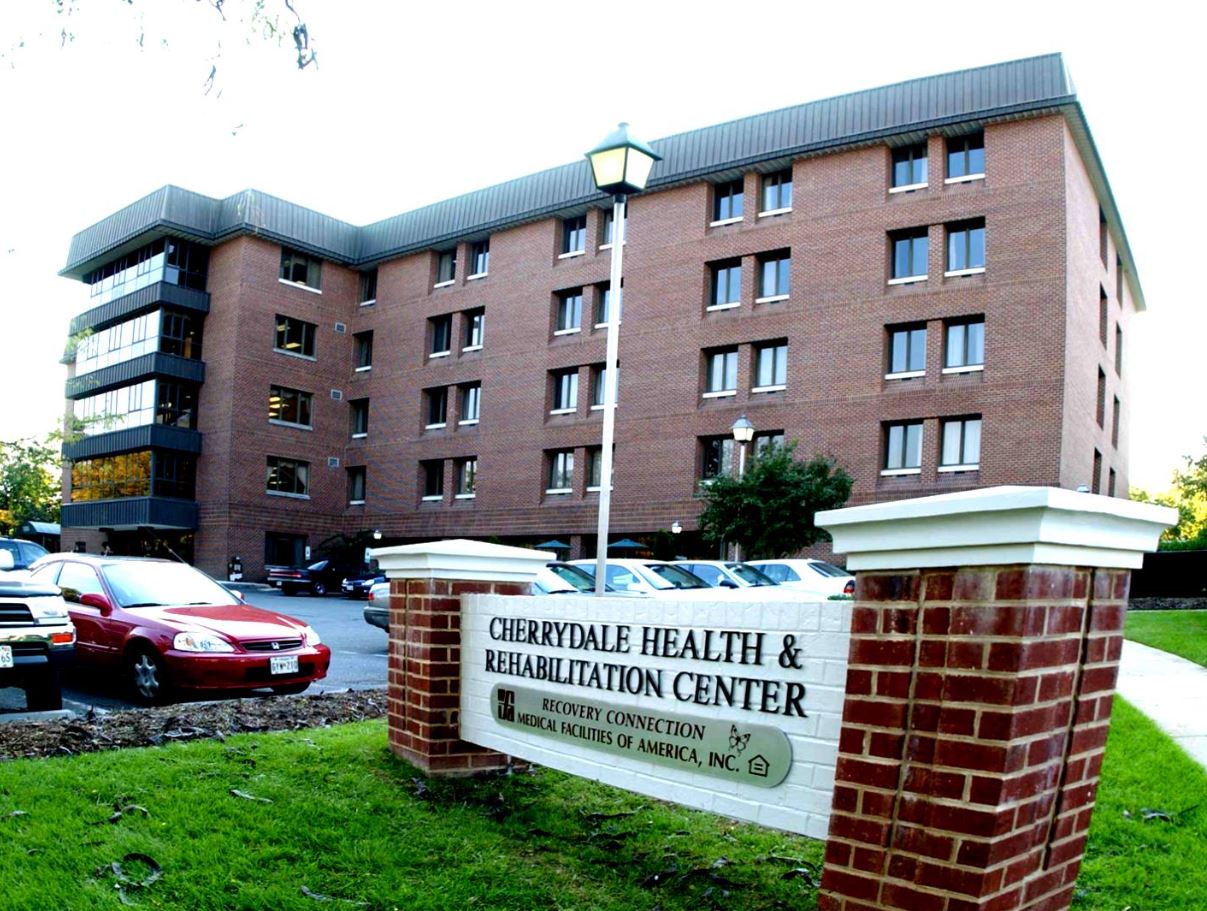
Cherrydale Health and Rehabilitation Center is a place of promise and hopes for those who need advanced rehabilitation services. The center is equipped with cutting-edge technology that helps residents recover quickly and efficiently, giving them more time to enjoy life.
The center sets industry standards and continually strives to exceed them. This dedication is evident in the high level of skill and expertise demonstrated by the therapy team. They offer a wide range of therapies including strength training, equipment-based therapy, and swallowing stimulation, to name just a few.
| Staff type | Hours / Day / Resident | vs state avg |
|---|---|---|
|
Registered Nurse (RN)
| 29m per day | ▼ 29% State avg: 41m per day · National avg: 41m per day |
|
LPN / LVN
| 59m per day | ■ Avg State avg: 1h 0m per day · National avg: 52m per day |
|
Nurse Aide
| 2h 3m per day | ▼ 4% State avg: 2h 8m per day · National avg: 2h 21m per day |
|
Weekend Total Nursing
| 3h 4m per day | ▼ 8% State avg: 3h 19m per day · National avg: 3h 26m per day |
|
Physical Therapist
| 6m per day | ▲ 26% State avg: 5m per day · National avg: 4m per day |
|
Weekend RN
| 17m per day | ▼ 39% State avg: 28m per day · National avg: 29m per day |
Reporting period: October 1 – December 31, 2025 (Q4 2025). Source: CMS Payroll-Based Journal report.
Manages medical care and health needs.
Assists with medical care and medications.
Helps with daily care and mobility.
Total hours from contractors
3,496 contractor hours this quarter
| Certified Nursing Assistant | 96 | 9 | 105 | 34,326 | 92 | 100% | 8 |
| Licensed Practical Nurse | 34 | 10 | 44 | 16,178 | 92 | 100% | 8.7 |
| Registered Nurse | 21 | 2 | 23 | 5,877 | 92 | 100% | 8 |
| Nurse Aide in Training | 13 | 0 | 13 | 2,777 | 92 | 100% | 7.6 |
| Clinical Nurse Specialist | 8 | 0 | 8 | 2,502 | 73 | 79% | 7.4 |
| Physical Therapy Assistant | 10 | 1 | 11 | 2,357 | 88 | 96% | 7.5 |
| Respiratory Therapy Technician | 3 | 2 | 5 | 1,901 | 91 | 99% | 7.5 |
| RN Director of Nursing | 5 | 0 | 5 | 1,733 | 77 | 84% | 7.1 |
| Other Dietary Services Staff | 3 | 0 | 3 | 1,523 | 92 | 100% | 8.1 |
| Dental Services Staff | 5 | 0 | 5 | 1,408 | 72 | 78% | 8.5 |
| Qualified Social Worker | 7 | 0 | 7 | 1,289 | 78 | 85% | 7.7 |
| Speech Language Pathologist | 3 | 5 | 8 | 1,152 | 79 | 86% | 7 |
| Other Social Services Staff | 2 | 0 | 2 | 854 | 84 | 91% | 7.8 |
| Nurse Practitioner | 1 | 0 | 1 | 492 | 65 | 71% | 7.6 |
| Administrator | 1 | 0 | 1 | 458 | 60 | 65% | 7.6 |
| Dietitian | 1 | 0 | 1 | 457 | 60 | 65% | 7.6 |
| Physical Therapy Aide | 3 | 0 | 3 | 328 | 46 | 50% | 7 |
| Mental Health Service Worker | 2 | 0 | 2 | 226 | 30 | 33% | 7.5 |
Includes penalties issued in 2025
Federal penalties imposed by CMS for regulatory violations, including civil money penalties (fines) and denials of payment for new Medicare/Medicaid admissions.
Source: CMS Penalties Database (Data as of Jan 2026)
Virginia average: $52K
Virginia average: 1.8
Virginia average: 0.1
Penalties are imposed by CMS for violations of federal nursing home regulations.
1 penalty in the past 3 years
Apr 24, 2025 · $18K
Last updated: Jan 2026
These measures show how residents usually do over time at this home, based on health outcomes and preventive care.
Virginia average: 10.1
Virginia average: 19.7
Virginia average: 16.8%
Virginia average: 19.7%
Virginia average: 22.6%
Virginia average: 3.6%
Virginia average: 5.4%
Virginia average: 1.5%
Virginia average: 5.9%
Virginia average: 14.9%
Virginia average: 12.9%
Virginia average: 91.3%
Virginia average: 94.0%
Virginia average: 1.46
Virginia average: 1.41
Virginia average: 74.9%
Virginia average: 1.2%
Virginia average: 73.6%
Virginia average: 22.0%
Virginia average: 11.7%
Virginia average: 0.8%
Virginia average: 53.7%
Virginia average: 50.6%
Quality measures are calculated from Minimum Data Set (MDS) assessments. For most measures, lower percentages indicate better care quality.
36% of new residents, usually for short-term rehab.
14% of new residents, often for short stays.
49% of new residents, often for long-term daily care.
Source: CMS Long-Term Care Facility Characteristics (Data as of Jan 2026)
Residents meet regularly to discuss policies, care quality, and activities
Organized group of residents that meets regularly to discuss facility policies, quality of life, and activities.
Data sourced from CMS Long-Term Care Facility Characteristics quarterly report. Payer mix reflects the current resident census by primary payment source.
Historical financial and operational data for Cherrydale Health & Rehabilitation Center from 2011–2023, based on CMS SNF Cost Reports.
Key figures below are for fiscal year ending in 12/2023.
Based on CMS SNF Cost Report for fiscal year ending in 12/2023.
Most residents stay for extended periods and receive ongoing daily care.
New residents most often arrive under Medicaid (49% of admissions), and a typical Medicaid stay runs around 3 - 4 months.
Coverage residents most often arrive under.
Coverage residents most often leave under.
![]() 1.2 miles from city center
1.2 miles from city center
![]() Estimated distance in miles from Arlington's city center to Cherrydale Health & Rehabilitation Center's address, calculated via Google Maps.
— 1.29 miles to nearest hospital (Virginia Hospital Center)
Estimated distance in miles from Arlington's city center to Cherrydale Health & Rehabilitation Center's address, calculated via Google Maps.
— 1.29 miles to nearest hospital (Virginia Hospital Center)
Add your location
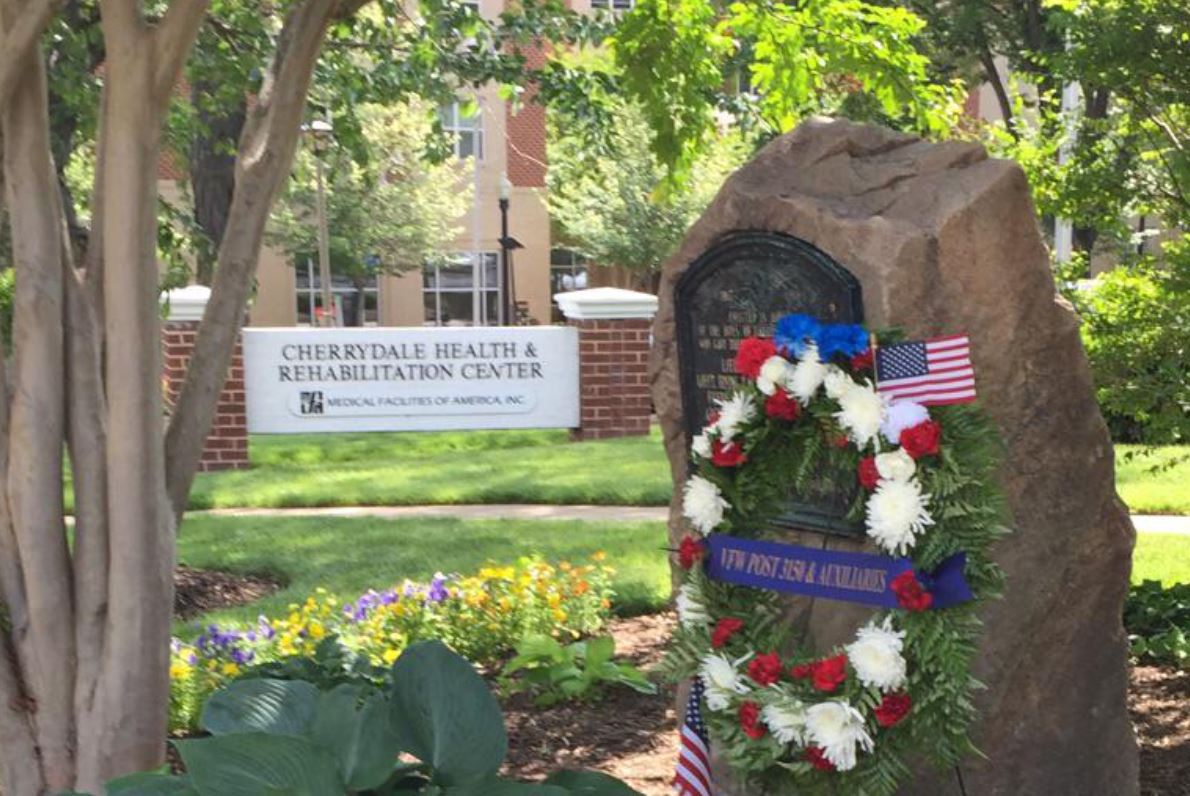
Cherrydale Health & Rehabilitation Center is located in Arlington, Virginia.
Here are the financial assistance programs available to residents in Virginia.
Cherrydale Health & Rehabilitation Center is in the Cherrydale neighborhood.
Cherrydale Health & Rehabilitation Center has a walk score of 85. Very walkable. Most errands can be accomplished on foot, and many essentials are within a short walk.
Cherrydale Health & Rehabilitation Center's occupancy is 98.1%.
No, Cherrydale Health & Rehabilitation Center has a no-pet policy.
Cherrydale Health & Rehabilitation Center is registered as a for-profit.
Yes — there are 4 photos of Cherrydale Health & Rehabilitation Center in the photo gallery on this page.
Cherrydale Health & Rehabilitation Center is located at 3710 Lee Hwy, Arlington, VA 22207.
Care Cost Calculator: See Prices in Your Area
Nursing Home Data Explorer
Don’t Wait Too Long: 7 Red Flag Signs Your Parent Needs Assisted Living Now
The True Cost of Assisted Living in 2025 – And How Families Are Paying For It
Understanding Senior Living Costs: Pricing Models, Discounts & Financial Assistance


