Claiborne County Senior Care
Nursing Home · Mississippi, MS
CMS overall rating Info The Overall CMS Rating is scored from 1 to 5 stars and combines results from health inspections, staffing levels, and quality measures. Health inspections carry the most weight. Staffing and quality scores can increase or decrease the final rating based on performance compared to state and national standards.

Claiborne County Senior Care

Nursing Home · Mississippi, MS
CMS overall rating Info The Overall CMS Rating is scored from 1 to 5 stars and combines results from health inspections, staffing levels, and quality measures. Health inspections carry the most weight. Staffing and quality scores can increase or decrease the final rating based on performance compared to state and national standards.
Calculator: See prices in your area
Claiborne County Senior Care accepts Medicaid, Medicare, and private pay.

Overview of Claiborne County Senior Care

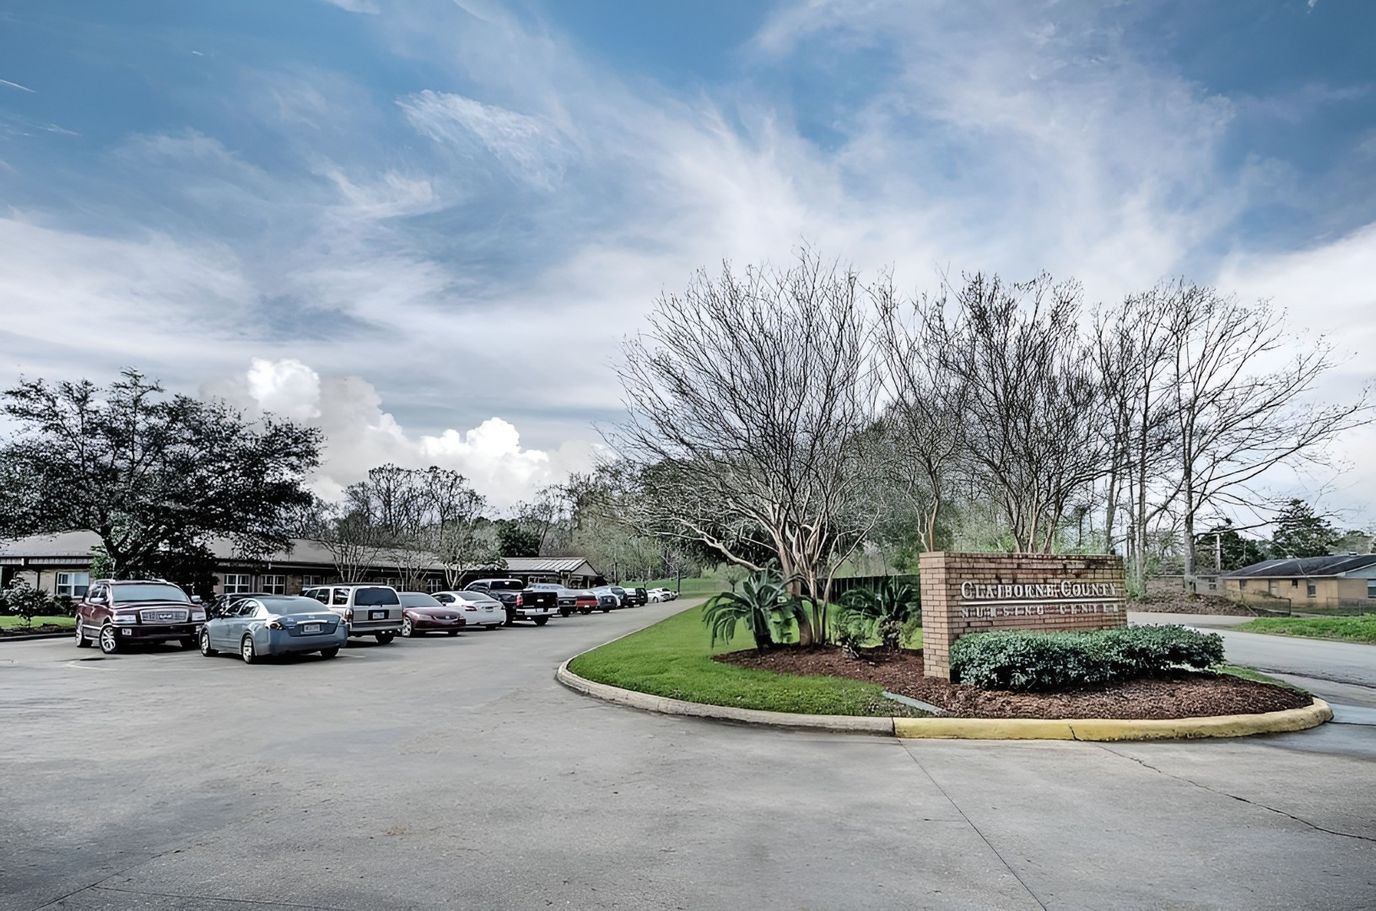
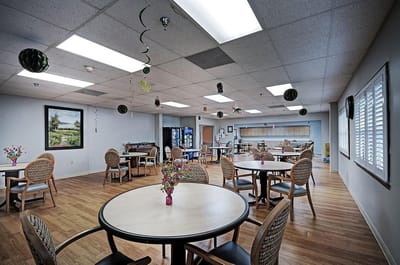
Conveniently situated near Natchez Trace in Port Gibson, MS, Claiborne County Senior Care is an exceptional nursing home that offers skilled nursing and rehabilitation. Memory care is also provided for those with memory loss to improve their cognition. With round-the-clock care, residents do not have to worry about their complex healthcare needs and daily living activities.

Stimulating activities and enriching programs are also conducted for residents’ recreation and wellness. Residents also enjoy delightful and well-balanced dining options that cater to their dietary needs and preferences. With Medicare and Medicaid, the community strives to ease residents’ financial burdens. This nursing home is a good option for those needing comprehensive care to live comfortably in retirement.

(601) 437-8737

Quality ratings

Measured by Centers for Medicare & Medicaid Services (CMS)

Overall rating Info The Overall CMS Rating combines results from health inspections, staffing levels and quality measures. Health inspections carry the most weight. Staffing and quality scores can increase or decrease the final rating based on performance compared to state and national standards.
▲ 56.3% Above MS avg. ▲ 56.3% Above MS avg.Click the badge to see the full State ranking.Click here to see the full State ranking.
Health Inspection Info Based on the results of the facility's three most recent standard inspections and any complaint investigations. CMS reviews the number, scope, and severity of deficiencies, with more recent findings weighted more heavily.
▲ 41.3% Above MS avg. ▲ 41.3% Above MS avg.Click the badge to see the full State ranking.Click here to see the full State ranking.
Staffing Info Measures average nursing staff hours per resident per day, including Registered Nurses (RNs) and total nursing staff. Ratings are adjusted based on the level of care residents require and are compared to state and national benchmarks.
▲ 22.3% Above MS avg. ▲ 22.3% Above MS avg.Click the badge to see the full State ranking.Click here to see the full State ranking.
Quality Measures Info Based on clinical and physical health indicators reported to CMS, such as hospital readmissions, falls, pressure ulcers, and improvements in mobility. These measures reflect how well residents' health needs are being managed.
▼ 7.8% Below MS avg. ▼ 7.8% Below MS avg.Click the badge to see the full State ranking.Click here to see the full State ranking.

Staffing hours breakdown

Info Daily nursing hours per resident by staff type, reported to CMS. Higher is generally better — compare this facility to state and national averages to see where staffing stands.

Hours per resident per day — compared to Mississippi state averages

Total nursing care / resident Info This home is ranked 12th out of 110 homes in Mississippi. Total adjusted nursing hours per resident per day, combining RN, LPN, and aide time. CMS adjusts this for case-mix so facilities can be fairly compared.
5h 47m per day
Rank #12 / 110Nurse hours — State benchmarkedThis home is ranked 12th out of 110 homes in Mississippi. Shows adjusted nurse hours per resident per day benchmarked to the Mississippi average, with a ranking across 110 Mississippi SNFs. More hours mean more direct care. The national average is about 3.5 hrs; below 3.0 is a red flag.Click the rank badge to see the full State ranking.Click here to see the full State ranking.
This facility Mississippi avg (4h 20m per day)
vs Mississippi avg
+33%

2 of 5 metrics below state avg

Standout metric Nurse Aide is +48% above state avg
Staff typeHours / Day / Residentvs state avg
Registered Nurse (RN) Info RNs hold the highest nursing license and can assess residents, interpret test results, and direct care plans. More RN hours per day often signals stronger clinical oversight and faster response to health changes. 29m per day ▼ 24% State avg: 38m per day · National avg: 41m per day
LPN / LVN Info Licensed Practical Nurses (LPNs) or Licensed Vocational Nurses (LVNs) deliver routine hands-on care — medication administration, wound dressing, and monitoring vital signs. They work under RN supervision and make up a large share of daily bedside care. 1h 13m per day ▲ 12% State avg: 1h 5m per day · National avg: 52m per day
Nurse Aide Info Certified Nurse Aides (CNAs) provide the most direct day-to-day assistance: bathing, dressing, feeding, and mobility. Nurse aide hours are typically the largest staffing category and directly affect residents' quality of life. 3h 40m per day ▲ 48% State avg: 2h 29m per day · National avg: 2h 21m per day
Weekend Total Nursing Info Combined nursing hours (RN + LPN + Nurse Aide) per resident per day on weekends. Staffing often drops on weekends — this figure reveals whether the facility maintains adequate coverage outside of weekday hours. 4h 7m per day ▲ 17% State avg: 3h 31m per day · National avg: 3h 26m per day
Weekend RN Info Registered nurse hours specifically on weekends. Facilities sometimes reduce RN presence on Saturdays and Sundays — a low weekend RN figure compared to weekday hours can indicate reduced clinical oversight when most administrative staff are absent. 14m per day ▼ 36% State avg: 22m per day · National avg: 29m per day

Types of Care at Claiborne County Senior Care

Nursing Home

Capacity and availability

Avg. Length of Stay
376 days
Bed community size
65-bed community Rank #117 / 267Bed count — State benchmarkedThis home is ranked 117th out of 267 homes in Mississippi. Shows this facility's certified or reported bed count compared to other Mississippi SNFs. Larger communities may offer more amenities, programs, and on-site services for residents and families.Click the rank badge to see the full State ranking.Click here to see the full State ranking.
A moderately sized community that may balance personal attention with shared amenities and social activities.
Walk Score
Walk Score: 0 / 100 Rank #294 / 319Walk Score — State benchmarkedThis home is ranked 294th out of 319 homes in Mississippi. Shows how walkable this facility's neighborhood is compared to the average Walk Score across Mississippi SNFs. Higher scores benefit residents, families, and staff.Click the rank badge to see the full State ranking.Click here to see the full State ranking.
Car-dependent. Most errands require a car, with limited nearby walkable options.

About this community

Occupancy

Occupancy rate
100%
Rank #51 / 115Occupancy rate — State benchmarkedThis home is ranked 51st out of 115 homes in Mississippi. Shows this facility's occupancy rate versus the Mississippi average, with its Statewide rank out of 115. Higher occupancy signals strong local demand and financial stability.Click the rank badge to see the full State ranking.Click here to see the full State ranking.
Higher than the Mississippi average: 82.3%
Occupied beds
65 / 65
Average occupied beds in Mississippi homes 74 beds

License Details

Facility TypeNursing Home
CountyClaiborne
CMS Certification Number255192

Ownership & Operating Entity

Claiborne County Senior Care is legally operated by Lisa Fears, and administrated by Judy Massey.

Ownership TypeProprietary

Memory & Specialized Care

1 service
Does not offer Alzheimer's Care

Contact Claiborne County Senior Care

Inspection History

In Mississippi, the State Department of Health, Bureau of Health Facilities Licensure conducts unannounced surveys to monitor facility compliance with health, safety, and resident rights laws.

Since 2018 · 8 years of data 43 deficiencies

Inspection Scorecard Info This scorecard compares key inspection, citation, and complaint metrics at this facility against the Mississippi state average. Metrics rated ≥15% worse than average are highlighted in red; those ≥15% better are highlighted in green.

Since 2018 vs. Mississippi state average
Overall vs. MS average 0 Worse No metrics in this bucket. 2 Better Metrics better than Mississippi average:
• Total deficiencies (4% below)
• Deficiencies per year (4% below)
Latest Inspection August 5, 2025 Plan Of Correction

Deficiencies Info Deficiencies are formal regulatory issues recorded during state inspections.

This FacilityMS Averagevs. MS Avg
Total deficiencies Info Formal regulatory issues recorded by inspectors across all inspection types. 4345 This facility has 4% fewer total deficiencies than a typical Mississippi nursing home (43 vs. MS avg 45).↓ 4% better
Deficiencies per year Info Average deficiencies per year since 2018. 5.45.6 This facility has 4% fewer deficiencies per year than a typical Mississippi nursing home (5.4 vs. MS avg 5.6).↓ 4% better

Inspection Reports Summary Info An editor-reviewed summary of the themes and findings across this facility's recent inspection reports.

  • The most recent inspection on August 5, 2025, was a desk review confirming the facility had corrected prior deficiencies and was placed back in compliance as of July 27, 2025. Earlier inspections, including a comprehensive survey in June 2025, cited deficiencies mainly related to peri-care practices that risked skin breakdown and urinary tract infections, medication management delays, food labeling and temperature recording, and infection control during incontinent care. A substantiated complaint investigation in June 2025 confirmed inadequate peri-care for two residents, leading to targeted staff training and monitoring. Prior complaint investigations were mostly unsubstantiated, and no fines, immediate jeopardy findings, or license actions were listed in the available reports. The facility appears to have addressed recent deficiencies with corrective measures, showing improvement in compliance by the latest review.

Health Inspection History

Inspections since 2021
Total health inspections 3

Mississippi average 4.4


Last Health inspection on Jun 2025

Total health citations
9 Rank #13 / 113Health citations — State benchmarkedThis home is ranked 13th out of 113 homes in Mississippi. Shows this facility's total health deficiency citations benchmarked to the Mississippi State average, with a ranking across all 113 MS SNFs. Lower citation counts earn a better rank.Click the rank badge to see the full State ranking.Click here to see the full State ranking.

Mississippi average 16.9

Citations per inspection
3 Rank #22 / 113Citations per inspection — State benchmarkedThis home is ranked 22nd out of 113 homes in Mississippi. Shows average deficiency citations per CMS inspection for this facility versus the Mississippi mean across 113 SNFs with citation data. Lower is better.Click the rank badge to see the full State ranking.Click here to see the full State ranking.

Mississippi average 3.83


Health citations are formal notices following inspections when they fail to comply with safety and care standards.

8 of 9 citations resulted from standard inspections; and 1 of 9 came from combined inspections (standard and complaint).

Breakdown of citation severity (last 5 years)
Critical health citations
0
100% better than Mississippi average

Mississippi average: 1


Serious health citations
0
100% better than Mississippi average

Mississippi average: 1.1

0 critical citations Mississippi average: 1

0 serious citations Mississippi average: 1.1

9 moderate citations Mississippi average: 14.6

0 minor citations Mississippi average: 0.3
Citations history (last 5 years)
Abuse/Neglect moderate citation Jun 19, 2025
Corrected

Infection Control moderate citation Jun 19, 2025
Corrected

Nutrition moderate citation Jun 19, 2025
Corrected

Quality of Care moderate citation Jun 19, 2025
Corrected

Staffing Data

Reporting period: October 1 – December 31, 2025 (Q4 2025). Source: CMS Payroll-Based Journal report.

Total staff 101
Employees 89
Contractors 12
Staff to resident ratio 1.53:1
6% worse than Mississippi average
Mississippi average ratio: 1.63:1 Mississippi average ratio: 1.63:1See full Mississippi ranking
Avg staff/day 42
Average shift 9 hours
13% better than Mississippi average
Mississippi average: 8 hours Mississippi average shift: 8 hoursSee full Mississippi ranking
Total staff hours (quarter) 34,788

Nursing staff breakdown

Q4 2025 · Oct 1 – Dec 31 More info This data comes from the CMS Payroll-Based Journal report covering October 1 – December 31, 2025.
Registered Nurse

Manages medical care and health needs.

RN Staff Info All 4 RN Staff are full-time employees. No contractors work on this role. 4
Average shift length Info Average shift length. Calculated as total hours divided by days worked and average staff per day. 9.7 hours
Licensed Practical Nurse

Assists with medical care and medications.

LPN Staff Info All 21 LPN Staff are full-time employees. No contractors work on this role. 21
Average shift length Info Average shift length. Calculated as total hours divided by days worked and average staff per day. 9 hours
Certified Nursing Assistant

Helps with daily care and mobility.

CNA Staff Info All 57 CNA Staff are full-time employees. No contractors work on this role. 57
Average shift length Info Average shift length. Calculated as total hours divided by days worked and average staff per day. 9 hours

Contractor staffing

Q4 2025 · Oct 1 – Dec 31 More info This data comes from the CMS Payroll-Based Journal report covering October 1 – December 31, 2025.

Total hours from contractors

3.7%

1,294 contractor hours this quarter

Qualified Social Worker: 4 Respiratory Therapy Technician: 2 Medical Director: 1 Physical Therapy Aide: 1 Physical Therapy Assistant: 1 Speech Language Pathologist: 1 Occupational Therapy Assistant: 1 Occupational Therapy Aide: 1

Staff by category

Q4 2025 · Oct 1 – Dec 31 More info This data comes from the CMS Payroll-Based Journal report covering October 1 – December 31, 2025.
Certified Nursing Assistant5705722,90492100%9
Licensed Practical Nurse210216,51092100%9
Registered Nurse4041,36092100%9.7
RN Director of Nursing2025675964%7.3
Nurse Practitioner1014886166%8
Clinical Nurse Specialist1014865863%8.4
Dietitian1014676065%7.8
Mental Health Service Worker1014655964%7.9
Respiratory Therapy Technician0223643942%9.3
Physical Therapy Assistant0113513942%9
Qualified Social Worker0442934145%7.1
Administrator1012483134%8
Physical Therapy Aide0112172426%9
Speech Language Pathologist0112533%8.4
Medical Director0111622%8
Occupational Therapy Aide0111622%8
Occupational Therapy Assistant0111222%6
57 Certified Nursing Assistant
% of Days 100%
21 Licensed Practical Nurse
% of Days 100%
4 Registered Nurse
% of Days 100%
2 RN Director of Nursing
% of Days 64%
1 Nurse Practitioner
% of Days 66%
1 Clinical Nurse Specialist
% of Days 63%
1 Dietitian
% of Days 65%
1 Mental Health Service Worker
% of Days 64%
2 Respiratory Therapy Technician
% of Days 42%
1 Physical Therapy Assistant
% of Days 42%
4 Qualified Social Worker
% of Days 45%
1 Administrator
% of Days 34%
1 Physical Therapy Aide
% of Days 26%
1 Speech Language Pathologist
% of Days 3%
1 Medical Director
% of Days 2%
1 Occupational Therapy Aide
% of Days 2%
1 Occupational Therapy Assistant
% of Days 2%

Penalties and fines

Federal penalties imposed by CMS for regulatory violations, including civil money penalties (fines) and denials of payment for new Medicare/Medicaid admissions.

Source: CMS Penalties Database

No penalties in the past 3 years

No civil money penalties or payment denials were reported in the last 3 years.

Quality of care over time

These measures show how residents usually do over time at this home, based on health outcomes and preventive care.

High-risk clinical events score Info A composite score based on pressure ulcers, falls with injury, weight loss, walking ability decline, and activities of daily living decline. 10.5
15% better than Mississippi average

Mississippi average: 12.4

Functional decline score Info A composite score based on activities of daily living decline, walking ability decline, and incontinence. 19.1
14% better than Mississippi average

Mississippi average: 22.3

Long-stay resident measures
Below average Mississippi avg: 2.0 Info CMS star rating based on long-stay quality measure performance. 5 stars = significantly above average, 1 star = significantly below average.
Need for Help with Daily Activities Increased Info Percent of long-stay residents whose need for help with daily activities has increased 14.7%
31% better than Mississippi average

Mississippi average: 21.2%

Walking Ability Worsened Info Percent of long-stay residents whose ability to move independently worsened 16.9%
31% better than Mississippi average

Mississippi average: 24.5%

Low Risk Residents with Bowel/Bladder Incontinence Info Percent of low risk long-stay residents who lose control of their bowels or bladder 25.8%
20% worse than Mississippi average

Mississippi average: 21.4%

Falls with Major Injury Info Percent of long-stay residents experiencing one or more falls with major injury 3.5%
9% worse than Mississippi average

Mississippi average: 3.2%

High Risk Residents with Pressure Ulcers Info Percent of long-stay high risk residents with pressure ulcers 5.1%
28% better than Mississippi average

Mississippi average: 7.1%

Urinary Tract Infection Info Percent of long-stay residents with a urinary tract infection 2.9%
9% worse than Mississippi average

Mississippi average: 2.6%

Lost Too Much Weight Info Percent of long-stay residents who lose too much weight 12.2%
96% worse than Mississippi average

Mississippi average: 6.2%

Depressive Symptoms Info Percent of long-stay residents who have depressive symptoms 0.0%
100% better than Mississippi average

Mississippi average: 1.5%

Antipsychotic Use Info Percent of long-stay residents who received an antipsychotic medication 31.0%
46% worse than Mississippi average

Mississippi average: 21.2%

Pneumococcal Vaccine Info Percent of long-stay residents assessed and appropriately given the pneumococcal vaccine 93.8%
In line with Mississippi average

Mississippi average: 95.9%

Influenza Vaccine Info Percent of long-stay residents assessed and appropriately given the seasonal influenza vaccine 98.5%
In line with Mississippi average

Mississippi average: 97.0%

Hospitalizations per 1,000 days Info Number of hospitalizations per 1,000 long-stay resident days. 3.40
39% worse than Mississippi average

Mississippi average: 2.44

ED visits per 1,000 days Info Number of outpatient emergency department visits per 1,000 long-stay resident days. 5.45
89% worse than Mississippi average

Mississippi average: 2.88

Short-stay resident measures
Average Mississippi avg: 1.9 Info CMS star rating based on short-stay quality measure performance. 5 stars = much above average, 1 star = much below average.
Pneumococcal Vaccine Info Percent of short-stay residents assessed and appropriately given the pneumococcal vaccine 82.0%
7% worse than Mississippi average

Mississippi average: 87.9%

Antipsychotic medication increase Info Percent of short-stay residents who newly received an antipsychotic medication 0.0%
100% better than Mississippi average

Mississippi average: 2.5%

Re-hospitalized after SNF stay Info Percentage of short-stay residents who were re-hospitalized after their nursing home admission. 29.3%
5% worse than Mississippi average

Mississippi average: 27.9%

Emergency department visits Info Percentage of short-stay residents who had an outpatient emergency department visit. 9.9%
35% better than Mississippi average

Mississippi average: 15.3%

Falls with major injury Info Percentage of SNF residents who experience falls with major injury during their stay. 0.0%
100% better than Mississippi average

Mississippi average: 0.8%

Ability to care for self at discharge Info Percentage of residents at or above expected ability to care for themselves at discharge. 52.9%
In line with Mississippi average

Mississippi average: 53.7%

Successful return to home or community Info Rate of successful return to home or community from a skilled nursing facility. 36.3%
28% worse than Mississippi average

Mississippi average: 50.6%

Breakdown by payment type

Medicare

75% of new residents, usually for short-term rehab.

Typical stay 4 - 5 months

Private pay

8% of new residents, often for short stays.

Typical stay 1 - 2 years

Medicaid

17% of new residents, often for long-term daily care.

Typical stay 8 - 9 years

Facility Characteristics

Source: CMS Long-Term Care Facility Characteristics (Data as of Jan 2026)

Total residents 66
Medicare
12
18.2% of residents
Medicaid
49
74.2% of residents
Private pay or other
5
7.6% of residents
Programs & Services
Residents Group

Residents meet regularly to discuss policies, care quality, and activities

Active Resident Council

Organized group of residents that meets regularly to discuss facility policies, quality of life, and activities.

Finances and operations

Privately-owned community
Operated by a single business entity.
Home revenue
$8.7M
Profit
$628.8K
Privately-owned community Operated by a single business entity.
Home revenue
$8.7M Rank #64 / 106Revenue — State benchmarkedThis home is ranked 64th out of 106 homes in Mississippi. Shows this facility's annual revenue compared to the Mississippi SNF average. Higher revenue generally means more resources for staffing and capital — read alongside Payroll %.Click the rank badge to see the full State ranking.Click here to see the full State ranking.
Profit
$628.8K
Payroll costs Info The portion of the home's budget spent on staff, including nurses, caregivers, and other employees who support care and operations. Rank #69 / 106Payroll — State benchmarkedThis home is ranked 69th out of 106 homes in Mississippi. Shows total annual staff payroll benchmarked to the Mississippi average. Higher payroll investment relative to peers often signals better staffing and less reliance on cheaper contract labor.Click the rank badge to see the full State ranking.Click here to see the full State ranking.
$3.9M
44.5% of revenue Rank #68 / 106Payroll % — State benchmarkedThis home is ranked 68th out of 106 homes in Mississippi. Shows payroll as a percentage of revenue versus the Mississippi average. Well-run Mississippi SNFs typically land around 51–70% — the top third Statewide. Below 25% may signal understaffing or heavy agency use — read with Staffing ratings.Click the rank badge to see the full State ranking.Click here to see the full State ranking.
Other operating costs Info All remaining costs needed to run the home, such as food, utilities, building maintenance, supplies and administrative expenses.
$4.2M
Total costs $8.1M

What does this home offer?

Building type icon
Building type icon

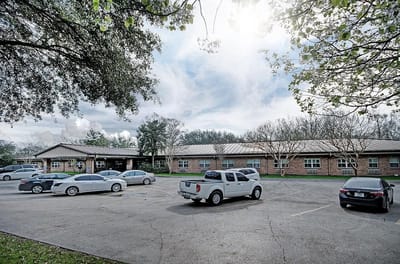
Building Type: Single-story

On-site medical care and health services icon

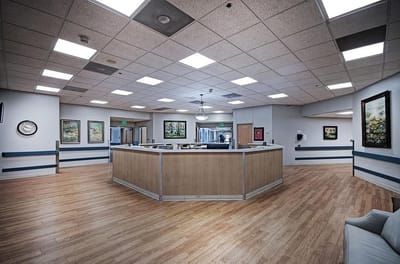
On-site Medical Care and Health Services

Who this home usually serves

TYPE OF STAY

Mix of rehab and long-term care

This home supports both short-term rehab and long-term care, with residents staying for a wide range of durations.

Places of interest near Claiborne County Senior Care

Address 9.7 miles from city center Info Estimated distance in miles from Port Gibson's city center to Claiborne County Senior Care's address, calculated via Google Maps.

Calculate Travel Distance to Claiborne County Senior Care

Add your location

Address

Financial Assistance for
Nursing Home in Mississippi

Claiborne County Senior Care is located in Port Gibson, Mississippi.
Here are the financial assistance programs available to residents in Mississippi.

Get Financial aid guidance

Elderly and Disabled Waiver

Mississippi Medicaid E&D Waiver

Age 65+ or disabled
General Mississippi resident, Medicaid- eligible, nursing home-level care need.
Income Limits (2025) ~$2,829/month 300% FBR, individual
Asset Limits $4,000 individual, higher than most states
MS

Higher asset limit; rural focus.

Benefits
Personal care (5-7 hours/day) Respite (240 hours/year) Adult day care ($60/day) Meals ($6/meal)

Mississippi Caregiver Respite Program

MS NFCSP Respite

Age Caregiver of someone 60+
General Mississippi resident.
Income Limits No strict limit; prioritizes low-income.
Asset Limits Not applicable.
MS

Limited slots; rural emphasis.

Benefits
In-home respite (4-6 hours/day) Adult day care (~$60/day) Short-term facility care (up to 5 days)

Assisted Living (AL) Waiver

Mississippi Assisted Living Waiver

Age 65+ or disabled
General Mississippi resident, Medicaid-eligible, NFLOC, living in approved AL facility.
Income Limits (2025) ~$2,829/month (300% FBR, individual); QIT required.
Asset Limits $4,000 (individual), $6,000 (couple).
MS

Only for AL facilities with waiver contracts; small program size.

Benefits
Personal care Meals Medication management Respite Transportation within AL facility

Independent Living (IL) Waiver

Mississippi Independent Living Waiver

Age 16+ (65+ for seniors)
General Mississippi resident, Medicaid-eligible, NFLOC but capable of self-direction.
Income Limits (2025) ~$2,829/month (300% FBR, individual); QIT required.
Asset Limits $4,000 (individual), $6,000 (couple).
MS

Self-directed care; limited to in-home settings.

Benefits
Personal care (4-6 hours/day) Respite (~200 hours/year) Home mods Assistive tech Transition services

Medicare Savings Program (MSP)

Mississippi Medicare Savings Program

Age 65+ or disabled
General Mississippi resident, Medicare Part A/B.
Income Limits (2025) ~$2,510/month (QMB), ~$3,380/month (SLMB), ~$3,598/month (QI)—individual.
Asset Limits $9,430 (individual), $14,130 (couple).
MS

Three tiers; no waitlist; includes Extra Help for Part D.

Benefits
Covers Part B premiums ($174.70/month) Deductibles ($240/year) Copays (~20%)

Mississippi Homemaker Program

Mississippi Homemaker Program (via Area Agencies on Aging)

Age 60+
General Mississippi resident, not Medicaid-eligible, needs assistance with daily living.
Income Limits (2025) ~$1,063/month (100% FPL, individual); prioritizes low-income.
Asset Limits Not strictly assessed; need-based focus.
MS

10 AAAs; waitlist possible due to funding caps.

Benefits
Homemaker services (2-4 hours/day, e.g., cleaning, meal prep) Respite (~2 days/year) Transportation Meals

VA Aid and Attendance (A&A) and Housebound Benefits

Mississippi VA Aid and Attendance/Housebound

Age 65+ or disabled veteran/spouse
General Mississippi resident, wartime service, need for ADL help (A&A) or homebound.
Income Limits (2025) Net income < ~$1,984/month (veteran with dependent, A&A); pension offsets income.
Asset Limits ~$155,356 net worth limit
MS

High veteran population in rural areas.

Benefits
Cash (~$1,433-$2,642/month veteran, ~$951-$1,318 spouse) for care costs (e.g., in-home, assisted living)

Compare Nursing Home around Mississippi

The information below is reported by the Mississippi State Department of Health, Bureau of Health Facilities Licensure.

5 facilities compared · CMS & MS Dept. of Health data

Filter by care type
Traceway Retirement Community
NH

Nursing Home Licensed facility providing 24/7 skilled nursing care for residents with complex, ongoing medical needs. Staffed by RNs, LPNs, and CNAs. Inspected and star-rated annually by CMS. Accepts Medicare (short-term rehab) and Medicaid (long-term care).

AL

Assisted Living A licensed, long-term care setting for seniors or individuals with disabilities who need help with daily activities — like bathing, dressing, and medication management — but not 24-hour skilled nursing. Offers housing, meals, and around-the-clock support while aiming to maximize resident independence.

IL

Independent Living Lifestyle-focused communities for older adults offering dining, activities, and transportation with minimal personal care. Best for active, independent seniors who want community without medical support.

Tupelo (West Main Street)140--5.85 -43%+26%$0172.81133- 43 United Methodist Senior Services Health Care, Inc$22.0M$11.6M52.7%255309
Claiborne County Senior Care
NH

Nursing Home Licensed facility providing 24/7 skilled nursing care for residents with complex, ongoing medical needs. Staffed by RNs, LPNs, and CNAs. Inspected and star-rated annually by CMS. Accepts Medicare (short-term rehab) and Medicaid (long-term care).

Port Gibson65 100.0% +21%5.78 -57%+25%$093.0-65- 0 Claiborne County Senior Care LLC$8.7M$3.9M44.5%255192
Poplar Springs Nursing Center
NH

Nursing Home Licensed facility providing 24/7 skilled nursing care for residents with complex, ongoing medical needs. Staffed by RNs, LPNs, and CNAs. Inspected and star-rated annually by CMS. Accepts Medicare (short-term rehab) and Medicaid (long-term care).

MC

Memory Care Secured, specialized care for people living with Alzheimer's or dementia. Staff trained in cognitive impairment, with higher staff-to-resident ratios and an environment designed to reduce confusion and wandering risk.

Meridian89--5.00 +20%+8%$0203.3-17- 0 Shelley Hale$9.5M$5.1M53.7%255315
Pleasant Hills Community Living Center
NH

Nursing Home Licensed facility providing 24/7 skilled nursing care for residents with complex, ongoing medical needs. Staffed by RNs, LPNs, and CNAs. Inspected and star-rated annually by CMS. Accepts Medicare (short-term rehab) and Medicaid (long-term care).

Jackson (Bradie)100 87.0% +6%4.03 -3%-13%$68.6k222.8287A+ 30 Landa Oglesby$10.2M$5.2M51.4%255112
Gulfport Care Center
NH

Nursing Home Licensed facility providing 24/7 skilled nursing care for residents with complex, ongoing medical needs. Staffed by RNs, LPNs, and CNAs. Inspected and star-rated annually by CMS. Accepts Medicare (short-term rehab) and Medicaid (long-term care).

AL

Assisted Living A licensed, long-term care setting for seniors or individuals with disabilities who need help with daily activities — like bathing, dressing, and medication management — but not 24-hour skilled nursing. Offers housing, meals, and around-the-clock support while aiming to maximize resident independence.

MC

Memory Care Secured, specialized care for people living with Alzheimer's or dementia. Staff trained in cognitive impairment, with higher staff-to-resident ratios and an environment designed to reduce confusion and wandering risk.

Gulfport90 82.2% 0%4.67 -28%+1%$33.6k246.0574- 9 Gerard And Alison Danos Childrens Tr$6.9M$4.8M70.1%255341

Frequently Asked Questions about Claiborne County Senior Care

Who is the owner of Claiborne County Senior Care?

The legal owner and operator of Claiborne County Senior Care is Lisa Fears.

What is the occupancy rate at Claiborne County Senior Care?

Claiborne County Senior Care's occupancy is 100%.

Who is the administrator of Claiborne County Senior Care?

Judy Massey is the administrator of Claiborne County Senior Care.

How many beds does Claiborne County Senior Care have?

Claiborne County Senior Care has 65 beds.

Are there photos of Claiborne County Senior Care?

Yes — there are 7 photos of Claiborne County Senior Care in the photo gallery on this page.

What is the address of Claiborne County Senior Care?

Claiborne County Senior Care is located at 2124 Old Highway 61 South, Port Gibson, MS 39150.

What is the phone number of Claiborne County Senior Care?

(601) 437-8737 will put you in contact with the team at Claiborne County Senior Care.

Guides for Better Senior Living

Care Cost Calculator: See Prices in Your Area

Nursing Home Data Explorer

Don’t Wait Too Long: 7 Red Flag Signs Your Parent Needs Assisted Living Now

The True Cost of Assisted Living in 2025 – And How Families Are Paying For It

Understanding Senior Living Costs: Pricing Models, Discounts & Financial Assistance

Explore Open Rooms
1 Contact details
2 What type of senior care service are you looking for?
3 What budget do you have in mind for senior care?
4 How soon do you need to find care?
5 Additional details

Thank you for your interest!

Our team will be in touch shortly to help with next steps.