Clark Retirement at Keller Lake
Nursing Home, Assisted Living, Independent Living, Memory Care & Respite Care · Grand Rapids, MI
CMS overall rating Info CMS (the Centers for Medicare & Medicaid Services) is the federal agency that rates nursing home quality. Its Overall Rating runs from 1 to 5 stars, combining health inspections, staffing, and quality measures, with inspections weighted most heavily.

Clark Retirement at Keller Lake

Nursing Home, Assisted Living, Independent Living, Memory Care & Respite Care · Grand Rapids, MI
CMS overall rating Info CMS (the Centers for Medicare & Medicaid Services) is the federal agency that rates nursing home quality. Its Overall Rating runs from 1 to 5 stars, combining health inspections, staffing, and quality measures, with inspections weighted most heavily.
Calculator: See prices in your area
Clark Retirement at Keller Lake accepts Medicare, Medicaid, and private pay.

Overview of Clark Retirement at Keller Lake

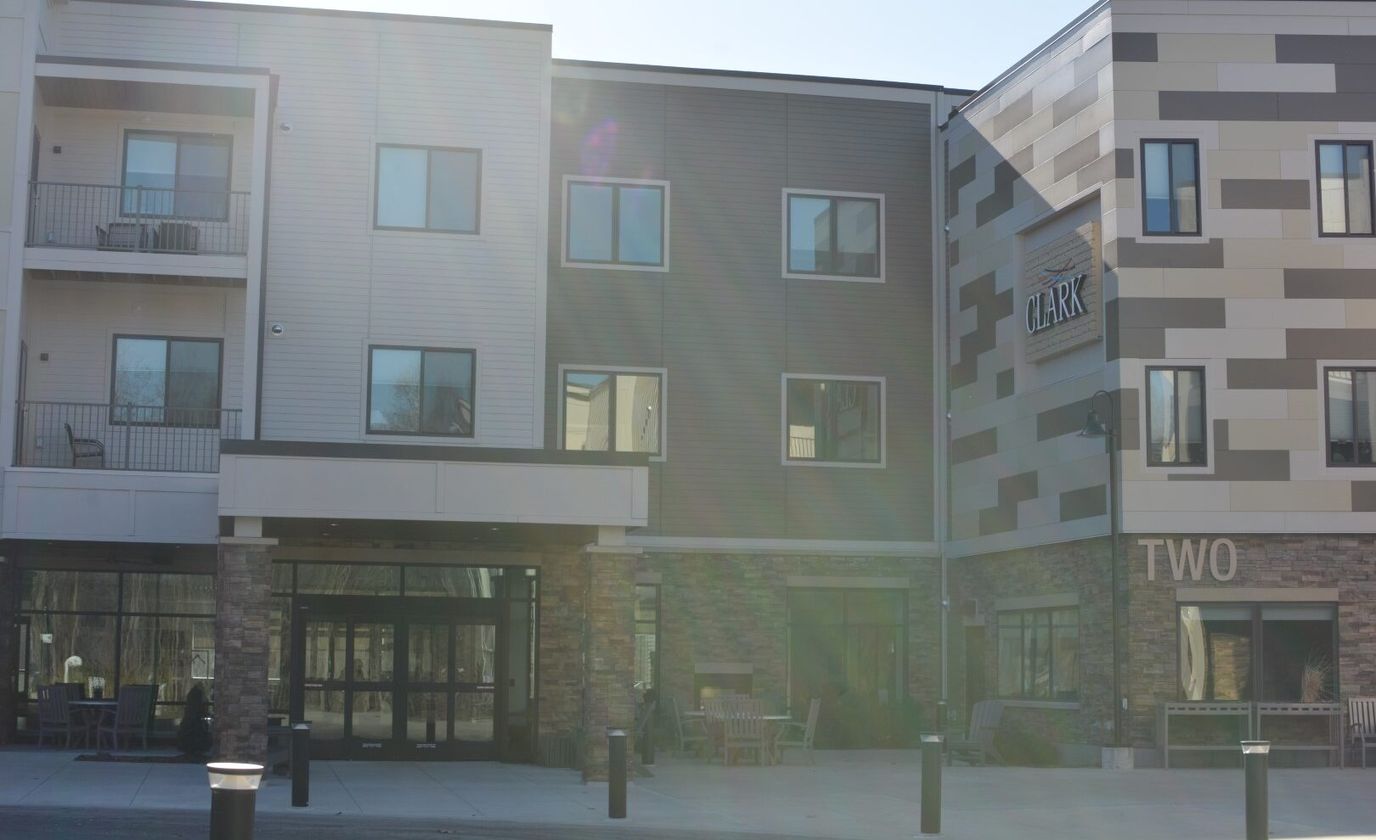
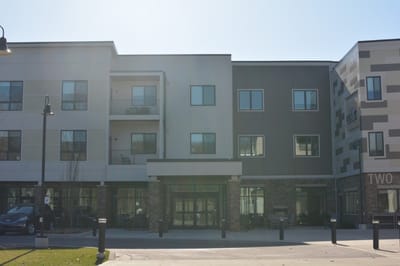
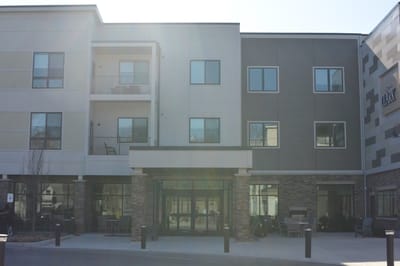
Ideally situated in the harmonious neighborhood of Grand Rapids, MI, Clark Retirement at Keller Lake is a blissful retreat that offers assisted living, independent living, memory care, and respite care. Committed to improving residents’ well-being, a compassionate and well-trained team provides top-tier care for their unique needs around the clock. The community promotes a vibrant and welcoming environment, so residents can feel at ease during their stay.

A variety of entertainment options, including fun games and local trips, are conducted, encouraging residents to live actively and remain socially engaged. Here, residents have a delightful dining experience with delicious and healthy, chef-prepared meals that cater to their dietary needs and preferences. This pet-friendly community is surrounded by lush green spaces where residents can walk and relax, creating the perfect setting for a worry-free retirement.

Quality ratings

Measured by Centers for Medicare & Medicaid Services (CMS)

Overall rating Info The Overall CMS Rating combines results from health inspections, staffing levels and quality measures. Health inspections carry the most weight. Staffing and quality scores can increase or decrease the final rating based on performance compared to state and national standards.
▼ 68.1% Below MI avg. ▼ 68.1% Below MI avg.MI average: 3.1Click the badge to see the full State ranking.Click here to see the full State ranking.
Health Inspection Info Based on the results of the facility's three most recent standard inspections and any complaint investigations. CMS reviews the number, scope, and severity of deficiencies, with more recent findings weighted more heavily.
▼ 64.6% Below MI avg. ▼ 64.6% Below MI avg.MI average: 2.8Click the badge to see the full State ranking.Click here to see the full State ranking.
Staffing Info Measures average nursing staff hours per resident per day, including Registered Nurses (RNs) and total nursing staff. Ratings are adjusted based on the level of care residents require and are compared to state and national benchmarks.
▼ 14.2% Below MI avg. ▼ 14.2% Below MI avg.MI average: 3.5Click the badge to see the full State ranking.Click here to see the full State ranking.
Quality Measures Info Based on clinical and physical health indicators reported to CMS, such as hospital readmissions, falls, pressure ulcers, and improvements in mobility. These measures reflect how well residents' health needs are being managed.
▲ 6.4% Above MI avg. ▲ 6.4% Above MI avg.MI average: 3.8Click the badge to see the full State ranking.Click here to see the full State ranking.

Staffing hours breakdown

Info Daily nursing hours per resident by staff type, reported to CMS. Higher is generally better — compare this facility to state and national averages to see where staffing stands.

Hours per resident per day — compared to Michigan state averages

Total nursing care / resident Info This home is ranked 60th out of 142 homes in Michigan for nurse hours. Total adjusted nursing hours per resident per day, combining RN, LPN, and aide time. CMS adjusts this for case-mix so facilities can be fairly compared.
4h 8m per day
Rank #60 / 142Nurse hours — State benchmarkedThis home is ranked 60th out of 142 homes in Michigan. Shows adjusted nurse hours per resident per day benchmarked to the Michigan average, with a ranking across 142 Michigan facilities. More hours mean more direct care. The national average is about 3.5 hrs; below 3.0 is a red flag.Ranking totals vary by category as each rank only includes facilities that report data for that metric. Homes missing that data point aren't included in the ranking.Click the rank badge to see the full State ranking.Click here to see the full State ranking.
This facility Michigan avg (4h 18m per day)
vs Michigan avg
-4%

4 of 6 metrics below state avg

Standout metric Nurse Aide is +3% above state avg
Staff type Hours / Day / Resident vs state avg
Registered Nurse (RN) Info RNs hold the highest nursing license and can assess residents, interpret test results, and direct care plans. More RN hours per day often signals stronger clinical oversight and faster response to health changes. 30m per day ▼ 35% State avg: 46m per day · National avg: 41m per day
LPN / LVN Info Licensed Practical Nurses (LPNs) or Licensed Vocational Nurses (LVNs) deliver routine hands-on care — medication administration, wound dressing, and monitoring vital signs. They work under RN supervision and make up a large share of daily bedside care. 51m per day ▼ 5% State avg: 53m per day · National avg: 52m per day
Nurse Aide Info Certified Nurse Aides (CNAs) provide the most direct day-to-day assistance: bathing, dressing, feeding, and mobility. Nurse aide hours are typically the largest staffing category and directly affect residents' quality of life. 2h 23m per day ▲ 3% State avg: 2h 20m per day · National avg: 2h 20m per day
Weekend Total Nursing Info Combined nursing hours (RN + LPN + Nurse Aide) per resident per day on weekends. Staffing often drops on weekends — this figure reveals whether the facility maintains adequate coverage outside of weekday hours. 3h 26m per day ■ Avg State avg: 3h 31m per day · National avg: 3h 27m per day
Physical Therapist Info Hours per resident per day provided by licensed Physical Therapists (PTs) or PT Assistants. PT services help residents recover mobility after injury or illness and are especially important for post-acute (short-stay) rehabilitation. 2m per day ▼ 60% State avg: 4m per day · National avg: 4m per day
Weekend RN Info Registered nurse hours specifically on weekends. Facilities sometimes reduce RN presence on Saturdays and Sundays — a low weekend RN figure compared to weekday hours can indicate reduced clinical oversight when most administrative staff are absent. 17m per day ▼ 41% State avg: 29m per day · National avg: 29m per day

Capacity and availability

This home usually has availability

Lower occupancy than the Michigan average: 75.8%
Occupancy rate
70.3% Rank #121 / 395Occupancy rate — State benchmarkedThis home is ranked 121st out of 395 homes in Michigan. Shows this facility's occupancy rate versus the Michigan average, with its Statewide rank out of 395. Higher occupancy signals strong local demand and financial stability.Ranking totals vary by category as each rank only includes facilities that report data for that metric. Homes missing that data point aren't included in the ranking.Click the rank badge to see the full State ranking.Click here to see the full State ranking.
Avg. Length of Stay
191 days
Bed community size
182-bed community Rank #16 / 435Bed count — State benchmarkedThis home is ranked 16th out of 435 homes in Michigan. Shows this facility's certified or reported bed count compared to other Michigan facilities. Larger communities may offer more amenities, programs, and on-site services for residents and families.Ranking totals vary by category as each rank only includes facilities that report data for that metric. Homes missing that data point aren't included in the ranking.Click the rank badge to see the full State ranking.Click here to see the full State ranking.
A large-scale community that may provide a wide range of amenities, services, and structured programs.
Walk Score
Walk Score: 34 / 100 Rank #379 / 703Walk Score — State benchmarkedThis home is ranked 379th out of 703 homes in Michigan. Shows how walkable this facility's neighborhood is compared to the average Walk Score across Michigan facilities. Higher scores benefit residents, families, and staff.Ranking totals vary by category as each rank only includes facilities that report data for that metric. Homes missing that data point aren't included in the ranking.Click the rank badge to see the full State ranking.Click here to see the full State ranking.
Somewhat walkable. A few nearby services may be reachable on foot, but most trips require transportation.
BBB Rating
BBB Rating: A+ (Not Accredited)
An independent rating from the Better Business Bureau based on factors such as complaint history, transparency, and business practices.
How BBB ratings work

About this community

Therapy & Rehabilitation

2 services
Rehabilitation Services
Respite Care

Staffing & Medical

1 service
24-Hour Staffing

Additional Policies & Features

Minimum Age62

Amenities & Lifestyle

Scenic Walking Trails
Fitness Center
Bistro
Restaurant-Style Dining
Fireside Lounge
Multi-Purpose Room
Pet-Friendly Environment
Visiting Primary Care Physicians
Ecumenical Spiritual Life Services
Religious ServicesYes

Dining & Nutrition

Food DescriptionDining options include restaurant-style meals with chef-prepared options.

Contact Clark Retirement at Keller Lake

Health Inspection History

Inspections since 2022
Total health inspections 8

Michigan average 6.5


Last Health inspection on Aug 2025

Total health citations
61 Rank #124 / 144Health citations — State benchmarkedThis home is ranked 124th out of 144 homes in Michigan. Shows this facility's total health deficiency citations benchmarked to the Michigan State average, with a ranking across all 144 MI facilities. Lower citation counts earn a better rank.Ranking totals vary by category as each rank only includes facilities that report data for that metric. Homes missing that data point aren't included in the ranking.Click the rank badge to see the full State ranking.Click here to see the full State ranking.

Michigan average 33.5

Citations per inspection
7.62 Rank #120 / 144Citations per inspection — State benchmarkedThis home is ranked 120th out of 144 homes in Michigan. Shows average deficiency citations per CMS inspection for this facility versus the Michigan mean across 144 facilities with citation data. Lower is better.Ranking totals vary by category as each rank only includes facilities that report data for that metric. Homes missing that data point aren't included in the ranking.Click the rank badge to see the full State ranking.Click here to see the full State ranking.

Michigan average 5.18


Health citations are formal notices following inspections when they fail to comply with safety and care standards.

36 of 61 citations resulted from standard inspections; 20 of 61 resulted from complaint investigations; and 5 of 61 came from combined inspections (standard and complaint).

Breakdown of citation severity (last 4 years)
Critical health citations
0
100% better than Michigan average

Michigan average: 0.3


Serious health citations
3
58% worse than Michigan average

Michigan average: 1.9

0 critical citations Michigan average: 0.3

3 serious citations Michigan average: 1.9

56 moderate citations Michigan average: 30.8

2 minor citations Michigan average: 0.5
Citations history (last 4 years)
Abuse/Neglect moderate citation Aug 07, 2025
Corrected

Abuse/Neglect moderate citation Aug 07, 2025
Corrected

Nursing Services moderate citation Aug 07, 2025
Corrected

Quality of Care moderate citation Aug 07, 2025
Corrected

Staffing Data

Reporting period: October 1 – December 31, 2025 (Q4 2025). Source: CMS Payroll-Based Journal report.

Total staff 234
Employees 118
Contractors 116
Staff to resident ratio 1.80 : 1
6% more staff per resident than Michigan average
Michigan average ratio: 1.70 : 1 Michigan average ratio: 1.70 : 1See full Michigan ranking
Avg staff/day 57
Average shift 9.1 hours
15% better than Michigan average
Michigan average: 7.9 hours Michigan average shift: 7.9 hoursSee full Michigan ranking
Total staff hours (quarter) 47,490

Nursing staff breakdown

Q4 2025 · Oct 1 – Dec 31 More info This data comes from the CMS Payroll-Based Journal report covering October 1 – December 31, 2025.
Registered Nurse

Manages medical care and health needs.

RN Staff Info 43 total: 4 full-time employees and 39 contractors. 43
Average shift length Info Average shift length. Calculated as total hours divided by days worked and average staff per day. 11.6 hours
Licensed Practical Nurse

Assists with medical care and medications.

LPN Staff Info 81 total: 20 full-time employees and 61 contractors. 81
Average shift length Info Average shift length. Calculated as total hours divided by days worked and average staff per day. 10.7 hours
Certified Nursing Assistant

Helps with daily care and mobility.

CNA Staff Info All 73 CNA Staff are full-time employees. No contractors work on this role. 73
Average shift length Info Average shift length. Calculated as total hours divided by days worked and average staff per day. 8.9 hours

Contractor staffing

Q4 2025 · Oct 1 – Dec 31 More info This data comes from the CMS Payroll-Based Journal report covering October 1 – December 31, 2025.

Total hours from contractors

16.1%

7,630 contractor hours this quarter

Licensed Practical Nurse: 61 Registered Nurse: 39 Physical Therapy Aide: 4 Qualified Social Worker: 4 Physical Therapy Assistant: 3 Speech Language Pathologist: 3 Respiratory Therapy Technician: 2

Staff by category

Q4 2025 · Oct 1 – Dec 31 More info This data comes from the CMS Payroll-Based Journal report covering October 1 – December 31, 2025.
Certified Nursing Assistant 73 0 73 26,139 92 100% 8.9
Licensed Practical Nurse 20 61 81 8,512 92 100% 10.7
Registered Nurse 4 39 43 3,836 91 99% 11.6
Other Dietary Services Staff 7 0 7 2,113 92 100% 7.4
Clinical Nurse Specialist 4 0 4 1,144 64 70% 8
Mental Health Service Worker 2 0 2 1,011 66 72% 8.6
RN Director of Nursing 3 0 3 724 59 64% 8
Speech Language Pathologist 0 3 3 657 66 72% 6.6
Administrator 2 0 2 576 60 65% 8
Qualified Social Worker 0 4 4 520 66 72% 6.1
Nurse Practitioner 1 0 1 488 61 66% 8
Occupational Therapy Aide 1 0 1 472 59 64% 8
Physical Therapy Assistant 0 3 3 470 70 76% 6.5
Physical Therapy Aide 0 4 4 372 62 67% 5.9
Respiratory Therapy Technician 0 2 2 297 54 59% 5.2
Qualified Activities Professional 1 0 1 160 20 22% 8
73 Certified Nursing Assistant
% of Days 100%
81 Licensed Practical Nurse
% of Days 100%
43 Registered Nurse
% of Days 99%
7 Other Dietary Services Staff
% of Days 100%
4 Clinical Nurse Specialist
% of Days 70%
2 Mental Health Service Worker
% of Days 72%
3 RN Director of Nursing
% of Days 64%
3 Speech Language Pathologist
% of Days 72%
2 Administrator
% of Days 65%
4 Qualified Social Worker
% of Days 72%
1 Nurse Practitioner
% of Days 66%
1 Occupational Therapy Aide
% of Days 64%
3 Physical Therapy Assistant
% of Days 76%
4 Physical Therapy Aide
% of Days 67%
2 Respiratory Therapy Technician
% of Days 59%
1 Qualified Activities Professional
% of Days 22%

Penalties and fines

Federal penalties imposed by CMS for regulatory violations, including civil money penalties (fines) and denials of payment for new Medicare/Medicaid admissions.

Source: CMS Penalties Database

No penalties in the past 3 years

No civil money penalties or payment denials were reported in the last 3 years.

Quality of care over time

These measures show how residents usually do over time at this home, based on health outcomes and preventive care.

High-risk clinical events score Info A composite score based on pressure ulcers, falls with injury, weight loss, walking ability decline, and activities of daily living decline. 9.9
17% worse than Michigan average

Michigan average: 8.4

Functional decline score Info A composite score based on activities of daily living decline, walking ability decline, and incontinence. 19.2
18% worse than Michigan average

Michigan average: 16.3

Long-stay resident measures
Need for Help with Daily Activities Increased Info Percent of long-stay residents whose need for help with daily activities has increased 12.3%
In line with Michigan average

Michigan average: 12.5%

Walking Ability Worsened Info Percent of long-stay residents whose ability to move independently worsened 21.9%
43% worse than Michigan average

Michigan average: 15.3%

Low Risk Residents with Bowel/Bladder Incontinence Info Percent of low risk long-stay residents who lose control of their bowels or bladder 23.4%
11% worse than Michigan average

Michigan average: 21.0%

Falls with Major Injury Info Percent of long-stay residents experiencing one or more falls with major injury 2.2%
29% better than Michigan average

Michigan average: 3.2%

High Risk Residents with Pressure Ulcers Info Percent of long-stay high risk residents with pressure ulcers 5.7%
In line with Michigan average

Michigan average: 5.7%

Urinary Tract Infection Info Percent of long-stay residents with a urinary tract infection 2.0%
19% worse than Michigan average

Michigan average: 1.7%

Lost Too Much Weight Info Percent of long-stay residents who lose too much weight 7.0%
24% worse than Michigan average

Michigan average: 5.7%

Depressive Symptoms Info Percent of long-stay residents who have depressive symptoms 6.7%
72% worse than Michigan average

Michigan average: 3.9%

Antipsychotic Use Info Percent of long-stay residents who received an antipsychotic medication 14.7%
In line with Michigan average

Michigan average: 15.0%

Pneumococcal Vaccine Info Percent of long-stay residents assessed and appropriately given the pneumococcal vaccine 96.9%
In line with Michigan average

Michigan average: 94.9%

Influenza Vaccine Info Percent of long-stay residents assessed and appropriately given the seasonal influenza vaccine 99.2%
In line with Michigan average

Michigan average: 95.0%

Short-stay resident measures
Pneumococcal Vaccine Info Percent of short-stay residents assessed and appropriately given the pneumococcal vaccine 83.0%
In line with Michigan average

Michigan average: 82.5%

Antipsychotic medication increase Info Percent of short-stay residents who newly received an antipsychotic medication 3.4%
134% worse than Michigan average

Michigan average: 1.4%

Influenza Vaccine Info Percent of short-stay residents assessed and appropriately given the seasonal influenza vaccine 79.2%
In line with Michigan average

Michigan average: 79.5%

Breakdown by payment type

Medicare

20% of new residents, usually for short-term rehab.

Typical stay 1 - 2 months

Private pay

69% of new residents, often for short stays.

Typical stay 1 - 2 months

Medicaid

10% of new residents, often for long-term daily care.

Typical stay 4 years

Facility Characteristics

Source: CMS Long-Term Care Facility Characteristics (Data as of Jan 2026)

Total residents 130
Medicare
14
10.8% of residents
Medicaid
105
80.8% of residents
Private pay or other
11
8.5% of residents
Programs & Services
Residents Group

Residents meet regularly to discuss policies, care quality, and activities

Active Resident Council

Organized group of residents that meets regularly to discuss facility policies, quality of life, and activities.

Finances and operations

Based on CMS SNF Cost Report for fiscal year ending in 12/2023.

Voluntary non-profit community
Operated by a church.
Net patient revenue Info Net patient revenue — what the home actually collects for resident care, after contractual allowances, bad debt and discounts are subtracted from its gross charges (CMS cost report, Worksheet G-3). It covers resident care only; money the home earns from other sources is shown separately as "Other income."
$15.5M
Net patient income Info Net patient income: net patient revenue minus the home's total operating expenses. A positive figure means it earns more from resident care than it spends to deliver it; a negative figure means the opposite. It excludes non-operating "other income."
-$3.3M
Voluntary non-profit community Operated by a church.
Net patient revenue Info Net patient revenue — what the home actually collects for resident care, after contractual allowances, bad debt and discounts are subtracted from its gross charges (CMS cost report, Worksheet G-3). It covers resident care only; money the home earns from other sources is shown separately as "Other income."
$15.5M Rank #32 / 143Revenue — State benchmarkedThis home is ranked 32nd out of 143 homes in Michigan. Shows this facility's annual revenue compared to the Michigan average. Higher revenue generally means more resources for staffing and capital — read alongside Payroll %.Ranking totals vary by category as each rank only includes facilities that report data for that metric. Homes missing that data point aren't included in the ranking.Click the rank badge to see the full State ranking.Click here to see the full State ranking.
Net patient income Info Net patient income: net patient revenue minus the home's total operating expenses. A positive figure means it earns more from resident care than it spends to deliver it; a negative figure means the opposite. It excludes non-operating "other income."
-$3.3M
Other income Info Money the home earns outside of resident care — such as investments, grants, rentals and other non-operating sources (CMS cost report, Worksheet G-3). It is tracked separately from net patient revenue: it is not part of that figure, and it is not included in net patient income.
$1.7M
Payroll costs Info Staff salaries plus wage-related costs — benefits such as payroll taxes, health insurance and retirement — from the home's own accounting records (CMS cost report, Worksheet A). Contract or agency labor is counted separately, under other operating costs. Rank #37 / 143Payroll — State benchmarkedThis home is ranked 37th out of 143 homes in Michigan. Shows total annual staff payroll benchmarked to the Michigan average. Higher payroll investment relative to peers often signals better staffing and less reliance on cheaper contract labor.Ranking totals vary by category as each rank only includes facilities that report data for that metric. Homes missing that data point aren't included in the ranking.Click the rank badge to see the full State ranking.Click here to see the full State ranking.
$9.2M 59.6% of net patient revenue Info Payroll as a share of revenue: staff salaries and wage-related benefits divided by net patient revenue. A higher figure means more of each revenue dollar goes to staff pay. Rank #82 / 143Payroll % — State benchmarkedThis home is ranked 82nd out of 143 homes in Michigan. Shows payroll as a percentage of revenue versus the Michigan average. Well-run Michigan facilities typically land around 49–59% — the top third Statewide. Below 25% may signal understaffing or heavy agency use — read with Staffing ratings.Ranking totals vary by category as each rank only includes facilities that report data for that metric. Homes missing that data point aren't included in the ranking.Click the rank badge to see the full State ranking.Click here to see the full State ranking.
Other operating costs Info Everything it costs to run the home apart from payroll — food, utilities, supplies, maintenance, contract labor and administration. Calculated as total operating expense minus payroll (staff salaries and wage-related benefits).
$9.6M
Total costs Info The home's total operating expense for the year — all the costs of running it, salaries included (CMS cost report, Worksheet G-3).
$18.8M

What does this home offer?

Pets allowed icon
Pets allowed icon

Pets Allowed

Housing options icon

Housing Options: 1 Bed / 2 Bed

Building type icon
Building type icon

Building Type: Single-story

Beauty services icon

Beauty Services

Housekeeping icon
Housekeeping icon

Housekeeping Services

Social and recreational activities icon

Social and Recreational Activities

Exercise program icon

Exercise Programs

Who this home usually serves

TYPE OF STAY

Primarily short stays

Residents typically stay for brief periods, with frequent admissions and discharges throughout the year.

Most new residents arrive under private pay (69% of admissions), and a typical private pay stay runs around 1 - 2 months.

Admissions
244 total

Coverage residents most often arrive under.

Medicare 20%
Private pay 69%
Medicaid 10%
Discharges
244 total

Coverage residents most often leave under.

Medicare 20%
Private pay 69%
Medicaid 10%

Managed by Rachel Romero

Executive Director | Franklin Community

Places of interest near Clark Retirement at Keller Lake

Address 9.2 miles from city center Info Estimated distance in miles from Grand Rapids's city center to Clark Retirement at Keller Lake's address, calculated via Google Maps.

Calculate Travel Distance to Clark Retirement at Keller Lake

Add your location

Address

Compare Nursing Home around Grand Rapids

The information below is reported by the Michigan Department of Licensing and Regulatory Affairs (LARA).

5 facilities compared · CMS & MI Dept. of Health data

St. Ann’s Home
NH
AL
HC
MC
Grand Rapids (Westside Connection)
95
Facility 95
MI AVG 75
Rank #149 / 435
24.2%
Facility 24.2%
MI AVG 75.8%
Rank #344 / 395
-68%
5.07
Facility 5.07
MI AVG 4.30
Rank #20 / 142
-10% +18%
$0
Facility $0
MI AVG $87.6k
Rank #1 / 145
15
Facility 15
MI AVG 33.5
Rank #24 / 144
5.0
Facility 5.0
MI AVG 5.2
Rank #72 / 144
- 23 A+
25
Facility 25
MI AVG 39
Rank #480 / 703
Carmelite Sisters Of The Divine Heart Of Jesus
$8.7M
Facility $8.7M
MI AVG $15.8M
Rank #114 / 143
$6.9M
Facility $6.9M
MI AVG $5.6M
Rank #68 / 143
78.7%
Facility 78.7%
MI AVG 39%
Rank #13 / 143
235643
Covenant Living of the Great Lakes
NH
AL
MC
RC
Grand Rapids (Westside Connection)
102
Facility 102
MI AVG 75
Rank #121 / 435
28.4%
Facility 28.4%
MI AVG 75.8%
Rank #327 / 395
-63%
3.49
Facility 3.49
MI AVG 4.30
Rank #126 / 142
+51% -19%
$0
Facility $0
MI AVG $87.6k
Rank #1 / 145
31
Facility 31
MI AVG 33.5
Rank #76 / 144
10.3
Facility 10.3
MI AVG 5.2
Rank #142 / 144
- 29 A+
35
Facility 35
MI AVG 39
Rank #371 / 703
Covenant Living Of The Great Lakes
$4.8M
Facility $4.8M
MI AVG $15.8M
Rank #138 / 143
$2.3M
Facility $2.3M
MI AVG $5.6M
Rank #134 / 143
46.9%
Facility 46.9%
MI AVG 39%
Rank #26 / 143
235614
SKLD Leonard
NH
HC
RC
Grand Rapids (Northeast)
69
Facility 69
MI AVG 75
Rank #224 / 435
87.0%
Facility 87.0%
MI AVG 75.8%
Rank #48 / 395
+15%
4.09
Facility 4.09
MI AVG 4.30
Rank #60 / 142
+12% -5%
$0
Facility $0
MI AVG $87.6k
Rank #1 / 145
32
Facility 32
MI AVG 33.5
Rank #79 / 144
6.4
Facility 6.4
MI AVG 5.2
Rank #101 / 144
3 64 A+
45
Facility 45
MI AVG 39
Rank #267 / 703
-
$7.3M
Facility $7.3M
MI AVG $15.8M
Rank #112 / 143
$4.0M
Facility $4.0M
MI AVG $5.6M
Rank #116 / 143
55.1%
Facility 55.1%
MI AVG 39%
Rank #80 / 143
235261
StoryPoint Grand Rapids East (Samaritas)
NH
IL
Grand Rapids (Millbrook)
120
Facility 120
MI AVG 75
Rank #74 / 435
71.6%
Facility 71.6%
MI AVG 75.8%
Rank #114 / 395
-6%
4.89
Facility 4.89
MI AVG 4.30
Rank #26 / 142
+130% +14%
$136.8k
Facility $136.8k
MI AVG $87.6k
Rank #135 / 145
85
Facility 85
MI AVG 33.5
Rank #144 / 144
8.5
Facility 8.5
MI AVG 5.2
Rank #131 / 144
11 90 A+
27
Facility 27
MI AVG 39
Rank #461 / 703
-
$10.6M
Facility $10.6M
MI AVG $15.8M
Rank #109 / 143
$5.5M
Facility $5.5M
MI AVG $5.6M
Rank #100 / 143
52.1%
Facility 52.1%
MI AVG 39%
Rank #55 / 143
235458
Clark Retirement at Keller Lake
NH
AL
IL
MC
RC
Grand Rapids (East Paris)
182
Facility 182
MI AVG 75
Rank #16 / 435
70.3%
Facility 70.3%
MI AVG 75.8%
Rank #121 / 395
-7%
4.14
Facility 4.14
MI AVG 4.30
Rank #60 / 142
+80% -4%
$0
Facility $0
MI AVG $87.6k
Rank #1 / 145
61
Facility 61
MI AVG 33.5
Rank #124 / 144
7.6
Facility 7.6
MI AVG 5.2
Rank #120 / 144
3 119 A+
34
Facility 34
MI AVG 39
Rank #379 / 703
Dana Scratch
$15.5M
Facility $15.5M
MI AVG $15.8M
Rank #32 / 143
$9.2M
Facility $9.2M
MI AVG $5.6M
Rank #37 / 143
59.6%
Facility 59.6%
MI AVG 39%
Rank #82 / 143
235103

Financial Assistance for
Nursing Home in Michigan

Clark Retirement at Keller Lake is located in Grand Rapids, Michigan.
Here are the financial assistance programs available to residents in Michigan.

Get Financial aid guidance

MI Choice Waiver

Michigan Medicaid MI Choice Waiver

Age 65+ or disabled
General Michigan resident, Medicaid- eligible, nursing home-level care need.
Income Limits (2025) ~$2,829/month 300% FBR, individual
Asset Limits $2,000 (individual), $3,000 (couple).
MI

Delivered through regional waiver agents; waitlists possible.

Benefits
Personal care (5-7 hours/day) Respite care (240 hours/year) Home modifications ($1,500 avg.) Adult day care ($65/day)

Home Help Program

Michigan Home Help

Age 65+ or disabled
General Michigan resident, Medicaid- eligible or low-income.
Income Limits ~$1,732/month individual, Medicaid threshold
Asset Limits $2,000 individual
MI

Can hire family caregivers; less intensive than waiver.

Benefits
Personal care (up to 60 hours/month) Homemaker services Respite (varies)

Program of All-Inclusive Care for the Elderly (PACE)

Michigan PACE

Age 55+
General Michigan resident, nursing home-level care need, safe with PACE support.
Income Limits (2025) ~$2,829/month (Medicaid-eligible); private pay option available.
Asset Limits $2,000 (individual), $3,000 (couple).
MI

16 PACE centers (e.g., Ingham, Wayne counties); expanding slowly.

Benefits
Personal care (5-7 hours/day) Medical care Meals Transportation Therapy Respite

Medicare Savings Program (MSP)

Michigan Medicare Savings Program

Age 65+ or disabled
General Michigan resident, Medicare Part A/B.
Income Limits (2025) ~$2,510/month (QMB), ~$3,380/month (SLMB), ~$3,598/month (QI)—individual.
Asset Limits $9,430 (individual), $14,130 (couple).
MI

Three tiers; no waitlist; includes Extra Help for Part D.

Benefits
Covers Part B premiums ($174.70/month) Deductibles ($240/year) Copays (~20%)

National Family Caregiver Support Program (NFCSP) Respite

Michigan NFCSP Respite Care

Age
General Caregivers of 60+ needing care or 55+ caregivers of others; Michigan resident; functional needs (2+ ADLs).
Income Limits (2025) Prioritizes ~$24,980/year (individual); no strict cap.
Asset Limits Not assessed; need-based.
MI

16 AAAs; prioritizes low-income, rural caregivers.

Benefits
Respite (4-6 hours/week or 5 days/year) Adult day care ($60/day) Caregiver training

VA Aid and Attendance (A&A) and Housebound Benefits

Michigan VA Aid and Attendance/Housebound

Age 65+ or disabled veteran/spouse
General Michigan resident, wartime service, need for ADL help (A&A) or homebound.
Income Limits (2025) Net income < ~$1,984/month (veteran with dependent, A&A); pension offsets income.
Asset Limits ~$155,356 net worth limit
MI

High veteran demand in urban/rural areas.

Benefits
Cash (~$1,433-$2,642/month veteran, ~$951-$1,318 spouse) for care costs

Frequently Asked Questions about Clark Retirement at Keller Lake

What neighborhood is Clark Retirement at Keller Lake in?

Clark Retirement at Keller Lake is in the East Paris neighborhood of Grand Rapids.

Is Clark Retirement at Keller Lake in a walkable area?

Clark Retirement at Keller Lake has a walk score of 34. Somewhat walkable. A few nearby services may be reachable on foot, but most trips require transportation.

What is the occupancy rate at Clark Retirement at Keller Lake?

Clark Retirement at Keller Lake's occupancy is 70.3%.

Are there photos of Clark Retirement at Keller Lake?

Yes — there are 7 photos of Clark Retirement at Keller Lake in the photo gallery on this page.

What is the address of Clark Retirement at Keller Lake?

Clark Retirement at Keller Lake is located at 2499 Forest Hill Ave SE, Grand Rapids, MI 49546.

What is the phone number of Clark Retirement at Keller Lake?

(616) 278-6520 will put you in contact with the team at Clark Retirement at Keller Lake.

Is Clark Retirement at Keller Lake Medicare or Medicaid certified?

Yes — Clark Retirement at Keller Lake is a CMS-certified provider of Medicare and Medicaid.

Guides for Better Senior Living

Care Cost Calculator: See Prices in Your Area

Nursing Home Data Explorer

Don’t Wait Too Long: 7 Red Flag Signs Your Parent Needs Assisted Living Now

The True Cost of Assisted Living in 2025 – And How Families Are Paying For It

Understanding Senior Living Costs: Pricing Models, Discounts & Financial Assistance