Colonial Health and Rehab Center
Nursing Home & Assisted Living · Colorado Springs, CO
CMS overall rating Info CMS (the Centers for Medicare & Medicaid Services) is the federal agency that rates nursing home quality. Its Overall Rating runs from 1 to 5 stars, combining health inspections, staffing, and quality measures, with inspections weighted most heavily.

Colonial Health and Rehab Center

Nursing Home & Assisted Living · Colorado Springs, CO
CMS overall rating Info CMS (the Centers for Medicare & Medicaid Services) is the federal agency that rates nursing home quality. Its Overall Rating runs from 1 to 5 stars, combining health inspections, staffing, and quality measures, with inspections weighted most heavily.
Calculator: See prices in your area
Colonial Health and Rehab Center accepts Medicare, Medicaid, and private pay.

Overview of Colonial Health and Rehab Center

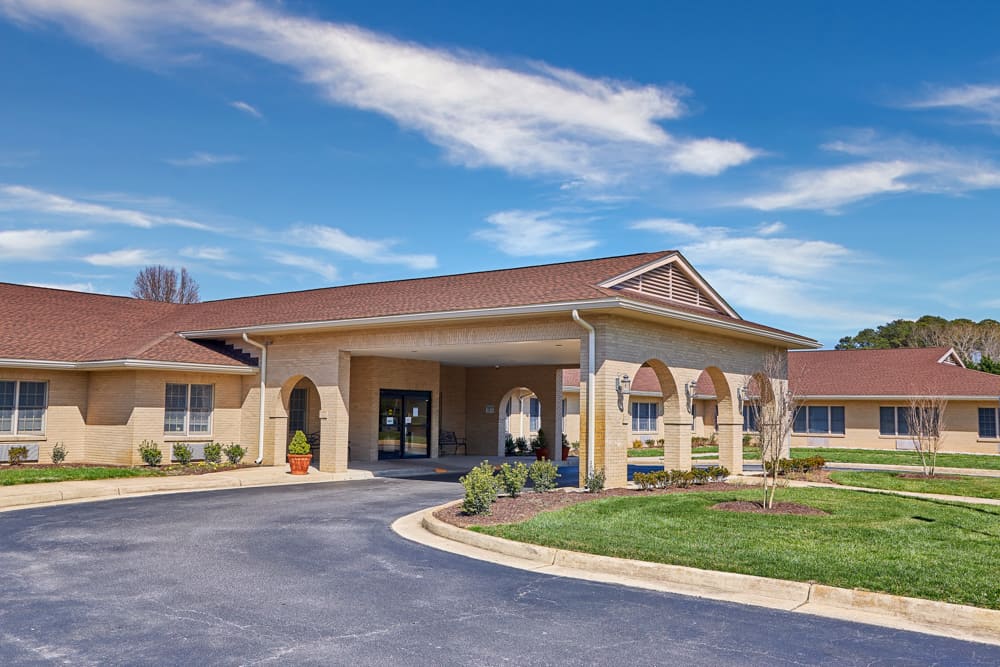
Colonial Health and Rehab Center at 1340 E Fillmore St has been a fixture in northeast Colorado Springs since 1963. That is over 60 years of history, which is impressive for any facility. It is an 80-bed community that handles both nursing and assisted living. You are about 2.9 miles from the city center, and with a Walk Score of 65, you can actually manage a few errands on foot, which is a nice perk for this kind of place.

Right now, they have 74 of their 80 beds filled, which is 86.8% occupancy. The average stay here is 437 days; that’s nearly 15 months, so this is definitely more of a long-term home than a place for quick rehab. Residents get 3 hours and 11 minutes of nursing care every day. That breaks down into 1 hour and 50 minutes from nurse aides and 20 minutes from registered nurses.

They accept Medicare, Medicaid, and private pay, and they have an active resident council on-site. Looking at their state inspections, they tend to focus on the usual suspects like medication management, care documentation, resident rights, and injury prevention.

Since this place is designed for extended care rather than short-term recovery, and given how long they have been around, it feels like a very stable, established choice. If you are looking for long-term placement in Colorado Springs and need a facility that accepts all major payment types, this is a solid, reliable option that has stood the test of time.

Quality ratings

Measured by Centers for Medicare & Medicaid Services (CMS)

Overall rating Info The Overall CMS Rating combines results from health inspections, staffing levels and quality measures. Health inspections carry the most weight. Staffing and quality scores can increase or decrease the final rating based on performance compared to state and national standards.
▼ 68.2% Below CO avg. ▼ 68.2% Below CO avg.CO average: 3.1Click the badge to see the full State ranking.Click here to see the full State ranking.
Health Inspection Info Based on the results of the facility's three most recent standard inspections and any complaint investigations. CMS reviews the number, scope, and severity of deficiencies, with more recent findings weighted more heavily.
▼ 27.8% Below CO avg. ▼ 27.8% Below CO avg.CO average: 2.8Click the badge to see the full State ranking.Click here to see the full State ranking.
Staffing Info Measures average nursing staff hours per resident per day, including Registered Nurses (RNs) and total nursing staff. Ratings are adjusted based on the level of care residents require and are compared to state and national benchmarks.
▼ 67.1% Below CO avg. ▼ 67.1% Below CO avg.CO average: 3.0Click the badge to see the full State ranking.Click here to see the full State ranking.
Quality Measures Info Based on clinical and physical health indicators reported to CMS, such as hospital readmissions, falls, pressure ulcers, and improvements in mobility. These measures reflect how well residents' health needs are being managed.
▼ 51.8% Below CO avg. ▼ 51.8% Below CO avg.CO average: 4.1Click the badge to see the full State ranking.Click here to see the full State ranking.

Staffing hours breakdown

Info Daily nursing hours per resident by staff type, reported to CMS. Higher is generally better — compare this facility to state and national averages to see where staffing stands.

Hours per resident per day — compared to Colorado state averages

Total nursing care / resident Info This home is ranked 158th out of 215 homes in Colorado for nurse hours. Total adjusted nursing hours per resident per day, combining RN, LPN, and aide time. CMS adjusts this for case-mix so facilities can be fairly compared.
3h 11m per day
Rank #158 / 215Nurse hours — State benchmarkedThis home is ranked 158th out of 215 homes in Colorado. Shows adjusted nurse hours per resident per day benchmarked to the Colorado average, with a ranking across 215 Colorado facilities. More hours mean more direct care. The national average is about 3.5 hrs; below 3.0 is a red flag.Rankings are based only on facilities in Colorado that report data for that category. Facilities without available data are excluded from the ranking.Click the rank badge to see the full State ranking.Click here to see the full State ranking.
This facility Colorado avg (3h 52m per day)
vs Colorado avg
-17%

5 of 6 metrics below state avg

Standout metric LPN / LVN is +12% above state avg
Staff typeHours / Day / Residentvs state avg
Registered Nurse (RN) Info RNs hold the highest nursing license and can assess residents, interpret test results, and direct care plans. More RN hours per day often signals stronger clinical oversight and faster response to health changes. 20m per day ▼ 59% State avg: 50m per day · National avg: 41m per day
LPN / LVN Info Licensed Practical Nurses (LPNs) or Licensed Vocational Nurses (LVNs) deliver routine hands-on care — medication administration, wound dressing, and monitoring vital signs. They work under RN supervision and make up a large share of daily bedside care. 46m per day ▲ 12% State avg: 41m per day · National avg: 52m per day
Nurse Aide Info Certified Nurse Aides (CNAs) provide the most direct day-to-day assistance: bathing, dressing, feeding, and mobility. Nurse aide hours are typically the largest staffing category and directly affect residents' quality of life. 1h 50m per day ▼ 18% State avg: 2h 13m per day · National avg: 2h 21m per day
Weekend Total Nursing Info Combined nursing hours (RN + LPN + Nurse Aide) per resident per day on weekends. Staffing often drops on weekends — this figure reveals whether the facility maintains adequate coverage outside of weekday hours. 2h 36m per day ▼ 21% State avg: 3h 17m per day · National avg: 3h 26m per day
Physical Therapist Info Hours per resident per day provided by licensed Physical Therapists (PTs) or PT Assistants. PT services help residents recover mobility after injury or illness and are especially important for post-acute (short-stay) rehabilitation. 1m per day ▼ 73% State avg: 5m per day · National avg: 4m per day
Weekend RN Info Registered nurse hours specifically on weekends. Facilities sometimes reduce RN presence on Saturdays and Sundays — a low weekend RN figure compared to weekday hours can indicate reduced clinical oversight when most administrative staff are absent. 17m per day ▼ 53% State avg: 36m per day · National avg: 29m per day

Capacity and availability

This home usually has availability

Lower occupancy than the Colorado average: 76.5%
Occupancy rate
48.8% Rank #186 / 221Occupancy rate — State benchmarkedThis home is ranked 186th out of 221 homes in Colorado. Shows this facility's occupancy rate versus the Colorado average, with its Statewide rank out of 221. Higher occupancy signals strong local demand and financial stability.Rankings are based only on facilities in Colorado that report data for that category. Facilities without available data are excluded from the ranking.Click the rank badge to see the full State ranking.Click here to see the full State ranking.
Avg. Length of Stay
437 days
Bed community size
80-bed community Rank #237 / 533Bed count — State benchmarkedThis home is ranked 237th out of 533 homes in Colorado. Shows this facility's certified or reported bed count compared to other Colorado facilities. Larger communities may offer more amenities, programs, and on-site services for residents and families.Rankings are based only on facilities in Colorado that report data for that category. Facilities without available data are excluded from the ranking.Click the rank badge to see the full State ranking.Click here to see the full State ranking.
A larger shared setting that may offer more common spaces and organized community services.
Walk Score
Walk Score: 65 / 100 Rank #301 / 872Walk Score — State benchmarkedThis home is ranked 301st out of 872 homes in Colorado. Shows how walkable this facility's neighborhood is compared to the average Walk Score across Colorado facilities. Higher scores benefit residents, families, and staff.Rankings are based only on facilities in Colorado that report data for that category. Facilities without available data are excluded from the ranking.Click the rank badge to see the full State ranking.Click here to see the full State ranking.
Moderately walkable. Some errands can be accomplished on foot, with a mix of nearby amenities.
BBB Rating
BBB Rating: A+ (Not Accredited)
An independent rating from the Better Business Bureau based on factors such as complaint history, transparency, and business practices.
How BBB ratings work

Staffing

Key information about the people who lead and staff this community.

Leadership

ContactMs. Melody Sedillo, General Manager

Contact Colonial Health and Rehab Center

Inspection History

In Colorado, the Department of Public Health and Environment, Health Facilities Division is the regulatory body that performs unannounced surveys and publishes facility inspection findings.

Since 2019 · 7 years of data 76 deficiencies

Inspection Scorecard Info This scorecard compares key inspection, deficiency, and complaint metrics at this facility against the Colorado state average. Metrics rated ≥15% worse than average are highlighted in red; those ≥15% better are highlighted in green.

Since 2019 vs. Colorado state average
Overall vs. CO average 2 Worse Metrics worse than Colorado average:
• Total deficiencies (153% above)
• Deficiencies per year (153% above)
0 Better No metrics in this bucket.
Latest Inspection December 4, 2025 Complaint Investigation

Deficiencies Info Deficiencies are formal regulatory issues recorded during state inspections.

This FacilityCO Averagevs. CO Avg
Total deficiencies Info Formal regulatory issues recorded by inspectors across all inspection types. 7630 This facility has 153% more total deficiencies than a typical Colorado nursing home (76 vs. CO avg 30).↑ 153% worse
Deficiencies per year Info Average deficiencies per year since 2019. 10.94.3 This facility has 153% more deficiencies per year than a typical Colorado nursing home (10.9 vs. CO avg 4.3).↑ 153% worse

Inspection Reports Summary Info An editor-reviewed summary of the themes and findings across this facility's recent inspection reports.

  • December 4, 2025 complaint investigation substantiated verbal abuse by Resident #15 and unsafe mechanical lift use causing a resident fall without injury, with two related deficiencies cited.
  • July 24, 2025 routine inspection found 14 deficiencies including repeated failures in abuse prevention, psychotropic medication management, wound care, fall prevention, catheter care, and dementia interventions.
  • October 17, 2024 complaint investigation found failure to assist four residents in choosing their preferred attending physician after a provider change, with missing informed consent documentation.

Health Inspection History

Inspections since 2019
Total health inspections 4

Colorado average 4.8


Last Health inspection on Jul 2025

Total health citations
36 Rank #176 / 221Health citations — State benchmarkedThis home is ranked 176th out of 221 homes in Colorado. Shows this facility's total health deficiency citations benchmarked to the Colorado State average, with a ranking across all 221 CO facilities. Lower citation counts earn a better rank.Rankings are based only on facilities in Colorado that report data for that category. Facilities without available data are excluded from the ranking.Click the rank badge to see the full State ranking.Click here to see the full State ranking.

Colorado average 24.8

Citations per inspection
9 Rank #209 / 221Citations per inspection — State benchmarkedThis home is ranked 209th out of 221 homes in Colorado. Shows average deficiency citations per CMS inspection for this facility versus the Colorado mean across 221 facilities with citation data. Lower is better.Rankings are based only on facilities in Colorado that report data for that category. Facilities without available data are excluded from the ranking.Click the rank badge to see the full State ranking.Click here to see the full State ranking.

Colorado average 5.2


Health citations are formal notices following inspections when they fail to comply with safety and care standards.

35 of 36 citations resulted from standard inspections; and 1 of 36 resulted from complaint investigations.

Breakdown of citation severity (last 7 years)
Critical health citations
0
100% better than Colorado average

Colorado average: 0.4


Serious health citations
3
43% worse than Colorado average

Colorado average: 2.1

0 critical citations Colorado average: 0.4

3 serious citations Colorado average: 2.1

33 moderate citations Colorado average: 22.2

0 minor citations Colorado average: 0.2
Citations history (last 7 years)
Abuse/Neglect moderate citation Jul 24, 2025
Corrected

Abuse/Neglect moderate citation Jul 24, 2025
Corrected

Infection Control moderate citation Jul 24, 2025
Corrected

Pharmacy moderate citation Jul 24, 2025
Corrected

Staffing Data

Reporting period: October 1 – December 31, 2025 (Q4 2025). Source: CMS Payroll-Based Journal report.

Total staff 88
Employees 74
Contractors 14
Staff to resident ratio 1.19 : 1
37% fewer staff per resident than Colorado average
Colorado average ratio: 1.88 : 1 Colorado average ratio: 1.88 : 1See full Colorado ranking
Avg staff/day 31
Average shift 8.5 hours
0% compared with Colorado average
Colorado average: 8.3 hours Colorado average shift: 8.3 hoursSee full Colorado ranking
Total staff hours (quarter) 24,327

Nursing staff breakdown

Q4 2025 · Oct 1 – Dec 31 More info This data comes from the CMS Payroll-Based Journal report covering October 1 – December 31, 2025.
Registered Nurse

Manages medical care and health needs.

RN Staff Info All 6 RN Staff are full-time employees. No contractors work on this role. 6
Average shift length Info Average shift length. Calculated as total hours divided by days worked and average staff per day. 9.8 hours
Licensed Practical Nurse

Assists with medical care and medications.

LPN Staff Info All 15 LPN Staff are full-time employees. No contractors work on this role. 15
Average shift length Info Average shift length. Calculated as total hours divided by days worked and average staff per day. 9.3 hours
Certified Nursing Assistant

Helps with daily care and mobility.

CNA Staff Info All 42 CNA Staff are full-time employees. No contractors work on this role. 42
Average shift length Info Average shift length. Calculated as total hours divided by days worked and average staff per day. 9 hours

Contractor staffing

Q4 2025 · Oct 1 – Dec 31 More info This data comes from the CMS Payroll-Based Journal report covering October 1 – December 31, 2025.

Total hours from contractors

3.5%

856 contractor hours this quarter

Speech Language Pathologist: 5 Physical Therapy Assistant: 2 Qualified Social Worker: 2 Medical Director: 1 Mental Health Service Worker: 1 Occupational Therapy Assistant: 1 Occupational Therapy Aide: 1 Respiratory Therapy Technician: 1

Staff by category

Q4 2025 · Oct 1 – Dec 31 More info This data comes from the CMS Payroll-Based Journal report covering October 1 – December 31, 2025.
Certified Nursing Assistant4204212,54492100%9
Licensed Practical Nurse150155,23592100%9.3
Registered Nurse6061,8509098%9.8
Other Dietary Services Staff3031,2628289%7
Occupational Therapy Aide4157537480%6.6
Mental Health Service Worker1125037076%7.1
Nurse Practitioner1014966267%8
Speech Language Pathologist0554472729%7
Administrator1014455358%8.4
Dietitian1014245560%7.7
Physical Therapy Assistant0221882527%7
Respiratory Therapy Technician0111572022%7.9
Medical Director011111415%0.8
Qualified Social Worker022655%1.2
Occupational Therapy Assistant011633%2
42 Certified Nursing Assistant
% of Days 100%
15 Licensed Practical Nurse
% of Days 100%
6 Registered Nurse
% of Days 98%
3 Other Dietary Services Staff
% of Days 89%
5 Occupational Therapy Aide
% of Days 80%
2 Mental Health Service Worker
% of Days 76%
1 Nurse Practitioner
% of Days 67%
5 Speech Language Pathologist
% of Days 29%
1 Administrator
% of Days 58%
1 Dietitian
% of Days 60%
2 Physical Therapy Assistant
% of Days 27%
1 Respiratory Therapy Technician
% of Days 22%
1 Medical Director
% of Days 15%
2 Qualified Social Worker
% of Days 5%
1 Occupational Therapy Assistant
% of Days 3%

Penalties and fines

Includes penalties issued in 2023

Federal penalties imposed by CMS for regulatory violations, including civil money penalties (fines) and denials of payment for new Medicare/Medicaid admissions.

Source: CMS Penalties Database (Data as of Jan 2026)

Total fines amount $24K Rank #146 / 221Federal fines — State benchmarkedThis home is ranked 146th out of 221 homes in Colorado. Shows this facility's cumulative CMS federal fine dollars versus the Colorado average among facilities with fines, and where it ranks among 221 facilities in the pool. Lower total dollars mean a better rank.Rankings are based only on facilities in Colorado that report data for that category. Facilities without available data are excluded from the ranking.Click the rank badge to see the full State ranking.Click here to see the full State ranking.
38% lower than Colorado average

Colorado average: $40K

Number of fines 1
55% fewer fines than Colorado average

Colorado average: 2.2

Payment Denials Info Serious action where Medicare and/or Medicaid temporarily stops payments for new residents until issues are fixed. 1
276% more payment denials than Colorado average

Colorado average: 0.3

Fines amount comparison
This facility $24K
Colorado average $40K
Penalty History

Penalties are imposed by CMS for violations of federal nursing home regulations.

2 penalties in the past 3 years

Multiple penalties were reported in the last 3 years.

Civil Money Penalty Info Fines imposed for noncompliance, which can be assessed per day or per instance of violation. Aug 31, 2023
$24K
Payment Denial Info Serious action where Medicare and/or Medicaid temporarily stops payments for new residents until issues are fixed. Aug 31, 2023
40 days

Last updated: Jan 2026

Quality of care over time

These measures show how residents usually do over time at this home, based on health outcomes and preventive care.

High-risk clinical events score Info A composite score based on pressure ulcers, falls with injury, weight loss, walking ability decline, and activities of daily living decline. 13.8
52% worse than Colorado average

Colorado average: 9.0

Functional decline score Info A composite score based on activities of daily living decline, walking ability decline, and incontinence. 26.1
39% worse than Colorado average

Colorado average: 18.8

Long-stay resident measures
Average Colorado avg: 3.9 Info CMS star rating based on long-stay quality measure performance. 5 stars = significantly above average, 1 star = significantly below average.
Need for Help with Daily Activities Increased Info Percent of long-stay residents whose need for help with daily activities has increased 24.2%
51% worse than Colorado average

Colorado average: 16.0%

Walking Ability Worsened Info Percent of long-stay residents whose ability to move independently worsened 31.5%
85% worse than Colorado average

Colorado average: 17.0%

Low Risk Residents with Bowel/Bladder Incontinence Info Percent of low risk long-stay residents who lose control of their bowels or bladder 22.5%
In line with Colorado average

Colorado average: 23.2%

Falls with Major Injury Info Percent of long-stay residents experiencing one or more falls with major injury 3.3%
In line with Colorado average

Colorado average: 3.3%

High Risk Residents with Pressure Ulcers Info Percent of long-stay high risk residents with pressure ulcers 4.5%
17% worse than Colorado average

Colorado average: 3.9%

Urinary Tract Infection Info Percent of long-stay residents with a urinary tract infection 0.8%
48% better than Colorado average

Colorado average: 1.4%

Lost Too Much Weight Info Percent of long-stay residents who lose too much weight 5.3%
In line with Colorado average

Colorado average: 5.2%

Depressive Symptoms Info Percent of long-stay residents who have depressive symptoms 13.5%
89% worse than Colorado average

Colorado average: 7.2%

Antipsychotic Use Info Percent of long-stay residents who received an antipsychotic medication 34.6%
84% worse than Colorado average

Colorado average: 18.8%

Pneumococcal Vaccine Info Percent of long-stay residents assessed and appropriately given the pneumococcal vaccine 93.0%
In line with Colorado average

Colorado average: 93.3%

Influenza Vaccine Info Percent of long-stay residents assessed and appropriately given the seasonal influenza vaccine 93.1%
In line with Colorado average

Colorado average: 94.7%

Hospitalizations per 1,000 days Info Number of hospitalizations per 1,000 long-stay resident days. 2.40
85% worse than Colorado average

Colorado average: 1.30

ED visits per 1,000 days Info Number of outpatient emergency department visits per 1,000 long-stay resident days. 0.94
44% better than Colorado average

Colorado average: 1.67

Short-stay resident measures
Pneumococcal Vaccine Info Percent of short-stay residents assessed and appropriately given the pneumococcal vaccine 59.0%
23% worse than Colorado average

Colorado average: 76.6%

Breakdown by payment type

Medicare

13% of new residents, usually for short-term rehab.

Typical stay 3 months

Private pay

55% of new residents, often for short stays.

Typical stay 25 days

Medicaid

33% of new residents, often for long-term daily care.

Typical stay 3 - 4 years

Facility Characteristics

Source: CMS Long-Term Care Facility Characteristics (Data as of Jan 2026)

Total residents 74
Medicare
1
1.4% of residents
Medicaid
73
98.6% of residents
Programs & Services
Residents Group

Residents meet regularly to discuss policies, care quality, and activities

Active Resident Council

Organized group of residents that meets regularly to discuss facility policies, quality of life, and activities.

Finances and operations

Based on CMS SNF Cost Report for fiscal year ending in 12/2023.

For-profit
Operated by a single business entity.
Net patient revenue Info Net patient revenue — what the home actually collects for resident care, after contractual allowances, bad debt and discounts are subtracted from its gross charges (CMS cost report, Worksheet G-3). It covers resident care only; money the home earns from other sources is shown separately as "Other income."
$7.5M
Net patient income Info Net patient income: net patient revenue minus the home's total operating expenses. A positive figure means it earns more from resident care than it spends to deliver it; a negative figure means the opposite. It excludes non-operating "other income."
-$1.0M
For-profit Operated by a single business entity.
Net patient revenue Info Net patient revenue — what the home actually collects for resident care, after contractual allowances, bad debt and discounts are subtracted from its gross charges (CMS cost report, Worksheet G-3). It covers resident care only; money the home earns from other sources is shown separately as "Other income."
$7.5M Rank #112 / 221Revenue — State benchmarkedThis home is ranked 112th out of 221 homes in Colorado. Shows this facility's annual revenue compared to the Colorado average. Higher revenue generally means more resources for staffing and capital — read alongside Payroll %.Rankings are based only on facilities in Colorado that report data for that category. Facilities without available data are excluded from the ranking.Click the rank badge to see the full State ranking.Click here to see the full State ranking.
Net patient income Info Net patient income: net patient revenue minus the home's total operating expenses. A positive figure means it earns more from resident care than it spends to deliver it; a negative figure means the opposite. It excludes non-operating "other income."
-$1.0M
Other income Info Money the home earns outside of resident care — such as investments, grants, rentals and other non-operating sources (CMS cost report, Worksheet G-3). It is tracked separately from net patient revenue: it is not part of that figure, and it is not included in net patient income.
$71.1K
Payroll costs Info Staff salaries plus wage-related costs — benefits such as payroll taxes, health insurance and retirement — from the home's own accounting records (CMS cost report, Worksheet A). Contract or agency labor is counted separately, under other operating costs. Rank #156 / 221Payroll — State benchmarkedThis home is ranked 156th out of 221 homes in Colorado. Shows total annual staff payroll benchmarked to the Colorado average. Higher payroll investment relative to peers often signals better staffing and less reliance on cheaper contract labor.Rankings are based only on facilities in Colorado that report data for that category. Facilities without available data are excluded from the ranking.Click the rank badge to see the full State ranking.Click here to see the full State ranking.
$4.6M 61.9% of net patient revenue Info Payroll as a share of revenue: staff salaries and wage-related benefits divided by net patient revenue. A higher figure means more of each revenue dollar goes to staff pay. Rank #179 / 221Payroll % — State benchmarkedThis home is ranked 179th out of 221 homes in Colorado. Shows payroll as a percentage of revenue versus the Colorado average. Well-run Colorado facilities typically land around 59–66% — the top third Statewide. Below 25% may signal understaffing or heavy agency use — read with Staffing ratings.Rankings are based only on facilities in Colorado that report data for that category. Facilities without available data are excluded from the ranking.Click the rank badge to see the full State ranking.Click here to see the full State ranking.
Other operating costs Info Everything it costs to run the home apart from payroll — food, utilities, supplies, maintenance, contract labor and administration. Calculated as total operating expense minus payroll (staff salaries and wage-related benefits).
$3.9M
Total costs Info The home's total operating expense for the year — all the costs of running it, salaries included (CMS cost report, Worksheet G-3).
$8.6M

Who this home usually serves

TYPE OF STAY

Mostly long-term care residents

Most residents stay for extended periods and receive ongoing daily care.

Most new residents arrive under private pay (55% of admissions), and a typical private pay stay runs around 25 days.

Admissions
55 total

Coverage residents most often arrive under.

Medicare 13%
Private pay 55%
Medicaid 33%
Discharges
58 total

Coverage residents most often leave under.

Medicare 3%
Private pay 38%
Medicaid 59%

Places of interest near Colonial Health and Rehab Center

Address 2.9 miles from city center Info Estimated distance in miles from Colorado Springs's city center to Colonial Health and Rehab Center's address, calculated via Google Maps.

Calculate Travel Distance to Colonial Health and Rehab Center

Add your location

Address

Compare Nursing Homes around Colorado Springs

The information below is reported by the Colorado Department of Public Health and Environment, Health Facilities Division.

4 facilities compared · CMS & CO Dept. of Health data

Liberty Heights
NH
AL
IL
MC
RC
Colorado Springs (Northgate)
60
Facility 60
CO AVG 76
Rank #303 / 533
95.2%
Facility 95.2%
CO AVG 76.5%
Rank #8 / 221
+24%
4.51
Facility 4.51
CO AVG 3.86
Rank #32 / 215
+17%+17%
$39.0k
Facility $39.0k
CO AVG $39.2k
Rank #172 / 221
13
Facility 13
CO AVG 24.8
Rank #35 / 221
4.3
Facility 4.3
CO AVG 5.2
Rank #76 / 221
-38-
40
Facility 40
CO AVG 51
Rank #574 / 872
Ccrc Ops Mb1-T LLC
$18.7M
Facility $18.7M
CO AVG $11.2M
Rank #57 / 221
$8.7M
Facility $8.7M
CO AVG $4.9M
Rank #41 / 221
46.4%
Facility 46.4%
CO AVG 46.6%
Rank #68 / 221
65305
Sunny Vista Living Center
NH
AL
IL
MC
Colorado Springs (Downtown)
116
Facility 116
CO AVG 76
Rank #97 / 533
91.4%
Facility 91.4%
CO AVG 76.5%
Rank #33 / 221
+20%- -34%-
$0
Facility $0
CO AVG $39.2k
Rank #1 / 221
17
Facility 17
CO AVG 24.8
Rank #68 / 221
3.4
Facility 3.4
CO AVG 5.2
Rank #51 / 221
-111A+
95
Facility 95
CO AVG 51
Rank #7 / 872
Sunny Vista Living Center
$14.0M
Facility $14.0M
CO AVG $11.2M
Rank #68 / 221
$8.0M
Facility $8.0M
CO AVG $4.9M
Rank #42 / 221
56.9%
Facility 56.9%
CO AVG 46.6%
Rank #41 / 221
65254
Medallion Post Acute Rehabilitation
NH
AL
IL
MC
Colorado Springs (Downtown)
60
Facility 60
CO AVG 76
Rank #303 / 533
55.0%
Facility 55.0%
CO AVG 76.5%
Rank #179 / 221
-28%
3.52
Facility 3.52
CO AVG 3.86
Rank #117 / 215
-78%-9%
$86.7k
Facility $86.7k
CO AVG $39.2k
Rank #205 / 221
25
Facility 25
CO AVG 24.8
Rank #129 / 221
4.2
Facility 4.2
CO AVG 5.2
Rank #73 / 221
733-
95
Facility 95
CO AVG 51
Rank #7 / 872
-
$10.0M
Facility $10.0M
CO AVG $11.2M
Rank #75 / 221
$5.7M
Facility $5.7M
CO AVG $4.9M
Rank #121 / 221
57%
Facility 57%
CO AVG 46.6%
Rank #190 / 221
65113
Colonial Health and Rehab Center
NH
AL
Colorado Springs (Northeast Colorado Springs)
80
Facility 80
CO AVG 76
Rank #237 / 533
48.8%
Facility 48.8%
CO AVG 76.5%
Rank #186 / 221
-36%
3.19
Facility 3.19
CO AVG 3.86
Rank #158 / 215
-52%-17%
$24.5k
Facility $24.5k
CO AVG $39.2k
Rank #146 / 221
36
Facility 36
CO AVG 24.8
Rank #176 / 221
9.0
Facility 9.0
CO AVG 5.2
Rank #209 / 221
339A+
65
Facility 65
CO AVG 51
Rank #301 / 872
-
$7.5M
Facility $7.5M
CO AVG $11.2M
Rank #112 / 221
$4.6M
Facility $4.6M
CO AVG $4.9M
Rank #156 / 221
61.9%
Facility 61.9%
CO AVG 46.6%
Rank #179 / 221
65225

Financial Assistance for
Nursing Home in Colorado

Colonial Health and Rehab Center is located in Colorado Springs, Colorado.
Here are the financial assistance programs available to residents in Colorado.

Get Financial aid guidance

Elderly, Blind, and Disabled Waiver

Colorado Medicaid EBD Waiver

Age 65+ or disabled
General Colorado resident, Medicaid- eligible, nursing home-level care need.
Income Limits (2025) ~$2,829/month 300% FBR, individual
Asset Limits $2,000 (individual), $3,000 (couple).
CO

Requires level-of-care assessment by case manager.

Benefits
Personal care (5-7 hours/day) Respite care (up to 240 hours/year) Adult day care ($65/day) Home modifications ($1,500 avg.)

Old Age Pension (OAP) Health Care Program

Colorado OAP

Age 60+
General Colorado resident.
Income Limits ~$1,215/month individual
Asset Limits $2,000 individual
CO

Supplements SSI; limited medical coverage.

Benefits
Cash (~$100-$800/month) Limited in-home care (2-3 hours/week) Medical assistance

Program of All-Inclusive Care for the Elderly (PACE)

Colorado Medicaid PACE

Age 55+
General Colorado resident, nursing home-level care need, safe with PACE support.
Income Limits (2025) ~$2,829/month 300% FBR
Asset Limits $2,000 (individual), $3,000 (couple).
CO

Limited to specific regions (e.g., Denver, Pueblo).

Benefits
All-inclusive care—personal care (5-7 hours/day) Meals Transportation Therapy Medical visits

Home Care Allowance (HCA)

Colorado Home Care Allowance (HCA)

Age
General Seniors typically 65+, Age 5+ with disability, Colorado resident, financial/functional need.
Income Limits (2025) ~$1,004/month individual, stricter than waivers
Asset Limits $2,000 (individual), $3,000 (couple).
CO

Must need help with ADLs; not Medicaid-waiver eligible.

Benefits
Personal care (~4-6 hours/day, paid to provider) E.g. Bathing Dressing

Frequently Asked Questions about Colonial Health and Rehab Center

What neighborhood is Colonial Health and Rehab Center in?

Colonial Health and Rehab Center is in the Northeast Colorado Springs neighborhood of Colorado Springs.

Is Colonial Health and Rehab Center in a walkable area?

Colonial Health and Rehab Center has a walk score of 65. Moderately walkable. Some errands can be accomplished on foot, with a mix of nearby amenities.

What is the occupancy rate at Colonial Health and Rehab Center?

Colonial Health and Rehab Center's occupancy is 86.8%.

Does Colonial Health and Rehab Center operate as a for-profit or non-profit?

Colonial Health and Rehab Center is registered as a for-profit in CO.

Are there photos of Colonial Health and Rehab Center?

Yes — there is 1 photo of Colonial Health and Rehab Center in the photo gallery on this page.

What is the address of Colonial Health and Rehab Center?

Colonial Health and Rehab Center is located at 1340 E Fillmore St, Colorado Springs, CO 80907.

What is the phone number of Colonial Health and Rehab Center?

(757) 496-7100 will put you in contact with the team at Colonial Health and Rehab Center.

Guides for Better Senior Living

Care Cost Calculator: See Prices in Your Area

Nursing Home Data Explorer

Don’t Wait Too Long: 7 Red Flag Signs Your Parent Needs Assisted Living Now

The True Cost of Assisted Living in 2025 – And How Families Are Paying For It

Understanding Senior Living Costs: Pricing Models, Discounts & Financial Assistance