Community Care On Palm
Nursing Home, Assisted Living, Respite Care & Memory Care · Riverside County, CA
CMS overall rating Info The Overall CMS Rating is scored from 1 to 5 stars and combines results from health inspections, staffing levels, and quality measures. Health inspections carry the most weight. Staffing and quality scores can increase or decrease the final rating based on performance compared to state and national standards.

Community Care On Palm

Nursing Home, Assisted Living, Respite Care & Memory Care · Riverside County, CA
CMS overall rating Info The Overall CMS Rating is scored from 1 to 5 stars and combines results from health inspections, staffing levels, and quality measures. Health inspections carry the most weight. Staffing and quality scores can increase or decrease the final rating based on performance compared to state and national standards.
Calculator: See prices in your area
Community Care On Palm accepts Medicare, Medicaid, and private pay.

Overview of Community Care on Palm

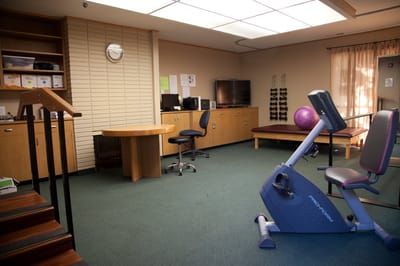
Experience genuine care with Community Care on Palm, a compassionate community in Riverside, CA that offers an array of rehabilitative services. The community helps residents recover successfully with the help of their professional therapists trained in physical, speech, and occupational therapy. Residents are well-cared for with access to 24/7 skilled nursing services and individualized care plans tailored to their preferences and needs.

Those looking for short-term stays can access the community’s respite care and adult day care program designed to offer companionship and relief for family caregivers. Living spaces here are designed to provide both comfort and opportunities for meaningful social interactions. With its round-the-clock care and customized services, the community warrants an effective delivery of care amidst a safe and nurturing environment.

(951) 686-9001

Quality ratings

Measured by Centers for Medicare & Medicaid Services (CMS)

Overall rating Info The Overall CMS Rating combines results from health inspections, staffing levels and quality measures. Health inspections carry the most weight. Staffing and quality scores can increase or decrease the final rating based on performance compared to state and national standards.
▲ 27.0% Above CA avg. ▲ 27.0% Above CA avg.Click the badge to see the full State ranking.Click here to see the full State ranking.
Health Inspection Info Based on the results of the facility's three most recent standard inspections and any complaint investigations. CMS reviews the number, scope, and severity of deficiencies, with more recent findings weighted more heavily.
▲ 7.3% Above CA avg. ▲ 7.3% Above CA avg.Click the badge to see the full State ranking.Click here to see the full State ranking.
Staffing Info Measures average nursing staff hours per resident per day, including Registered Nurses (RNs) and total nursing staff. Ratings are adjusted based on the level of care residents require and are compared to state and national benchmarks.
▼ 4.4% Below CA avg. ▼ 4.4% Below CA avg.Click the badge to see the full State ranking.Click here to see the full State ranking.
Quality Measures Info Based on clinical and physical health indicators reported to CMS, such as hospital readmissions, falls, pressure ulcers, and improvements in mobility. These measures reflect how well residents' health needs are being managed.
▲ 22.4% Above CA avg. ▲ 22.4% Above CA avg.Click the badge to see the full State ranking.Click here to see the full State ranking.

Staffing hours breakdown

Info Daily nursing hours per resident by staff type, reported to CMS. Higher is generally better — compare this facility to state and national averages to see where staffing stands.

Hours per resident per day — compared to California state averages

Total nursing care / resident Info This home is ranked 106th out of 275 homes in California.

Total adjusted nursing hours per resident per day, combining RN, LPN, and aide time. CMS adjusts this for case-mix so facilities can be fairly compared.
4h 15m per day
Rank #106 / 275Nurse hours — State benchmarkedThis home is ranked 106th out of 275 homes in California.Shows adjusted nurse hours per resident per day benchmarked to the California average, with a ranking across 275 California SNFs. More hours mean more direct care. The national average is about 3.5 hrs; below 3.0 is a red flag.Click the rank badge to see the full State ranking.Click here to see the full State ranking.
This facility California avg (4h 13m per day)
vs California avg
+1%

5 of 6 metrics below state avg

Staff typeHours / Day / Residentvs state avg
Registered Nurse (RN) Info RNs hold the highest nursing license and can assess residents, interpret test results, and direct care plans. More RN hours per day often signals stronger clinical oversight and faster response to health changes. 18m per day ▼ 54% State avg: 39m per day · National avg: 41m per day
LPN / LVN Info Licensed Practical Nurses (LPNs) or Licensed Vocational Nurses (LVNs) deliver routine hands-on care — medication administration, wound dressing, and monitoring vital signs. They work under RN supervision and make up a large share of daily bedside care. 1h 4m per day ▼ 12% State avg: 1h 13m per day · National avg: 52m per day
Nurse Aide Info Certified Nurse Aides (CNAs) provide the most direct day-to-day assistance: bathing, dressing, feeding, and mobility. Nurse aide hours are typically the largest staffing category and directly affect residents' quality of life. 2h 33m per day ▼ 4% State avg: 2h 39m per day · National avg: 2h 21m per day
Total Nursing (Weekend) Info Combined nursing hours (RN + LPN + Nurse Aide) per resident per day on weekends. Staffing often drops on weekends — this figure reveals whether the facility maintains adequate coverage outside of weekday hours. 3h 41m per day ▼ 10% State avg: 4h 5m per day · National avg: 3h 26m per day
Physical Therapist Info Hours per resident per day provided by licensed Physical Therapists (PTs) or PT Assistants. PT services help residents recover mobility after injury or illness and are especially important for post-acute (short-stay) rehabilitation. 5m per day ■ Avg State avg: 5m per day · National avg: 4m per day
RN (Weekend) Info Registered nurse hours specifically on weekends. Facilities sometimes reduce RN presence on Saturdays and Sundays — a low weekend RN figure compared to weekday hours can indicate reduced clinical oversight when most administrative staff are absent. 14m per day ▼ 53% State avg: 30m per day · National avg: 29m per day

Capacity and availability

This home is often near full

Occupancy higher than 95% suggests steady demand, but availability may be limited.

Higher occupancy than the California average: 84.7%
Occupancy rate 97.1% Rank #16 / 281Occupancy rate — State benchmarkedThis home is ranked 16th out of 281 homes in California.Shows this facility's occupancy rate versus the California average, with its Statewide rank out of 281. Higher occupancy signals strong local demand and financial stability.Click the rank badge to see the full State ranking.Click here to see the full State ranking.
Avg. Length of Stay 548 days
Occupancy rate
97.1% Rank #16 / 281Occupancy rate — State benchmarkedThis home is ranked 16th out of 281 homes in California.Shows this facility's occupancy rate versus the California average, with its Statewide rank out of 281. Higher occupancy signals strong local demand and financial stability.Click the rank badge to see the full State ranking.Click here to see the full State ranking.
Avg. Length of Stay
548 days

Who this home usually serves

TYPE OF STAY

Mix of rehab and long-term care

This home supports both short-term rehab and long-term care, with residents staying for a wide range of durations.

Breakdown by payment type

Medicare

35% of new residents, usually for short-term rehab.

Typical stay 11 - 12 months

Private pay

53% of new residents, often for short stays.

Typical stay 2 - 3 months

Medicaid

12% of new residents, often for long-term daily care.

Typical stay 14 - 15 years

Finances and operations

Privately-owned community
Home revenue
$7.4M
Profit
$720.3K
Privately-owned community
Home revenue
$7.4M Rank #243 / 279Revenue — State benchmarkedThis home is ranked 243rd out of 279 homes in California.Shows this facility's annual revenue compared to the California SNF average. Higher revenue generally means more resources for staffing and capital — read alongside Payroll %.Click the rank badge to see the full State ranking.Click here to see the full State ranking.
Profit
$720.3K
Payroll costs Info The portion of the home's budget spent on staff, including nurses, caregivers, and other employees who support care and operations. Rank #243 / 279Payroll — State benchmarkedThis home is ranked 243rd out of 279 homes in California.Shows total annual staff payroll benchmarked to the California average. Higher payroll investment relative to peers often signals better staffing and less reliance on cheaper contract labor.Click the rank badge to see the full State ranking.Click here to see the full State ranking.
$4.0M
53.7% of revenue Rank #85 / 279Payroll % — State benchmarkedThis home is ranked 85th out of 279 homes in California.Shows payroll as a percentage of revenue versus the California average. Well-run California SNFs typically land around 56–66% — the top third Statewide. Below 25% may signal understaffing or heavy agency use — read with Staffing ratings.Click the rank badge to see the full State ranking.Click here to see the full State ranking.
Other operating costs Info All remaining costs needed to run the home, such as food, utilities, building maintenance, supplies and administrative expenses.
$2.7M
Total costs $6.7M
Walk Score
Walk Score: 55 / 100 Rank #187 / 279Walk Score — State benchmarkedThis home is ranked 187th out of 279 homes in California.Shows how walkable this facility's neighborhood is compared to the average Walk Score across California SNFs. Higher scores benefit residents, families, and staff.Click the rank badge to see the full State ranking.Click here to see the full State ranking.
Moderately walkable. Some errands can be accomplished on foot, with a mix of nearby amenities.

What does this home offer?

Housing options icon

Housing Options: Shared Rooms.

Building type icon
Building type icon

Building Type: Single-story

Dining services icon

Dining Services

Recreational activities icon

Recreational Activities

Transportation services icon

Transportation Services

Types of Care at Community Care On Palm

Nursing Home Assisted Living Respite Care Memory Care

Contact Community Care On Palm

Health Inspection History

Inspections Since 2022
Total health inspections 14

California average 12.5


Last Health inspection on Apr 2025

Total health citations
52 Rank #185 / 279Health citations — State benchmarkedThis home is ranked 185th out of 279 homes in California.Shows this facility's total health deficiency citations benchmarked to the California State average, with a ranking across all 279 CA SNFs. Lower citation counts earn a better rank.Click the rank badge to see the full State ranking.Click here to see the full State ranking.

California average 50.2

Citations per inspection
3.71 Rank #105 / 279Citations per inspection — State benchmarkedThis home is ranked 105th out of 279 homes in California.Shows average deficiency citations per CMS inspection for this facility versus the California mean across 279 SNFs with citation data. Lower is better.Click the rank badge to see the full State ranking.Click here to see the full State ranking.

California average 4.65


Health citations are formal notices following inspections when they fail to comply with safety and care standards.

33 of 52 citations resulted from standard inspections; 17 of 52 resulted from complaint investigations; and 2 of 52 came from combined inspections (standard and complaint).

Breakdown of citation severity (last 4 years)
Critical Health citations
0
100% better than California average

California average: 0.4


Serious Health citations
3
200% worse than California average

California average: 1

0 critical citations California average: 0.4

3 serious citations California average: 1

49 moderate citations California average: 47.2

0 minor citations California average: 1.5
Citations history (last 4 years)
Nutrition moderate citation Apr 11, 2025
Corrected

Nutrition moderate citation Apr 11, 2025
Corrected

Nutrition moderate citation Apr 11, 2025
Corrected

Nutrition moderate citation Apr 11, 2025
Corrected

Financial Assistance for
Nursing Home in California

Community Care On Palm is located in Riverside, California.
Here are the financial assistance programs available to residents in California.

Get Financial aid guidance

Multipurpose Senior Services Program

MSSP (Medi-Cal Waiver)

Age 65+
General California resident, Medi-Cal eligible, nursing home risk.
Income Limits (2025) ~$2,829/month 300% FBR, individual
Asset Limits $2,000 (individual), $3,000 (couple).
CA

County-managed; waitlists possible.

Benefits
In-home support (4-6 hours/day) Respite care (14 days/year) Meals (~$6/meal) Transportation (8 trips/month) Care management

In-Home Supportive Services (IHSS)

California IHSS

Age 65+
General California resident, Medicaid-eligible or low-income.
Income Limits ~$1,732/month individual, Medi-Cal threshold
Asset Limits $2,000 individual
CA

Can hire family as caregivers.

Benefits
Personal care (up to 283 hours/month) Homemaker services Respite (varies)

Multipurpose Senior Services Program (MSSP)

CA MSSP

Age 65+
General California resident, Medi-Cal-eligible, nursing home-eligible but community-capable.
Income Limits ~$2,829/month 300% FBR, individual
Asset Limits $2,000 individual
CA

Available in 38 counties; waitlists common.

Benefits
Case management Respite care (up to 10 days/year) Minor home mods (avg. $500) Adult day care (~$50/day)

Property Tax Postponement Program (PTP)

CA PTP

Age 62+
General California resident, own and live in home, 40% equity.
Income Limits (2025) ~$51,500/year household, adjusted annually
Asset Limits Equity-based; no strict asset cap.
CA

Deferred taxes accrue interest (5% as of 2024); repaid upon sale/death.

Benefits
Property tax deferral (avg. $1,000-$3,000/year, varies by county)

Assisted Living Waiver (ALW)

CA ALW

Age 65+ or disabled
General California resident, Medi-Cal-eligible, nursing home-eligible.
Income Limits ~$2,829/month 300% FBR, individual
Asset Limits $2,000 individual
CA

Available in 15 counties (e.g., LA, Sacramento); waitlists common.

Benefits
Personal care in ALFs (5-7 hours/day) Medication management Social services

California CARES Program

CA CARES

Age
General Caregivers of California residents 60+ needing help with 3+ daily activities; no caregiver age limit.
Income Limits No strict limit; cost-sharing above ~$2,500/month threshold.
Asset Limits Not applicable; need-based.
CA

High demand in urban areas; complements IHSS respite.

Benefits
Respite care (up to 10 days/year) Counseling (4-6 sessions/year) Training (2-3 workshops/year) Supplies (~$200/year)

Places of interest near Community Care On Palm

Address 1.4 miles from city center Info Estimated distance in miles from Riverside's city center to Community Care On Palm's address, calculated via Google Maps.

Calculate Travel Distance to Community Care On Palm

Add your location

Address

Staffing Data

Reporting period: April 1 – June 30, 2025 (Q2 2025). Source: CMS Payroll-Based Journal report.

Total staff 73
Employees 73
Contractors 0
Staff to resident ratio 1.52:1
1520733% better than California average
California average ratio: 0.00:1 California average ratio: 0.00:1See full California ranking
Avg staff/day 32
Average shift 7 hours
9% worse than California average
California average: 7.7 hours California average shift: 7.7 hoursSee full California ranking
Total staff hours (quarter) 20,372

Nursing staff breakdown

Q2 2025 · Apr 1 – Jun 30 More info This data comes from the CMS Payroll-Based Journal report covering April 1 – June 30, 2025.
Registered Nurse

Manages medical care and health needs.

Total count 3
Average shift length Info Average shift length. Calculated as total hours divided by days worked and average staff per day. 7.9 hours

No contractors work on this role.

Licensed Practical Nurse

Assists with medical care and medications.

Total count 13
Average shift length Info Average shift length. Calculated as total hours divided by days worked and average staff per day. 7.2 hours

No contractors work on this role.

Certified Nursing Assistant

Helps with daily care and mobility.

Total count 37
Average shift length Info Average shift length. Calculated as total hours divided by days worked and average staff per day. 7.3 hours

No contractors work on this role.

Contractor staffing

Q2 2025 · Apr 1 – Jun 30 More info This data comes from the CMS Payroll-Based Journal report covering April 1 – June 30, 2025.

Total hours from contractors

0%

0 contractor hours this quarter

No contractor roles were reported this quarter.

Staff by category

Q2 2025 · Apr 1 – Jun 30 More info This data comes from the CMS Payroll-Based Journal report covering April 1 – June 30, 2025.
Certified Nursing Assistant3703711,11691100%7.3
Licensed Practical Nurse130134,21991100%7.2
Other Dietary Services Staff2027067178%8
Speech Language Pathologist3036458088%4.3
Clinical Nurse Specialist1015116369%8.1
RN Director of Nursing3034455662%6.3
Respiratory Therapy Technician1014447582%5.9
Nurse Practitioner1014365560%7.9
Mental Health Service Worker1013864954%7.9
Physical Therapy Assistant1013436774%5.1
Registered Nurse3032602932%7.9
Dietitian1012563437%7.5
Physical Therapy Aide2021933943%4.8
Administrator2021762224%8
Physician Assistant1011504044%3.7
Qualified Social Worker101873538%2.5
37 Certified Nursing Assistant
% of Days 100%
13 Licensed Practical Nurse
% of Days 100%
2 Other Dietary Services Staff
% of Days 78%
3 Speech Language Pathologist
% of Days 88%
1 Clinical Nurse Specialist
% of Days 69%
3 RN Director of Nursing
% of Days 62%
1 Respiratory Therapy Technician
% of Days 82%
1 Nurse Practitioner
% of Days 60%
1 Mental Health Service Worker
% of Days 54%
1 Physical Therapy Assistant
% of Days 74%
3 Registered Nurse
% of Days 32%
1 Dietitian
% of Days 37%
2 Physical Therapy Aide
% of Days 43%
2 Administrator
% of Days 24%
1 Physician Assistant
% of Days 44%
1 Qualified Social Worker
% of Days 38%

Facility Characteristics

Source: CMS Long-Term Care Facility Characteristics (Data as of Jan 2026)

Total residents 48
Medicare
25
52.1% of residents
Medicaid
21
43.8% of residents
Private pay or other
2
4.2% of residents
Programs & Services
Residents Group

Residents meet regularly to discuss policies, care quality, and activities

Active Resident Council

Organized group of residents that meets regularly to discuss facility policies, quality of life, and activities.

Quality of care over time

These measures show how residents usually do over time at this home, based on health outcomes and preventive care.

High-risk clinical events score Info A composite score based on pressure ulcers, falls with injury, weight loss, walking ability decline, and activities of daily living decline. 3.6
47% better than California average

California average: 6.6

Functional decline score Info A composite score based on activities of daily living decline, walking ability decline, and incontinence. 5.8
49% better than California average

California average: 11.3

Long-stay resident measures
Above average California avg: 4.2 Info CMS star rating based on long-stay quality measure performance. 5 stars = significantly above average, 1 star = significantly below average.
Need for Help with Daily Activities Increased Info Percent of long-stay residents whose need for help with daily activities has increased 10.2%
8% better than California average

California average: 11.1%

Walking Ability Worsened Info Percent of long-stay residents whose ability to move independently worsened 2.7%
78% better than California average

California average: 12.0%

Low Risk Residents with Bowel/Bladder Incontinence Info Percent of low risk long-stay residents who lose control of their bowels or bladder 4.5%
60% better than California average

California average: 11.3%

Falls with Major Injury Info Percent of long-stay residents experiencing one or more falls with major injury 1.1%
33% better than California average

California average: 1.7%

High Risk Residents with Pressure Ulcers Info Percent of long-stay high risk residents with pressure ulcers 3.2%
36% better than California average

California average: 5.0%

Urinary Tract Infection Info Percent of long-stay residents with a urinary tract infection 0.0%
100% better than California average

California average: 1.2%

Lost Too Much Weight Info Percent of long-stay residents who lose too much weight 0.7%
85% better than California average

California average: 4.2%

Depressive Symptoms Info Percent of long-stay residents who have depressive symptoms 19.9%
197% worse than California average

California average: 6.7%

Pneumococcal Vaccine Info Percent of long-stay residents assessed and appropriately given the pneumococcal vaccine 100.0%
In line with California average

California average: 98.5%

Influenza Vaccine Info Percent of long-stay residents assessed and appropriately given the seasonal influenza vaccine 95.8%
In line with California average

California average: 98.2%

Hospitalizations per 1,000 days Info Number of hospitalizations per 1,000 long-stay resident days. 3.36
49% worse than California average

California average: 2.25

ED visits per 1,000 days Info Number of outpatient emergency department visits per 1,000 long-stay resident days. 3.98
150% worse than California average

California average: 1.59

Short-stay resident measures
Significantly above average California avg: 3.5 Info CMS star rating based on short-stay quality measure performance. 5 stars = much above average, 1 star = much below average.
Pneumococcal Vaccine Info Percent of short-stay residents assessed and appropriately given the pneumococcal vaccine 97.7%
In line with California average

California average: 94.0%

Influenza Vaccine Info Percent of short-stay residents assessed and appropriately given the seasonal influenza vaccine 86.7%
7% worse than California average

California average: 93.2%

Re-hospitalized after SNF stay Info Percentage of short-stay residents who were re-hospitalized after their nursing home admission. 12.7%
45% better than California average

California average: 23.2%

Emergency department visits Info Percentage of short-stay residents who had an outpatient emergency department visit. 3.8%
66% better than California average

California average: 11.2%

Falls with major injury Info Percentage of SNF residents who experience falls with major injury during their stay. 0.0%
100% better than California average

California average: 0.8%

Ability to care for self at discharge Info Percentage of residents at or above expected ability to care for themselves at discharge. 64.7%
21% better than California average

California average: 53.7%

Penalties and fines

Federal penalties imposed by CMS for regulatory violations, including civil money penalties (fines) and denials of payment for new Medicare/Medicaid admissions.

Source: CMS Penalties Database (Data as of Jan 2026)

Total fines amount $34K Rank #1 / 129Federal fines — State benchmarkedThis home is ranked 1st out of 129 homes in California.Shows this facility's cumulative CMS federal fine dollars versus the California average among facilities with fines, and where it ranks among 129 skilled nursing facilities in the pool. Lower total dollars mean a better rank.Click the rank badge to see the full State ranking.Click here to see the full State ranking.
39% lower than California average

California average: $55K

Number of fines 1
58% fewer fines than California average

California average: 2.4

Payment Denials Info Serious action where Medicare and/or Medicaid temporarily stops payments for new residents until issues are fixed. 0
100% fewer payment denials than California average

California average: 0.5

Fines amount comparison
This facility $34K
California average $55K
Penalty History

Penalties are imposed by CMS for violations of federal nursing home regulations.

1 penalty in the past 3 years

Nov 28, 2023 · $34K

Civil Money Penalty Info Fines imposed for noncompliance, which can be assessed per day or per instance of violation. Nov 28, 2023
$34K

Last updated: Jan 2026

Compare Nursing Home around Riverside County

The information below is reported by the California Department of Social Services and Department of Public Health.

4 facilities compared · CMS & CA Dept. of Health data

Filter by care type
Valencia Gardens Health Care Center
NH

Nursing Home Licensed facility providing 24/7 skilled nursing care for residents with complex, ongoing medical needs. Staffed by RNs, LPNs, and CNAs. Inspected and star-rated annually by CMS. Accepts Medicare (short-term rehab) and Medicaid (long-term care).

Riverside (Magnolia Center)59 86.9% +3%3.60 -6%-15%$0263.7-54- 87 Franklin Hughes$14.5M$5.4M37.5%555331
Community Care On Palm
NH

Nursing Home Licensed facility providing 24/7 skilled nursing care for residents with complex, ongoing medical needs. Staffed by RNs, LPNs, and CNAs. Inspected and star-rated annually by CMS. Accepts Medicare (short-term rehab) and Medicaid (long-term care).

AL

Assisted Living A licensed, long-term care setting for seniors or individuals with disabilities who need help with daily activities — like bathing, dressing, and medication management — but not 24-hour skilled nursing. Offers housing, meals, and around-the-clock support while aiming to maximize resident independence.

MC

Memory Care Secured, specialized care for people living with Alzheimer's or dementia. Staff trained in cognitive impairment, with higher staff-to-resident ratios and an environment designed to reduce confusion and wandering risk.

RC

Respite Care Short-term temporary care — days to weeks — to give family caregivers a break. Full care provided during the stay. Often used after hospitalization or to trial a facility before a permanent placement decision.

Riverside (Wood Streets)51 97.1% +15%4.24 -52%+1%$33.5k523.7348- 55 Ezequiel Bercovich$7.4M$4.0M53.7%555711
Palm Terrace Care Center
NH

Nursing Home Licensed facility providing 24/7 skilled nursing care for residents with complex, ongoing medical needs. Staffed by RNs, LPNs, and CNAs. Inspected and star-rated annually by CMS. Accepts Medicare (short-term rehab) and Medicaid (long-term care).

MC

Memory Care Secured, specialized care for people living with Alzheimer's or dementia. Staff trained in cognitive impairment, with higher staff-to-resident ratios and an environment designed to reduce confusion and wandering risk.

RC

Respite Care Short-term temporary care — days to weeks — to give family caregivers a break. Full care provided during the stay. Often used after hospitalization or to trial a facility before a permanent placement decision.

Riverside (La Sierra Hills)75 88.1% +4%3.75 -44%-11%$0264.3-67A 18 -$13.4M$7.1M52.8%555365
Riverwalk Post Acute
NH

Nursing Home Licensed facility providing 24/7 skilled nursing care for residents with complex, ongoing medical needs. Staffed by RNs, LPNs, and CNAs. Inspected and star-rated annually by CMS. Accepts Medicare (short-term rehab) and Medicaid (long-term care).

Riverside (Arlington)146 94.2% +11%3.41 -49%-19%$0582.4-140A+ 70 Calvin Patel$32.6M$12.0M36.8%555017

Guides for Better Senior Living

Care Cost Calculator: See Prices in Your Area

Nursing Home Data Explorer

Don’t Wait Too Long: 7 Red Flag Signs Your Parent Needs Assisted Living Now

The True Cost of Assisted Living in 2025 – And How Families Are Paying For It

Understanding Senior Living Costs: Pricing Models, Discounts & Financial Assistance

Frequently Asked Questions about Community Care On Palm

What neighborhood is Community Care On Palm in?

Community Care On Palm is in the Wood Streets neighborhood.

Is Community Care On Palm in a walkable area?

Community Care On Palm has a walk score of 55. Moderately walkable. Some errands can be accomplished on foot, with a mix of nearby amenities.

What is the occupancy rate at Community Care On Palm?

Community Care On Palm's occupancy is 97.1%.

What is the address of Community Care On Palm?

Community Care On Palm is located at 4768 Palm Ave, Riverside, CA 92501, United States.

What is the phone number of Community Care On Palm?

(951) 686-9001 will put you in contact with the team at Community Care On Palm.

Is Community Care On Palm Medicare or Medicaid certified?

Yes — Community Care On Palm is a CMS-certified provider of Medicare and Medicaid.

Explore Open Rooms
1 Contact details
2 What type of senior care service are you looking for?
3 What budget do you have in mind for senior care?
4 How soon do you need to find care?
5 Additional details

Thank you for your interest!

Our team will be in touch shortly to help with next steps.