


Total health inspections
4
California average 12.5
Last Health inspection on Apr 2025
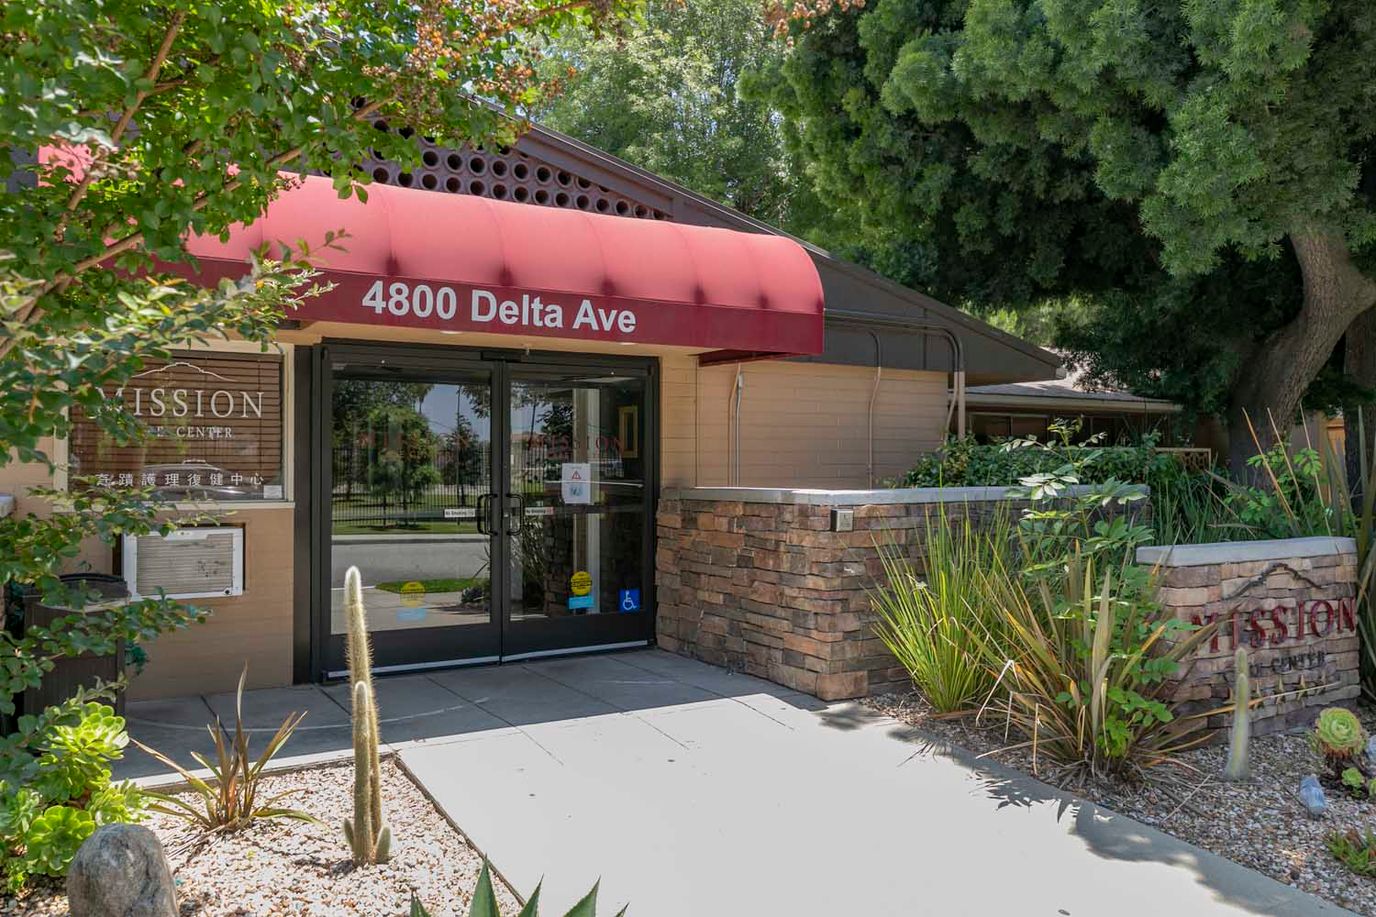
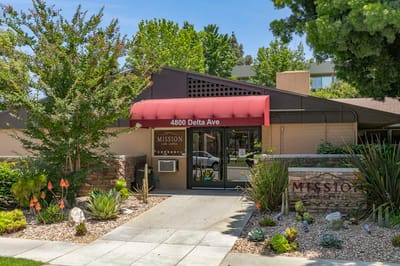
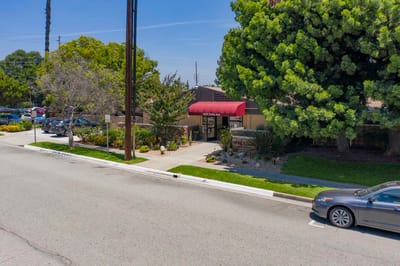
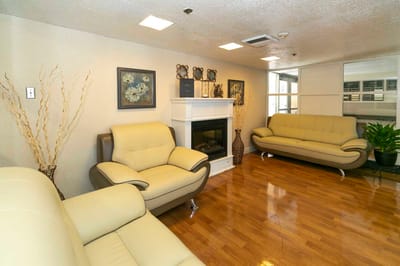
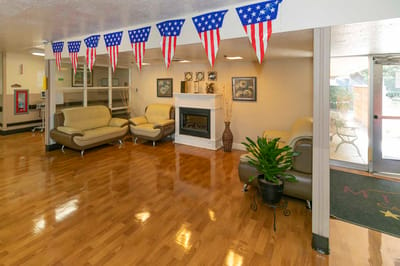
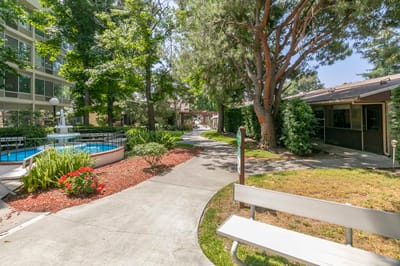
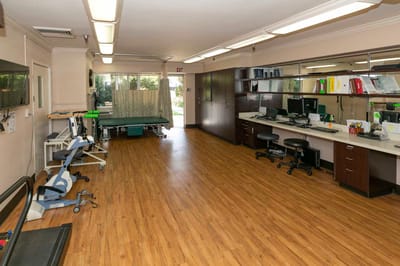
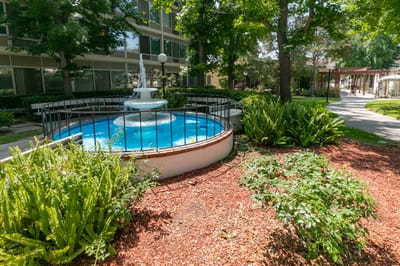
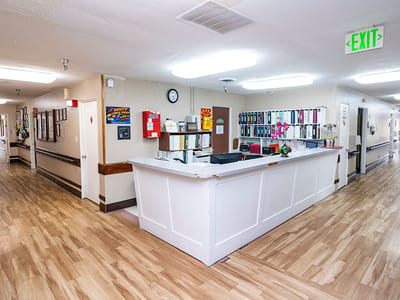
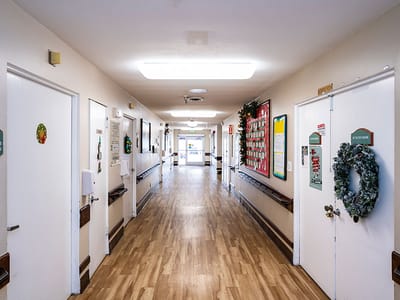
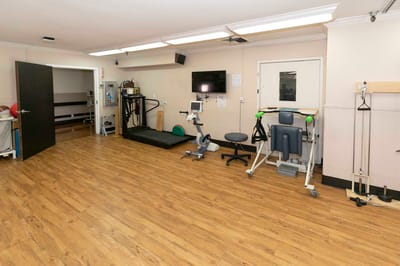
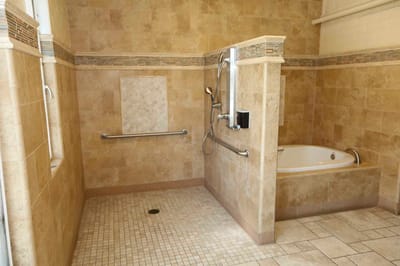
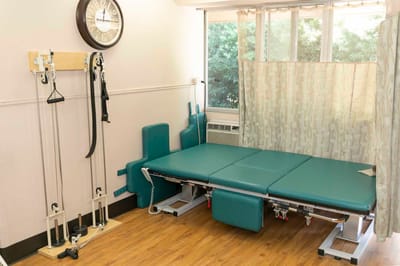
Mission Care Center is a compassionate community in Riverside, CA dedicated to supporting residents’ well-being through skilled nursing care and rehabilitation. They feature a highly skilled team of clinicians, therapists, and medical consultants to help residents in their recovery process or maintain their functionality. Residents here enjoy the comfort of their healing environment with easy access to care services like physical, occupational, and speech therapy.
Apart from comprehensive care services, the community assists residents and their families throughout their journey by offering compassionate social services. The community also organizes an array of fun and engaging activities to help residents stay stimulated and active. By meeting residents’ social and medical needs, Mission Care Center guarantees a smooth and comfortable healing journey.
| Staff type | Hours / Day / Resident | vs state avg |
|---|---|---|
|
Registered Nurse (RN)
| 1h 21m per day | ▲ 107% State avg: 39m per day · National avg: 41m per day |
|
LPN / LVN
| 2h 56m per day | ▲ 141% State avg: 1h 13m per day · National avg: 52m per day |
|
Nurse Aide
| 2h 8m per day | ▼ 20% State avg: 2h 39m per day · National avg: 2h 21m per day |
|
Weekend Total Nursing
| 5h 59m per day | ▲ 47% State avg: 4h 5m per day · National avg: 3h 26m per day |
|
Physical Therapist
| 4m per day | ▼ 26% State avg: 5m per day · National avg: 4m per day |
|
Weekend RN
| 1h 17m per day | ▲ 156% State avg: 30m per day · National avg: 29m per day |
In California, the Department of Social Services (for assisted living facilities) and the Department of Public Health (for nursing homes) conduct inspections to ensure resident safety and regulatory compliance.
California average 12.5
Last Health inspection on Apr 2025
California average 50.2
California average 4.65
Health citations are formal notices following inspections when they fail to comply with safety and care standards.
21 of 22 citations resulted from standard inspections; and 1 of 22 resulted from complaint investigations.
California average: 0.4
California average: 1
Reporting period: October 1 – December 31, 2025 (Q4 2025). Source: CMS Payroll-Based Journal report.
Manages medical care and health needs.
Assists with medical care and medications.
Helps with daily care and mobility.
Total hours from contractors
41 contractor hours this quarter
| Licensed Practical Nurse | 27 | 0 | 27 | 9,144 | 92 | 100% | 8.7 |
| Certified Nursing Assistant | 26 | 0 | 26 | 7,503 | 92 | 100% | 6.8 |
| Registered Nurse | 17 | 0 | 17 | 4,401 | 92 | 100% | 9.1 |
| Qualified Activities Professional | 12 | 0 | 12 | 3,968 | 92 | 100% | 8.2 |
| RN Director of Nursing | 3 | 0 | 3 | 1,185 | 67 | 73% | 6.5 |
| Dental Services Staff | 1 | 0 | 1 | 504 | 63 | 68% | 8 |
| Other Dietary Services Staff | 1 | 0 | 1 | 453 | 59 | 64% | 7.7 |
| Nurse Practitioner | 1 | 0 | 1 | 336 | 42 | 46% | 8 |
| Administrator | 1 | 0 | 1 | 256 | 64 | 70% | 4 |
| Respiratory Therapy Technician | 2 | 0 | 2 | 216 | 53 | 58% | 4.1 |
| Physical Therapy Assistant | 1 | 0 | 1 | 122 | 34 | 37% | 3.6 |
| Qualified Social Worker | 3 | 0 | 3 | 110 | 39 | 42% | 2.8 |
| Medical Director | 0 | 1 | 1 | 30 | 3 | 3% | 10 |
| Speech Language Pathologist | 1 | 0 | 1 | 12 | 4 | 4% | 3.1 |
| Other Physician | 0 | 1 | 1 | 11 | 3 | 3% | 3.8 |
Federal penalties imposed by CMS for regulatory violations, including civil money penalties (fines) and denials of payment for new Medicare/Medicaid admissions.
Source: CMS Penalties Database
No penalties in the past 3 years
No civil money penalties or payment denials were reported in the last 3 years.
These measures show how residents usually do over time at this home, based on health outcomes and preventive care.
California average: 6.6
California average: 11.3
California average: 11.3%
California average: 1.7%
California average: 5.0%
California average: 1.2%
California average: 4.2%
California average: 6.7%
California average: 10.1%
California average: 98.5%
California average: 98.2%
California average: 94.0%
California average: 1.5%
California average: 93.2%
California average: 0.8%
Quality measures are calculated from Minimum Data Set (MDS) assessments. For most measures, lower percentages indicate better care quality.
18% of new residents, usually for short-term rehab.
28% of new residents, often for short stays.
53% of new residents, often for long-term daily care.
Source: CMS Long-Term Care Facility Characteristics (Data as of Jan 2026)
Residents meet regularly to discuss policies, care quality, and activities
State-approved Nurse Aide Training and Competency Evaluation Program on-site
Organized group of residents that meets regularly to discuss facility policies, quality of life, and activities.
Data sourced from CMS Long-Term Care Facility Characteristics quarterly report. Payer mix reflects the current resident census by primary payment source.
Historical financial and operational data for Mission Care Center from 2011–2023, based on CMS SNF Cost Reports.
Key figures below are for fiscal year ending in 12/2023.
Based on CMS SNF Cost Report for fiscal year ending in 12/2023.
Pets Allowed
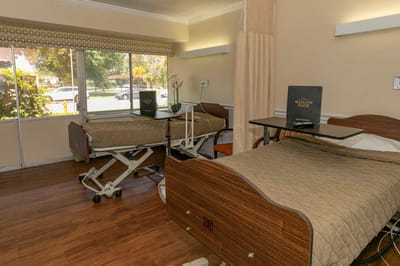
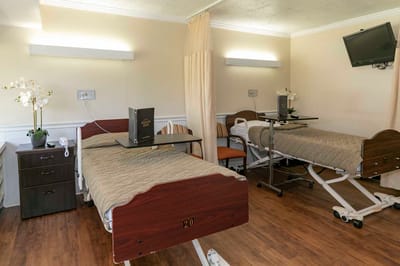
Housing Options: Private / Semi-Private Rooms
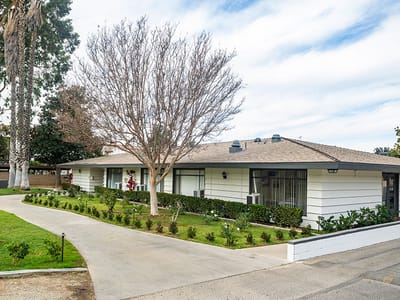
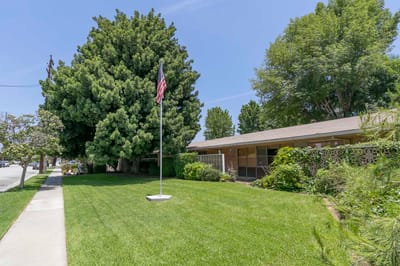
Building Type: Single-story
Beauty Services

Parking Available
Recreational Activities
Exercise Programs
Most residents stay for extended periods and receive ongoing daily care.
Most new residents arrive under Medicaid (53% of admissions), and a typical Medicaid stay runs around 8 - 9 months.
Coverage residents most often arrive under.
Coverage residents most often leave under.
![]() 4.8 miles from city center
4.8 miles from city center
![]() Estimated distance in miles from Riverside's city center to Mission Care Center's address, calculated via Google Maps.
Estimated distance in miles from Riverside's city center to Mission Care Center's address, calculated via Google Maps.
Add your location
The information below is reported by the California Department of Social Services and Department of Public Health.
| Valencia Gardens Health Care Center | NH | Riverside (Magnolia Center) | 50
Facility
50
CA AVG
104
Rank
#1126 / 1648 | - | - | 3.60
Facility
3.60
CA AVG
4.22
Rank
#253 / 327 | -29% | -15% | $0
Facility
$0
CA AVG
$56.5k
Rank
#1 / 334 | - | 26
Facility
26
CA AVG
50.2
Rank
#79 / 327 | 3.7
Facility
3.7
CA AVG
4.6
Rank
#122 / 327 | - | 53 | - |
87
Facility
87
CA AVG
57
Rank
#249 / 2087 | Franklin Hughes | $10.0MFiscal year ending 12/2023
Facility
$10.0MFiscal year ending 12/2023
CA AVG
$17.0M
Rank
#203 / 327 | $5.4MFiscal year ending 12/2023
Facility
$5.4MFiscal year ending 12/2023
CA AVG
$7.0M
Rank
#269 / 327 | 54.1%Fiscal year ending 12/2023
Facility
54.1%Fiscal year ending 12/2023
CA AVG
45.2%
Rank
#280 / 327 | 555331 | ||||
| Mission Care Center | NH MC SNF | Riverside (Ramona) | 40
Facility
40
CA AVG
104
Rank
#1201 / 1648 |
95.0%
Facility
95.0%
CA AVG
73.8
Rank
#209 / 1496 | +29% | 2.55
Facility
2.55
CA AVG
4.22
Rank
#326 / 327 | +94% | -40% | $0
Facility
$0
CA AVG
$56.5k
Rank
#1 / 334 | - | 22
Facility
22
CA AVG
50.2
Rank
#51 / 327 | 5.5
Facility
5.5
CA AVG
4.6
Rank
#253 / 327 | 1 | 38 | - |
44
Facility
44
CA AVG
57
Rank
#1484 / 2087 | Riverside Equities LLC | $9.8MFiscal year ending 12/2023
Facility
$9.8MFiscal year ending 12/2023
CA AVG
$17.0M
Rank
#255 / 327 | $5.9MFiscal year ending 12/2023
Facility
$5.9MFiscal year ending 12/2023
CA AVG
$7.0M
Rank
#252 / 327 | 60.4%Fiscal year ending 12/2023
Facility
60.4%Fiscal year ending 12/2023
CA AVG
45.2%
Rank
#121 / 327 | 55542 | ||||
| Palm Terrace Care Center | NH SNF | Riverside (La Sierra Hills) | 71
Facility
71
CA AVG
104
Rank
#994 / 1648 |
93.5%
Facility
93.5%
CA AVG
73.8
Rank
#247 / 1496 | +27% | 3.75
Facility
3.75
CA AVG
4.22
Rank
#230 / 327 | -9% | -11% | $0
Facility
$0
CA AVG
$56.5k
Rank
#1 / 334 | - | 26
Facility
26
CA AVG
50.2
Rank
#79 / 327 | 4.3
Facility
4.3
CA AVG
4.6
Rank
#178 / 327 | - | 66 | A |
18
Facility
18
CA AVG
57
Rank
#1869 / 2087 | - | $14.2MFiscal year ending 12/2023
Facility
$14.2MFiscal year ending 12/2023
CA AVG
$17.0M
Rank
#224 / 327 | $7.0MFiscal year ending 12/2023
Facility
$7.0MFiscal year ending 12/2023
CA AVG
$7.0M
Rank
#212 / 327 | 49.6%Fiscal year ending 12/2023
Facility
49.6%Fiscal year ending 12/2023
CA AVG
45.2%
Rank
#146 / 327 | 555365 | ||||
| Extended Care Hospital of Riverside | NH SNF | Riverside (Ramona) | 99
Facility
99
CA AVG
104
Rank
#726 / 1648 |
93.4%
Facility
93.4%
CA AVG
73.8
Rank
#252 / 1496 | +26% | 3.82
Facility
3.82
CA AVG
4.22
Rank
#215 / 327 | -39% | -10% | $0
Facility
$0
CA AVG
$56.5k
Rank
#1 / 334 | - | 48
Facility
48
CA AVG
50.2
Rank
#199 / 327 | 3.0
Facility
3.0
CA AVG
4.6
Rank
#58 / 327 | - | 93 | - |
44
Facility
44
CA AVG
57
Rank
#1484 / 2087 | F & B Health Care | $16.6MFiscal year ending 12/2023
Facility
$16.6MFiscal year ending 12/2023
CA AVG
$17.0M
Rank
#62 / 327 | $8.9MFiscal year ending 12/2023
Facility
$8.9MFiscal year ending 12/2023
CA AVG
$7.0M
Rank
#144 / 327 | 53.6%Fiscal year ending 12/2023
Facility
53.6%Fiscal year ending 12/2023
CA AVG
45.2%
Rank
#312 / 327 | 56162 | ||||
| Community Care On Palm | NH ADC AL RC SNF | Riverside (Wood Streets) | 51
Facility
51
CA AVG
104
Rank
#1124 / 1648 |
95.1%
Facility
95.1%
CA AVG
73.8
Rank
#206 / 1496 | +29% | 4.24
Facility
4.24
CA AVG
4.22
Rank
#131 / 327 | -62% | +1% | $33.5k
Facility
$33.5k
CA AVG
$56.5k
Rank
#263 / 334 | - | 52
Facility
52
CA AVG
50.2
Rank
#215 / 327 | 3.7
Facility
3.7
CA AVG
4.6
Rank
#122 / 327 | 3 | 49 | - |
55
Facility
55
CA AVG
57
Rank
#1213 / 2087 | Ezequiel Bercovich | $8.9MFiscal year ending 12/2023
Facility
$8.9MFiscal year ending 12/2023
CA AVG
$17.0M
Rank
#302 / 327 | $3.9MFiscal year ending 12/2023
Facility
$3.9MFiscal year ending 12/2023
CA AVG
$7.0M
Rank
#308 / 327 | 44.3%Fiscal year ending 12/2023
Facility
44.3%Fiscal year ending 12/2023
CA AVG
45.2%
Rank
#134 / 327 | 555711 |
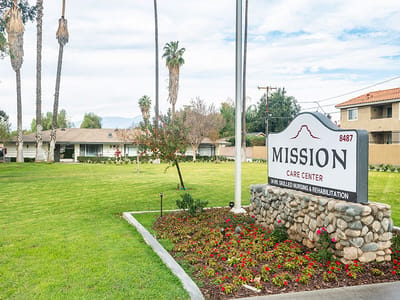
Mission Care Center is located in Riverside, California.
Here are the financial assistance programs available to residents in California.
Mission Care Center is in the Ramona neighborhood of Riverside.
Mission Care Center has a walk score of 44. Somewhat walkable. A few nearby services may be reachable on foot, but most trips require transportation.
Mission Care Center's occupancy is 96.8%.
Yes, Mission Care Center allows residents to bring their pets.
Mission Care Center is registered as a for-profit in CA.
Yes — there are 23 photos of Mission Care Center in the photo gallery on this page.
Mission Care Center is located at 8487 Magnolia Ave, Riverside, CA 92504.
Care Cost Calculator: See Prices in Your Area
Nursing Home Data Explorer
Don’t Wait Too Long: 7 Red Flag Signs Your Parent Needs Assisted Living Now
The True Cost of Assisted Living in 2025 – And How Families Are Paying For It
Understanding Senior Living Costs: Pricing Models, Discounts & Financial Assistance


