Palm Terrace Care Center
Nursing Home & Nursing Care · Riverside County, CA
CMS overall rating Info CMS (the Centers for Medicare & Medicaid Services) is the federal agency that rates nursing home quality. Its Overall Rating runs from 1 to 5 stars, combining health inspections, staffing, and quality measures, with inspections weighted most heavily.

Palm Terrace Care Center

Nursing Home & Nursing Care · Riverside County, CA
CMS overall rating Info CMS (the Centers for Medicare & Medicaid Services) is the federal agency that rates nursing home quality. Its Overall Rating runs from 1 to 5 stars, combining health inspections, staffing, and quality measures, with inspections weighted most heavily.
Calculator: See prices in your area
Palm Terrace Care Center accepts Medicare, Medicaid, and private pay.

Overview of Palm Terrace Care Center

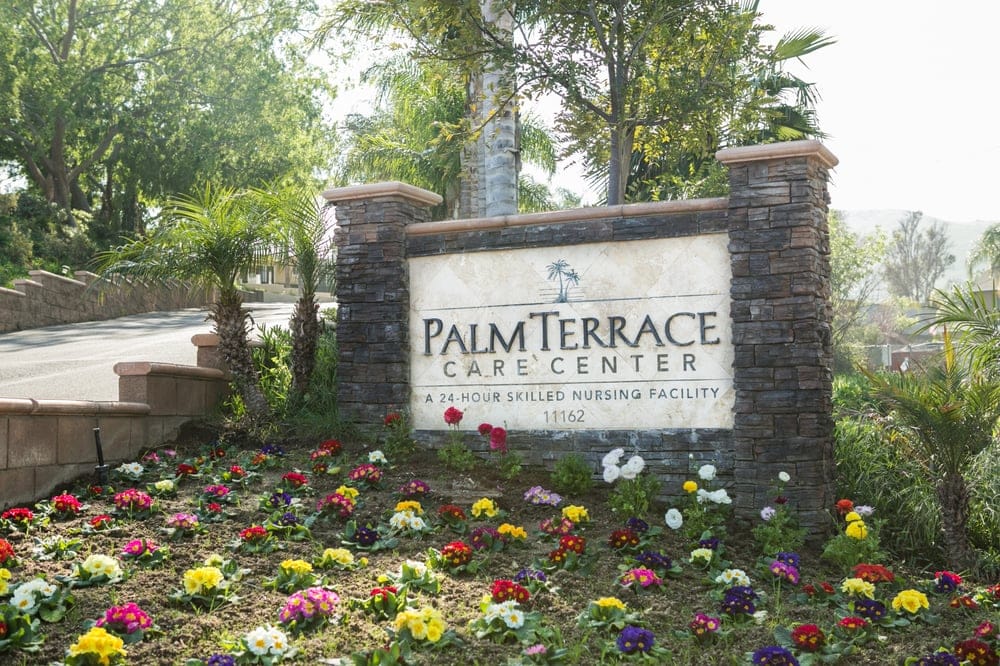
Maintain your highest functionality in a caring environment with Palm Terrace Care Center, a community in Riverside, CA built to offer skilled nursing, short-term rehabilitation, and long-term care. They provide residents with a personalized therapy program that aligns with their needs and the finest therapists and equipment to help them retain or improve their functionality. Residents with Alzheimer’s thrive with their memory care program that follows their “life footprint” to help caregivers fully understand them and incorporate details of their daily lives in their care plans.

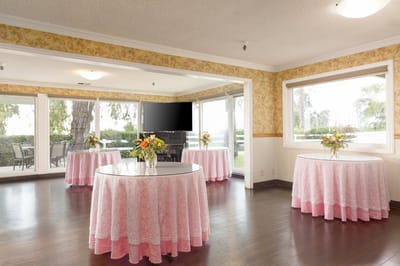
The community works side-by-side with residents to foster participation and transparency in care delivery. There are no boring days with a wide array of activities like arts and crafts classes and movie nights held regularly. Here, residents find a supportive environment that respects their wishes and preserves the lifestyle they want as much as possible.

(951) 687-7330

Quality ratings

Measured by Centers for Medicare & Medicaid Services (CMS)

Overall rating Info The Overall CMS Rating combines results from health inspections, staffing levels and quality measures. Health inspections carry the most weight. Staffing and quality scores can increase or decrease the final rating based on performance compared to state and national standards.
▲ 27.0% Above CA avg. ▲ 27.0% Above CA avg.CA average: 3.1Click the badge to see the full State ranking.Click here to see the full State ranking.
Health Inspection Info Based on the results of the facility's three most recent standard inspections and any complaint investigations. CMS reviews the number, scope, and severity of deficiencies, with more recent findings weighted more heavily.
▲ 7.3% Above CA avg. ▲ 7.3% Above CA avg.CA average: 2.8Click the badge to see the full State ranking.Click here to see the full State ranking.
Staffing Info Measures average nursing staff hours per resident per day, including Registered Nurses (RNs) and total nursing staff. Ratings are adjusted based on the level of care residents require and are compared to state and national benchmarks.
▼ 4.4% Below CA avg. ▼ 4.4% Below CA avg.CA average: 3.1Click the badge to see the full State ranking.Click here to see the full State ranking.
Quality Measures Info Based on clinical and physical health indicators reported to CMS, such as hospital readmissions, falls, pressure ulcers, and improvements in mobility. These measures reflect how well residents' health needs are being managed.
▲ 22.4% Above CA avg. ▲ 22.4% Above CA avg.CA average: 4.1Click the badge to see the full State ranking.Click here to see the full State ranking.

Staffing hours breakdown

Info Daily nursing hours per resident by staff type, reported to CMS. Higher is generally better — compare this facility to state and national averages to see where staffing stands.

Hours per resident per day — compared to California state averages

Total nursing care / resident Info This home is ranked 245th out of 354 homes in California for nurse hours. Total adjusted nursing hours per resident per day, combining RN, LPN, and aide time. CMS adjusts this for case-mix so facilities can be fairly compared.
3h 45m per day
Rank #245 / 354Nurse hours — State benchmarkedThis home is ranked 245th out of 354 homes in California. Shows adjusted nurse hours per resident per day benchmarked to the California average, with a ranking across 354 California facilities. More hours mean more direct care. The national average is about 3.5 hrs; below 3.0 is a red flag.Rankings are based only on facilities in California that report data for that category. Facilities without available data are excluded from the ranking.Click the rank badge to see the full State ranking.Click here to see the full State ranking.
This facility California avg (4h 13m per day)
vs California avg
-11%

3 of 6 metrics below state avg

Standout metric Physical Therapist is +101% above state avg
Staff typeHours / Day / Residentvs state avg
Registered Nurse (RN) Info RNs hold the highest nursing license and can assess residents, interpret test results, and direct care plans. More RN hours per day often signals stronger clinical oversight and faster response to health changes. 27m per day ▼ 31% State avg: 39m per day · National avg: 41m per day
LPN / LVN Info Licensed Practical Nurses (LPNs) or Licensed Vocational Nurses (LVNs) deliver routine hands-on care — medication administration, wound dressing, and monitoring vital signs. They work under RN supervision and make up a large share of daily bedside care. 1h 18m per day ▲ 6% State avg: 1h 13m per day · National avg: 52m per day
Nurse Aide Info Certified Nurse Aides (CNAs) provide the most direct day-to-day assistance: bathing, dressing, feeding, and mobility. Nurse aide hours are typically the largest staffing category and directly affect residents' quality of life. 2h 43m per day ■ Avg State avg: 2h 39m per day · National avg: 2h 21m per day
Weekend Total Nursing Info Combined nursing hours (RN + LPN + Nurse Aide) per resident per day on weekends. Staffing often drops on weekends — this figure reveals whether the facility maintains adequate coverage outside of weekday hours. 3h 50m per day ▼ 6% State avg: 4h 5m per day · National avg: 3h 26m per day
Physical Therapist Info Hours per resident per day provided by licensed Physical Therapists (PTs) or PT Assistants. PT services help residents recover mobility after injury or illness and are especially important for post-acute (short-stay) rehabilitation. 10m per day ▲ 101% State avg: 5m per day · National avg: 4m per day
Weekend RN Info Registered nurse hours specifically on weekends. Facilities sometimes reduce RN presence on Saturdays and Sundays — a low weekend RN figure compared to weekday hours can indicate reduced clinical oversight when most administrative staff are absent. 15m per day ▼ 50% State avg: 30m per day · National avg: 29m per day

Capacity and availability

This home usually has limited availability

Higher occupancy than the California average: 84.7%
Occupancy rate
88.1% Rank #374 / 1537Occupancy rate — State benchmarkedThis home is ranked 374th out of 1537 homes in California. Shows this facility's occupancy rate versus the California average, with its Statewide rank out of 1537. Higher occupancy signals strong local demand and financial stability.Rankings are based only on facilities in California that report data for that category. Facilities without available data are excluded from the ranking.Click the rank badge to see the full State ranking.Click here to see the full State ranking.
Avg. Length of Stay
42 days
Bed community size
71-bed community Rank #998 / 1657Bed count — State benchmarkedThis home is ranked 998th out of 1657 homes in California. Shows this facility's certified or reported bed count compared to other California facilities. Larger communities may offer more amenities, programs, and on-site services for residents and families.Rankings are based only on facilities in California that report data for that category. Facilities without available data are excluded from the ranking.Click the rank badge to see the full State ranking.Click here to see the full State ranking.
A moderately sized community that may balance personal attention with shared amenities and social activities.
Years in operation
3 years in operation Rank #1210 / 1487Years in operation — State benchmarkedThis home is ranked 1210th out of 1487 homes in California. Shows how long this facility has been in operation compared to other California facilities. Longer operating histories may benefit residents, families, and staff.Rankings are based only on facilities in California that report data for that category. Facilities without available data are excluded from the ranking.Click the rank badge to see the full State ranking.Click here to see the full State ranking.
An established community with some operational experience and growing routines.
Walk Score
Walk Score: 18 / 100 Rank #1874 / 2092Walk Score — State benchmarkedThis home is ranked 1874th out of 2092 homes in California. Shows how walkable this facility's neighborhood is compared to the average Walk Score across California facilities. Higher scores benefit residents, families, and staff.Rankings are based only on facilities in California that report data for that category. Facilities without available data are excluded from the ranking.Click the rank badge to see the full State ranking.Click here to see the full State ranking.
Car-dependent. Most errands require a car, with limited nearby walkable options.
BBB Rating
BBB Rating: A (Not Accredited)
An independent rating from the Better Business Bureau based on factors such as complaint history, transparency, and business practices.
How BBB ratings work

About this community

License Details

CMS Certification Number555365

Contact Palm Terrace Care Center

Inspection History

In California, the Department of Social Services (for assisted living facilities) and the Department of Public Health (for nursing homes) conduct inspections to ensure resident safety and regulatory compliance.

Health Inspection History

Inspections since 2023
Total health inspections 6

California average 12.5


Last Health inspection on May 2025

Total health citations
26 Rank #86 / 361Health citations — State benchmarkedThis home is ranked 86th out of 361 homes in California. Shows this facility's total health deficiency citations benchmarked to the California State average, with a ranking across all 361 CA facilities. Lower citation counts earn a better rank.Rankings are based only on facilities in California that report data for that category. Facilities without available data are excluded from the ranking.Click the rank badge to see the full State ranking.Click here to see the full State ranking.

California average 50.2

Citations per inspection
4.33 Rank #196 / 361Citations per inspection — State benchmarkedThis home is ranked 196th out of 361 homes in California. Shows average deficiency citations per CMS inspection for this facility versus the California mean across 361 facilities with citation data. Lower is better.Rankings are based only on facilities in California that report data for that category. Facilities without available data are excluded from the ranking.Click the rank badge to see the full State ranking.Click here to see the full State ranking.

California average 4.65


Health citations are formal notices following inspections when they fail to comply with safety and care standards.

23 of 26 citations resulted from standard inspections; and 3 of 26 resulted from complaint investigations.

Breakdown of citation severity (last 3 years)
Critical health citations
0
100% better than California average

California average: 0.4


Serious health citations
0
100% better than California average

California average: 1

0 critical citations California average: 0.4

0 serious citations California average: 1

26 moderate citations California average: 47.2

0 minor citations California average: 1.5
Citations history (last 3 years)
Environmental moderate citation May 16, 2025
Corrected

Infection Control moderate citation May 16, 2025
Corrected

Nursing Services moderate citation May 16, 2025
Corrected

Nutrition moderate citation May 16, 2025
Corrected

Staffing Data

Reporting period: October 1 – December 31, 2025 (Q4 2025). Source: CMS Payroll-Based Journal report.

Total staff 123
Employees 123
Contractors 0
Staff to resident ratio 1.92 : 1
6% more staff per resident than California average
California average ratio: 1.81 : 1 California average ratio: 1.81 : 1See full California ranking
Avg staff/day 54
Average shift 7.6 hours
0% compared with California average
California average: 7.7 hours California average shift: 7.7 hoursSee full California ranking
Total staff hours (quarter) 37,794

Nursing staff breakdown

Q4 2025 · Oct 1 – Dec 31 More info This data comes from the CMS Payroll-Based Journal report covering October 1 – December 31, 2025.
Registered Nurse

Manages medical care and health needs.

RN Staff Info All 10 RN Staff are full-time employees. No contractors work on this role. 10
Average shift length Info Average shift length. Calculated as total hours divided by days worked and average staff per day. 9.8 hours
Licensed Practical Nurse

Assists with medical care and medications.

LPN Staff Info All 19 LPN Staff are full-time employees. No contractors work on this role. 19
Average shift length Info Average shift length. Calculated as total hours divided by days worked and average staff per day. 7.7 hours
Certified Nursing Assistant

Helps with daily care and mobility.

CNA Staff Info All 54 CNA Staff are full-time employees. No contractors work on this role. 54
Average shift length Info Average shift length. Calculated as total hours divided by days worked and average staff per day. 7.4 hours

Contractor staffing

Q4 2025 · Oct 1 – Dec 31 More info This data comes from the CMS Payroll-Based Journal report covering October 1 – December 31, 2025.
Total hours from contractors 0% — all staff are direct employees this quarter

Staff by category

Q4 2025 · Oct 1 – Dec 31 More info This data comes from the CMS Payroll-Based Journal report covering October 1 – December 31, 2025.
Certified Nursing Assistant5405416,58992100%7.4
Licensed Practical Nurse190197,30192100%7.7
Physical Therapy Aide110112,0278693%7.5
Speech Language Pathologist6061,9817582%7.4
Dental Services Staff4041,9606672%7.8
Registered Nurse100101,56492100%9.8
Physical Therapy Assistant5051,1198289%7.7
Respiratory Therapy Technician4041,0218087%7.5
Other Dietary Services Staff2029019098%7.5
Nurse Practitioner1015946672%9
Clinical Nurse Specialist1015946672%9
RN Director of Nursing1015946672%9
Qualified Social Worker3035345661%6.9
Administrator1015156672%7.8
Dietitian1015006470%7.8
54 Certified Nursing Assistant
% of Days 100%
19 Licensed Practical Nurse
% of Days 100%
11 Physical Therapy Aide
% of Days 93%
6 Speech Language Pathologist
% of Days 82%
4 Dental Services Staff
% of Days 72%
10 Registered Nurse
% of Days 100%
5 Physical Therapy Assistant
% of Days 89%
4 Respiratory Therapy Technician
% of Days 87%
2 Other Dietary Services Staff
% of Days 98%
1 Nurse Practitioner
% of Days 72%
1 Clinical Nurse Specialist
% of Days 72%
1 RN Director of Nursing
% of Days 72%
3 Qualified Social Worker
% of Days 61%
1 Administrator
% of Days 72%
1 Dietitian
% of Days 70%

Penalties and fines

Federal penalties imposed by CMS for regulatory violations, including civil money penalties (fines) and denials of payment for new Medicare/Medicaid admissions.

Source: CMS Penalties Database

No penalties in the past 3 years

No civil money penalties or payment denials were reported in the last 3 years.

Quality of care over time

These measures show how residents usually do over time at this home, based on health outcomes and preventive care.

High-risk clinical events score Info A composite score based on pressure ulcers, falls with injury, weight loss, walking ability decline, and activities of daily living decline. 4.3
36% better than California average

California average: 6.6

Functional decline score Info A composite score based on activities of daily living decline, walking ability decline, and incontinence. 6.4
44% better than California average

California average: 11.3

Long-stay resident measures
Significantly above average California avg: 4.2 Info CMS star rating based on long-stay quality measure performance. 5 stars = significantly above average, 1 star = significantly below average.
Need for Help with Daily Activities Increased Info Percent of long-stay residents whose need for help with daily activities has increased 8.4%
24% better than California average

California average: 11.1%

Walking Ability Worsened Info Percent of long-stay residents whose ability to move independently worsened 6.5%
46% better than California average

California average: 12.0%

Low Risk Residents with Bowel/Bladder Incontinence Info Percent of low risk long-stay residents who lose control of their bowels or bladder 4.2%
62% better than California average

California average: 11.3%

Falls with Major Injury Info Percent of long-stay residents experiencing one or more falls with major injury 0.0%
100% better than California average

California average: 1.7%

High Risk Residents with Pressure Ulcers Info Percent of long-stay high risk residents with pressure ulcers 6.4%
30% worse than California average

California average: 5.0%

Urinary Tract Infection Info Percent of long-stay residents with a urinary tract infection 0.0%
100% better than California average

California average: 1.2%

Lost Too Much Weight Info Percent of long-stay residents who lose too much weight 0.0%
100% better than California average

California average: 4.2%

Depressive Symptoms Info Percent of long-stay residents who have depressive symptoms 3.4%
49% better than California average

California average: 6.7%

Antipsychotic Use Info Percent of long-stay residents who received an antipsychotic medication 4.3%
58% better than California average

California average: 10.1%

Pneumococcal Vaccine Info Percent of long-stay residents assessed and appropriately given the pneumococcal vaccine 100.0%
In line with California average

California average: 98.5%

Influenza Vaccine Info Percent of long-stay residents assessed and appropriately given the seasonal influenza vaccine 96.4%
In line with California average

California average: 98.2%

Hospitalizations per 1,000 days Info Number of hospitalizations per 1,000 long-stay resident days. 1.82
19% better than California average

California average: 2.25

ED visits per 1,000 days Info Number of outpatient emergency department visits per 1,000 long-stay resident days. 0.81
49% better than California average

California average: 1.59

Short-stay resident measures
Significantly above average California avg: 3.5 Info CMS star rating based on short-stay quality measure performance. 5 stars = much above average, 1 star = much below average.
Pneumococcal Vaccine Info Percent of short-stay residents assessed and appropriately given the pneumococcal vaccine 99.6%
6% better than California average

California average: 94.0%

Antipsychotic medication increase Info Percent of short-stay residents who newly received an antipsychotic medication 0.4%
71% better than California average

California average: 1.5%

Influenza Vaccine Info Percent of short-stay residents assessed and appropriately given the seasonal influenza vaccine 96.5%
In line with California average

California average: 93.2%

Re-hospitalized after SNF stay Info Percentage of short-stay residents who were re-hospitalized after their nursing home admission. 20.2%
13% better than California average

California average: 23.2%

Emergency department visits Info Percentage of short-stay residents who had an outpatient emergency department visit. 8.8%
21% better than California average

California average: 11.2%

Falls with major injury Info Percentage of SNF residents who experience falls with major injury during their stay. 0.0%
100% better than California average

California average: 0.8%

Ability to care for self at discharge Info Percentage of residents at or above expected ability to care for themselves at discharge. 71.3%
33% better than California average

California average: 53.7%

Successful return to home or community Info Rate of successful return to home or community from a skilled nursing facility. 65.3%
29% better than California average

California average: 50.6%

Breakdown by payment type

Medicare

50% of new residents, usually for short-term rehab.

Typical stay 1 months

Private pay

37% of new residents, often for short stays.

Typical stay 1 months

Medicaid

13% of new residents, often for long-term daily care.

Typical stay 3 - 4 months

Facility Characteristics

Source: CMS Long-Term Care Facility Characteristics (Data as of Jan 2026)

Total residents 64
Medicare
28
43.8% of residents
Medicaid
21
32.8% of residents
Private pay or other
15
23.4% of residents

Finances and operations

Based on CMS SNF Cost Report for fiscal year ending in 12/2023.

Voluntary non-profit community
Operated by a church.
Net patient revenue Info Net patient revenue — what the home actually collects for resident care, after contractual allowances, bad debt and discounts are subtracted from its gross charges (CMS cost report, Worksheet G-3). It covers resident care only; money the home earns from other sources is shown separately as "Other income."
$14.2M
Net patient income Info Net patient income: net patient revenue minus the home's total operating expenses. A positive figure means it earns more from resident care than it spends to deliver it; a negative figure means the opposite. It excludes non-operating "other income."
$1.7M
Voluntary non-profit community Operated by a church.
Net patient revenue Info Net patient revenue — what the home actually collects for resident care, after contractual allowances, bad debt and discounts are subtracted from its gross charges (CMS cost report, Worksheet G-3). It covers resident care only; money the home earns from other sources is shown separately as "Other income."
$14.2M Rank #237 / 355Revenue — State benchmarkedThis home is ranked 237th out of 355 homes in California. Shows this facility's annual revenue compared to the California average. Higher revenue generally means more resources for staffing and capital — read alongside Payroll %.Rankings are based only on facilities in California that report data for that category. Facilities without available data are excluded from the ranking.Click the rank badge to see the full State ranking.Click here to see the full State ranking.
Net patient income Info Net patient income: net patient revenue minus the home's total operating expenses. A positive figure means it earns more from resident care than it spends to deliver it; a negative figure means the opposite. It excludes non-operating "other income."
$1.7M
Other income Info Money the home earns outside of resident care — such as investments, grants, rentals and other non-operating sources (CMS cost report, Worksheet G-3). It is tracked separately from net patient revenue: it is not part of that figure, and it is not included in net patient income.
$2.4K
Payroll costs Info Staff salaries plus wage-related costs — benefits such as payroll taxes, health insurance and retirement — from the home's own accounting records (CMS cost report, Worksheet A). Contract or agency labor is counted separately, under other operating costs. Rank #223 / 355Payroll — State benchmarkedThis home is ranked 223rd out of 355 homes in California. Shows total annual staff payroll benchmarked to the California average. Higher payroll investment relative to peers often signals better staffing and less reliance on cheaper contract labor.Rankings are based only on facilities in California that report data for that category. Facilities without available data are excluded from the ranking.Click the rank badge to see the full State ranking.Click here to see the full State ranking.
$7.0M 49.6% of net patient revenue Info Payroll as a share of revenue: staff salaries and wage-related benefits divided by net patient revenue. A higher figure means more of each revenue dollar goes to staff pay. Rank #141 / 355Payroll % — State benchmarkedThis home is ranked 141st out of 355 homes in California. Shows payroll as a percentage of revenue versus the California average. Well-run California facilities typically land around 56–67% — the top third Statewide. Below 25% may signal understaffing or heavy agency use — read with Staffing ratings.Rankings are based only on facilities in California that report data for that category. Facilities without available data are excluded from the ranking.Click the rank badge to see the full State ranking.Click here to see the full State ranking.
Other operating costs Info Everything it costs to run the home apart from payroll — food, utilities, supplies, maintenance, contract labor and administration. Calculated as total operating expense minus payroll (staff salaries and wage-related benefits).
$5.4M
Total costs Info The home's total operating expense for the year — all the costs of running it, salaries included (CMS cost report, Worksheet G-3).
$12.4M

What does this home offer?

Housing options icon

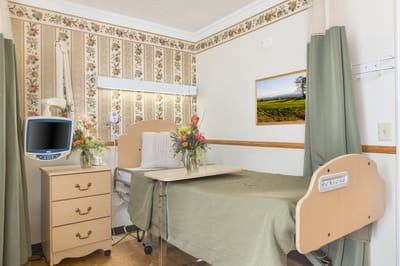
Housing Options: Private / Semi-Private Rooms

Building type icon
Building type icon

Building Type: Single-story

Housekeeping icon
Housekeeping icon

Housekeeping Services

Transportation services icon

Transportation Services

Recreational activities icon

Recreational Activities

Exercise program icon

Exercise Programs

Who this home usually serves

TYPE OF STAY

Mostly short-term rehab stays

Most residents typically stay for a few weeks or months before returning home or moving on.

Most new residents arrive under Medicare (50% of admissions), and a typical Medicare stay runs around 1 months.

Admissions
582 total

Coverage residents most often arrive under.

Medicare 50%
Private pay 37%
Medicaid 13%
Discharges
574 total

Coverage residents most often leave under.

Medicare 45%
Private pay 43%
Medicaid 13%

Places of interest near Palm Terrace Care Center

Address 9.9 miles from city center Info Estimated distance in miles from Riverside's city center to Palm Terrace Care Center's address, calculated via Google Maps.

Calculate Travel Distance to Palm Terrace Care Center

Add your location

Address

Compare Nursing Homes around Riverside County

The information below is reported by the California Department of Social Services and Department of Public Health.

5 facilities compared · CMS & CA Dept. of Health data

Valencia Gardens Health Care Center
NH
Riverside (Magnolia Center)
50
Facility 50
CA AVG 103
Rank #1133 / 1657
86.9%
Facility 86.9%
CA AVG 84.7%
Rank #409 / 1537
+3%
3.60
Facility 3.60
CA AVG 4.22
Rank #269 / 354
-29%-15%
$0
Facility $0
CA AVG $56.5k
Rank #1 / 362
-
26
Facility 26
CA AVG 50.2
Rank #86 / 361
3.7
Facility 3.7
CA AVG 4.6
Rank #135 / 361
-53-
87
Facility 87
CA AVG 57
Rank #249 / 2092
Franklin Hughes
$10.0M
Facility $10.0M
CA AVG $17.0M
Rank #218 / 355
$5.4M
Facility $5.4M
CA AVG $7.0M
Rank #281 / 355
54.1%
Facility 54.1%
CA AVG 45.2%
Rank #300 / 355
555331
Mission Care Center
NH
MC
Riverside (Ramona)
40
Facility 40
CA AVG 103
Rank #1209 / 1657
95.0%
Facility 95.0%
CA AVG 84.7%
Rank #193 / 1537
+12%
2.55
Facility 2.55
CA AVG 4.22
Rank #353 / 354
+94%-40%
$0
Facility $0
CA AVG $56.5k
Rank #1 / 362
-
22
Facility 22
CA AVG 50.2
Rank #57 / 361
5.5
Facility 5.5
CA AVG 4.6
Rank #277 / 361
138-
44
Facility 44
CA AVG 57
Rank #1488 / 2092
Riverside Equities LLC
$9.8M
Facility $9.8M
CA AVG $17.0M
Rank #272 / 355
$5.9M
Facility $5.9M
CA AVG $7.0M
Rank #260 / 355
60.4%
Facility 60.4%
CA AVG 45.2%
Rank #120 / 355
55542
Palm Terrace Care Center
NH
NC
Riverside (La Sierra Hills)
71
Facility 71
CA AVG 103
Rank #998 / 1657
88.1%
Facility 88.1%
CA AVG 84.7%
Rank #374 / 1537
+4%
3.75
Facility 3.75
CA AVG 4.22
Rank #245 / 354
-9%-11%
$0
Facility $0
CA AVG $56.5k
Rank #1 / 362
-
26
Facility 26
CA AVG 50.2
Rank #86 / 361
4.3
Facility 4.3
CA AVG 4.6
Rank #196 / 361
-66A
18
Facility 18
CA AVG 57
Rank #1874 / 2092
-
$14.2M
Facility $14.2M
CA AVG $17.0M
Rank #237 / 355
$7.0M
Facility $7.0M
CA AVG $7.0M
Rank #223 / 355
49.6%
Facility 49.6%
CA AVG 45.2%
Rank #141 / 355
555365
Community Care On Palm
NH
ADC
AL
NC
RC
Riverside (Wood Streets)
51
Facility 51
CA AVG 103
Rank #1131 / 1657
97.1%
Facility 97.1%
CA AVG 84.7%
Rank #165 / 1537
+15%
4.24
Facility 4.24
CA AVG 4.22
Rank #138 / 354
-62%+1%
$33.5k
Facility $33.5k
CA AVG $56.5k
Rank #287 / 362
-
52
Facility 52
CA AVG 50.2
Rank #235 / 361
3.7
Facility 3.7
CA AVG 4.6
Rank #135 / 361
349-
55
Facility 55
CA AVG 57
Rank #1215 / 2092
Ezequiel Bercovich
$8.9M
Facility $8.9M
CA AVG $17.0M
Rank #321 / 355
$3.9M
Facility $3.9M
CA AVG $7.0M
Rank #320 / 355
44.3%
Facility 44.3%
CA AVG 45.2%
Rank #132 / 355
555711
Riverwalk Post Acute
NH
HC
Riverside (Arlington)
146
Facility 146
CA AVG 103
Rank #385 / 1657
--
3.41
Facility 3.41
CA AVG 4.22
Rank #316 / 354
-47%-19%
$0
Facility $0
CA AVG $56.5k
Rank #1 / 362
-
58
Facility 58
CA AVG 50.2
Rank #263 / 361
2.4
Facility 2.4
CA AVG 4.6
Rank #25 / 361
-6A+
70
Facility 70
CA AVG 57
Rank #740 / 2092
Calvin Patel
$23.4M
Facility $23.4M
CA AVG $17.0M
Rank #44 / 355
$11.9M
Facility $11.9M
CA AVG $7.0M
Rank #76 / 355
51%
Facility 51%
CA AVG 45.2%
Rank #307 / 355
555017

Financial Assistance for
Nursing Home in California

Palm Terrace Care Center is located in Riverside, California.
Here are the financial assistance programs available to residents in California.

Get Financial aid guidance

Multipurpose Senior Services Program

MSSP (Medi-Cal Waiver)

Age 65+
General California resident, Medi-Cal eligible, nursing home risk.
Income Limits (2025) ~$2,829/month 300% FBR, individual
Asset Limits $2,000 (individual), $3,000 (couple).
CA

County-managed; waitlists possible.

Benefits
In-home support (4-6 hours/day) Respite care (14 days/year) Meals (~$6/meal) Transportation (8 trips/month) Care management

In-Home Supportive Services (IHSS)

California IHSS

Age 65+
General California resident, Medicaid-eligible or low-income.
Income Limits ~$1,732/month individual, Medi-Cal threshold
Asset Limits $2,000 individual
CA

Can hire family as caregivers.

Benefits
Personal care (up to 283 hours/month) Homemaker services Respite (varies)

Multipurpose Senior Services Program (MSSP)

CA MSSP

Age 65+
General California resident, Medi-Cal-eligible, nursing home-eligible but community-capable.
Income Limits ~$2,829/month 300% FBR, individual
Asset Limits $2,000 individual
CA

Available in 38 counties; waitlists common.

Benefits
Case management Respite care (up to 10 days/year) Minor home mods (avg. $500) Adult day care (~$50/day)

Property Tax Postponement Program (PTP)

CA PTP

Age 62+
General California resident, own and live in home, 40% equity.
Income Limits (2025) ~$51,500/year household, adjusted annually
Asset Limits Equity-based; no strict asset cap.
CA

Deferred taxes accrue interest (5% as of 2024); repaid upon sale/death.

Benefits
Property tax deferral (avg. $1,000-$3,000/year, varies by county)

Assisted Living Waiver (ALW)

CA ALW

Age 65+ or disabled
General California resident, Medi-Cal-eligible, nursing home-eligible.
Income Limits ~$2,829/month 300% FBR, individual
Asset Limits $2,000 individual
CA

Available in 15 counties (e.g., LA, Sacramento); waitlists common.

Benefits
Personal care in ALFs (5-7 hours/day) Medication management Social services

California CARES Program

CA CARES

Age
General Caregivers of California residents 60+ needing help with 3+ daily activities; no caregiver age limit.
Income Limits No strict limit; cost-sharing above ~$2,500/month threshold.
Asset Limits Not applicable; need-based.
CA

High demand in urban areas; complements IHSS respite.

Benefits
Respite care (up to 10 days/year) Counseling (4-6 sessions/year) Training (2-3 workshops/year) Supplies (~$200/year)

Frequently Asked Questions about Palm Terrace Care Center

What neighborhood is Palm Terrace Care Center in?

Palm Terrace Care Center is in the La Sierra Hills neighborhood of Riverside.

Is Palm Terrace Care Center in a walkable area?

Palm Terrace Care Center has a walk score of 18. Car-dependent. Most errands require a car, with limited nearby walkable options.

What is the occupancy rate at Palm Terrace Care Center?

Palm Terrace Care Center's occupancy is 88.1%.

Are there photos of Palm Terrace Care Center?

Yes — there are 5 photos of Palm Terrace Care Center in the photo gallery on this page.

What is the address of Palm Terrace Care Center?

Palm Terrace Care Center is located at 11162 Palm Terrace Ln, Riverside, CA 92505.

What is the phone number of Palm Terrace Care Center?

(951) 687-7330 will put you in contact with the team at Palm Terrace Care Center.

Is Palm Terrace Care Center Medicare or Medicaid certified?

Yes — Palm Terrace Care Center is a CMS-certified provider of Medicare and Medicaid.

Guides for Better Senior Living

Care Cost Calculator: See Prices in Your Area

Nursing Home Data Explorer

Don’t Wait Too Long: 7 Red Flag Signs Your Parent Needs Assisted Living Now

The True Cost of Assisted Living in 2025 – And How Families Are Paying For It

Understanding Senior Living Costs: Pricing Models, Discounts & Financial Assistance