


Total staff
95
Employees
76
Contractors
19
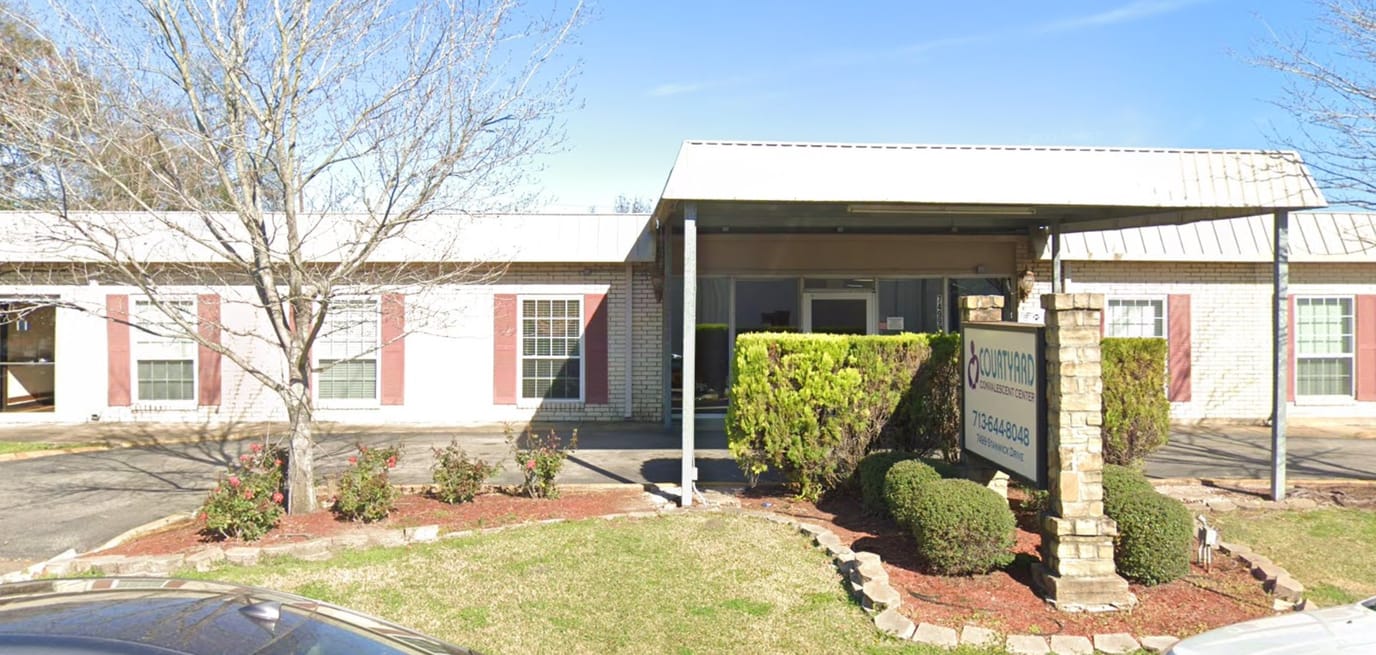
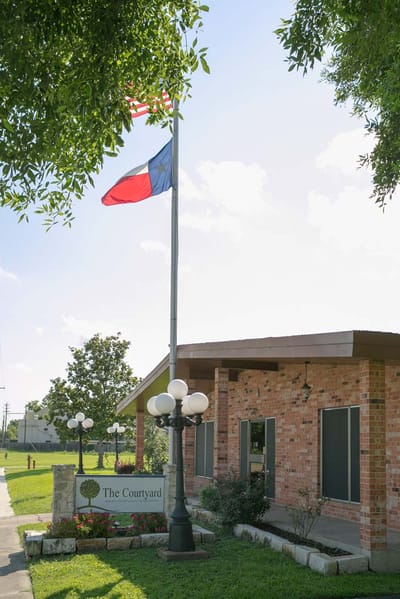


At 7499 Stanwick Drive in southeast Houston, Courtyard Nursing and Rehabilitation operates as a 120-bed skilled nursing facility owned by Stanwick Senior Care LLC. The resident census is predominantly Medicaid (74.6%), with Medicare at 3.2% and private pay at 22.2%; average length of stay stretches to 435 days, reflecting a long-term care focus.
The facility is 9.3 miles from downtown Houston in Harris County and located in a very walkable neighborhood (Walk Score: 73).
Courtyard’s 2-star CMS overall rating reflects a split performance: health inspection earns 3-star (8.6% above Texas average), and quality measures are rated 3-star (6.5% above state average), but staffing is severely constrained at 1-star (52.9% below state average). The 95-person workforce includes 19 contractors; staff-to-resident ratio is 1.51:1, at state average.
The facility provides 3h 3m of nursing per resident daily, but registered nurse presence is minimal: only 5 minutes per resident per day, 81% below the state average of 26 minutes. The facility has just 3 RNs serving 120 beds. Licensed practical nurses partially compensate with 1h 14m per day (30% above state), and certified nursing aides provide 2h 32m (26% above state). Weekend RN coverage drops to 4 minutes per day.
Long-stay residents experience urinary tract infections at 4.9%, dramatically worse than the 0.8% state average; a 510% variance and potential marker of infection control gaps. Weight loss affects 5.3%, 54% worse than state average. Short-stay residents newly started on antipsychotic medication run 6.8%, 370% worse than the state average of 1.4%, raising questions about pharmacological care decisions. Falls with major injury and depression rates are impressively low.
A June 2023 federal fine of $36,000 was the only penalty; no payment denials occurred.
Occupancy stands at 59.6%, notably low and 6% below state average.
The facility reported an operating loss of $7.0 million in 2023, a severe deterioration from the $697,000 loss in 2022. By revenue, it’s ranked 256th of 297 Texas SNFs.
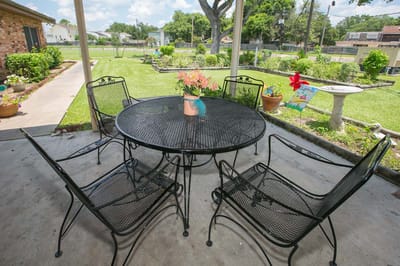
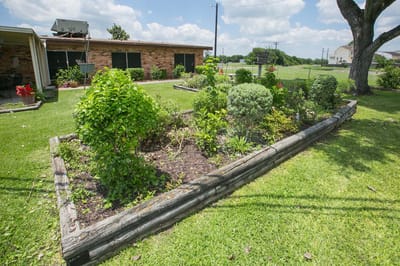
Courtyard offers in-house therapy, wellness classes, rehabilitation services, and a courtyard. The facility suits long-term Medicaid residents, though minimal RN staffing, elevated infection and medication-initiation rates, and mounting operational losses present significant clinical and financial risk.
| Staff type | Hours / Day / Resident | vs state avg |
|---|---|---|
|
Registered Nurse (RN)
| 10m per day | ▼ 63% State avg: 26m per day · National avg: 41m per day |
|
LPN / LVN
| 1h 14m per day | ▲ 30% State avg: 57m per day · National avg: 52m per day |
|
Nurse Aide
| 2h 12m per day | ▲ 9% State avg: 2h 1m per day · National avg: 2h 21m per day |
|
Weekend Total Nursing
| 3h 26m per day | ▲ 15% State avg: 2h 59m per day · National avg: 3h 26m per day |
|
Physical Therapist
| 3m per day | ▼ 28% State avg: 4m per day · National avg: 4m per day |
|
Weekend RN
| 9m per day | ▼ 58% State avg: 21m per day · National avg: 29m per day |
Reporting period: October 1 – December 31, 2025 (Q4 2025). Source: CMS Payroll-Based Journal report.
Manages medical care and health needs.
Assists with medical care and medications.
Helps with daily care and mobility.
Total hours from contractors
4,268 contractor hours this quarter
| Certified Nursing Assistant | 36 | 0 | 36 | 11,056 | 92 | 100% | 7.8 |
| Licensed Practical Nurse | 21 | 0 | 21 | 7,081 | 92 | 100% | 8.4 |
| Medication Aide/Technician | 7 | 0 | 7 | 2,865 | 92 | 100% | 8.5 |
| Physical Therapy Aide | 0 | 4 | 4 | 1,420 | 73 | 79% | 7.3 |
| Speech Language Pathologist | 0 | 4 | 4 | 1,184 | 80 | 87% | 7.8 |
| Qualified Social Worker | 0 | 2 | 2 | 807 | 68 | 74% | 6.1 |
| RN Director of Nursing | 2 | 0 | 2 | 699 | 63 | 68% | 8.1 |
| Nurse Practitioner | 2 | 0 | 2 | 512 | 64 | 70% | 8 |
| Dietitian | 1 | 0 | 1 | 509 | 67 | 73% | 7.6 |
| Mental Health Service Worker | 1 | 0 | 1 | 496 | 62 | 67% | 8 |
| Physical Therapy Assistant | 0 | 1 | 1 | 490 | 61 | 66% | 8 |
| Administrator | 1 | 0 | 1 | 448 | 56 | 61% | 8 |
| Qualified Activities Professional | 1 | 0 | 1 | 360 | 43 | 47% | 8.4 |
| Respiratory Therapy Technician | 0 | 3 | 3 | 305 | 49 | 53% | 6.2 |
| Clinical Nurse Specialist | 1 | 0 | 1 | 293 | 38 | 41% | 7.7 |
| Registered Nurse | 3 | 0 | 3 | 217 | 30 | 33% | 7.2 |
| Feeding Assistant | 0 | 2 | 2 | 54 | 24 | 26% | 2 |
| Occupational Therapy Assistant | 0 | 1 | 1 | 5 | 3 | 3% | 1.5 |
| Occupational Therapy Aide | 0 | 2 | 2 | 4 | 14 | 15% | 0.3 |
Federal penalties imposed by CMS for regulatory violations, including civil money penalties (fines) and denials of payment for new Medicare/Medicaid admissions.
Source: CMS Penalties Database (Data as of Jan 2026)
Texas average: $80K
Texas average: 2.5
Texas average: 0.2
No penalties in the past 3 years
No civil money penalties or payment denials were reported in the last 3 years.
These measures show how residents usually do over time at this home, based on health outcomes and preventive care.
Texas average: 8.6
Texas average: 16.0
Texas average: 16.2%
Texas average: 16.2%
Texas average: 15.7%
Texas average: 3.2%
Texas average: 4.4%
Texas average: 0.8%
Texas average: 3.5%
Texas average: 2.9%
Texas average: 7.9%
Texas average: 97.3%
Texas average: 97.9%
Texas average: 90.4%
Texas average: 1.4%
Texas average: 88.0%
Texas average: 25.9%
Texas average: 12.0%
Texas average: 0.8%
Quality measures are calculated from Minimum Data Set (MDS) assessments. For most measures, lower percentages indicate better care quality.
21% of new residents, usually for short-term rehab.
23% of new residents, often for short stays.
57% of new residents, often for long-term daily care.
Source: CMS Long-Term Care Facility Characteristics (Data as of Jan 2026)
Residents meet regularly to discuss policies, care quality, and activities
Organized group of residents that meets regularly to discuss facility policies, quality of life, and activities.
Data sourced from CMS Long-Term Care Facility Characteristics quarterly report. Payer mix reflects the current resident census by primary payment source.
Historical financial and operational data for Courtyard Nursing and Rehabilitation from 2012–2023, based on CMS SNF Cost Reports.
Key figures below are for fiscal year ending in 12/2022 — the home's most recent complete cost report, an older period than most facilities report.
Based on the home's most recent complete CMS SNF Cost Report — fiscal year ending in 12/2022. This is an older period than most facilities report, so compare with that in mind.
Most residents stay for extended periods and receive ongoing daily care.
Most new residents arrive under Medicaid (57% of admissions), and a typical Medicaid stay runs around 2 years.
Coverage residents most often arrive under.
Coverage residents most often leave under.
![]() 7.4 miles from city center
7.4 miles from city center
![]() Estimated distance in miles from Houston's city center to Courtyard Nursing and Rehabilitation's address, calculated via Google Maps.
Estimated distance in miles from Houston's city center to Courtyard Nursing and Rehabilitation's address, calculated via Google Maps.
Add your location
Info below is compiled from CMS reports & the TX Health & Human Services Commission (HHSC), senior community websites & trusted data sources such as Walk Score & BBB.
Communities are listed from highest to lowest based on our ranking methodology.
| Park Manor of CyFair | NH SNF | Houston (White Oak Bend) | 120
Facility
120
TX AVG
79
Rank
#204 / 972 |
89.2%
Facility
89.2%
TX AVG
67.3
Rank
#33 / 195 | +32% | 3.27
Facility
3.27
TX AVG
3.63
Rank
#158 / 239 | +82% | -10% | $0
Facility
$0
TX AVG
$81.8k
Rank
#1 / 244 | 7
Facility
7
TX AVG
25.9
Rank
#11 / 241 | 2.3
Facility
2.3
TX AVG
3.7
Rank
#39 / 241 | - | 107 | - |
55
Facility
55
TX AVG
41
Rank
#385 / 1389 | Hmg Park Manor Of Cyfair, L.l.c | $9.7MFiscal year ending 08/2024
Facility
$9.7MFiscal year ending 08/2024
TX AVG
$8.4M
Rank
#127 / 245 | $4.4MFiscal year ending 08/2024
Facility
$4.4MFiscal year ending 08/2024
TX AVG
$3.5M
Rank
#129 / 245 | 45.1%Fiscal year ending 08/2024
Facility
45.1%Fiscal year ending 08/2024
TX AVG
47%
Rank
#120 / 245 | 675818 | ||||
| Houston Transitional Care | NH HOS MC PC RC SNF | Houston (Braeburn) | 70
Facility
70
TX AVG
79
Rank
#503 / 972 |
96.0%
Facility
96.0%
TX AVG
67.3
Rank
#4 / 195 | +43% | 3.17
Facility
3.17
TX AVG
3.63
Rank
#181 / 239 | +22% | -13% | $0
Facility
$0
TX AVG
$81.8k
Rank
#1 / 244 | 16
Facility
16
TX AVG
25.9
Rank
#62 / 241 | 5.3
Facility
5.3
TX AVG
3.7
Rank
#222 / 241 | - | 67 | - |
75
Facility
75
TX AVG
41
Rank
#67 / 1389 | Ahmad El-Saadi | $12.3MFiscal year ending 12/2023
Facility
$12.3MFiscal year ending 12/2023
TX AVG
$8.4M
Rank
#30 / 245 | $5.1MFiscal year ending 12/2023
Facility
$5.1MFiscal year ending 12/2023
TX AVG
$3.5M
Rank
#116 / 245 | 41.4%Fiscal year ending 12/2023
Facility
41.4%Fiscal year ending 12/2023
TX AVG
47%
Rank
#240 / 245 | 676435 | ||||
| Caraday of Houston | NH MC RC SNF | Houston (Northside / Northline) | 150
Facility
150
TX AVG
79
Rank
#63 / 972 | - | - | 3.76
Facility
3.76
TX AVG
3.63
Rank
#77 / 239 | -32% | +4% | $0
Facility
$0
TX AVG
$81.8k
Rank
#1 / 244 | 15
Facility
15
TX AVG
25.9
Rank
#55 / 241 | 3.8
Facility
3.8
TX AVG
3.7
Rank
#167 / 241 | - | 12 | - |
41
Facility
41
TX AVG
41
Rank
#707 / 1389 | E&R Cunningham Investments, LP | $2.7MFiscal year ending 12/2023
Facility
$2.7MFiscal year ending 12/2023
TX AVG
$8.4M
Rank
#244 / 245 | $1.8MFiscal year ending 12/2023
Facility
$1.8MFiscal year ending 12/2023
TX AVG
$3.5M
Rank
#241 / 245 | 66.5%Fiscal year ending 12/2023
Facility
66.5%Fiscal year ending 12/2023
TX AVG
47%
Rank
#82 / 245 | 676470 | ||||
| Brazos Tower at Bayou Manor | NH AL IL MC SNF | Houston (Braeswood) | 33
Facility
33
TX AVG
79
Rank
#757 / 972 | - | - | 5.78
Facility
5.78
TX AVG
3.63
Rank
#5 / 239 | -37% | +59% | $46.6k
Facility
$46.6k
TX AVG
$81.8k
Rank
#169 / 244 | 5
Facility
5
TX AVG
25.9
Rank
#6 / 241 | 1.7
Facility
1.7
TX AVG
3.7
Rank
#8 / 241 | - | 28 | - |
64
Facility
64
TX AVG
41
Rank
#209 / 1389 | Sharon Darden | $4.7MFiscal year ending 12/2023
Facility
$4.7MFiscal year ending 12/2023
TX AVG
$8.4M
Rank
#25 / 245 | $7.0MFiscal year ending 12/2023
Facility
$7.0MFiscal year ending 12/2023
TX AVG
$3.5M
Rank
#49 / 245 | 151%Fiscal year ending 12/2023
Facility
151%Fiscal year ending 12/2023
TX AVG
47%
Rank
#233 / 245 | 676282 | ||||
| Courtyard Nursing and Rehabilitation | NH RC SNF | Houston (Southeast Houston) | 120
Facility
120
TX AVG
79
Rank
#204 / 972 |
57.2%
Facility
57.2%
TX AVG
67.3
Rank
#145 / 195 | -15% | 3.05
Facility
3.05
TX AVG
3.63
Rank
#191 / 239 | -58% | -16% | $0
Facility
$0
TX AVG
$81.8k
Rank
#1 / 244 | 18
Facility
18
TX AVG
25.9
Rank
#82 / 241 | 6.0
Facility
6.0
TX AVG
3.7
Rank
#232 / 241 | 1 | 69 | - |
73
Facility
73
TX AVG
41
Rank
#95 / 1389 | Stanwick Senior Care LLC | $5.7M*Fiscal year ending 12/2022These figures are from this home's most recent complete cost report — an older period than most facilities report. Compare with that in mind.
Facility
$5.7M*Fiscal year ending 12/2022These figures are from this home's most recent complete cost report — an older period than most facilities report. Compare with that in mind.
TX AVG
$8.4M
Rank
#220 / 245 | $3.0M*Fiscal year ending 12/2022These figures are from this home's most recent complete cost report — an older period than most facilities report. Compare with that in mind.
Facility
$3.0M*Fiscal year ending 12/2022These figures are from this home's most recent complete cost report — an older period than most facilities report. Compare with that in mind.
TX AVG
$3.5M
Rank
#221 / 245 | 51.8%*Fiscal year ending 12/2022These figures are from this home's most recent complete cost report — an older period than most facilities report. Compare with that in mind.
Facility
51.8%*Fiscal year ending 12/2022These figures are from this home's most recent complete cost report — an older period than most facilities report. Compare with that in mind.
TX AVG
47%
Rank
#120 / 245 | 455613 |
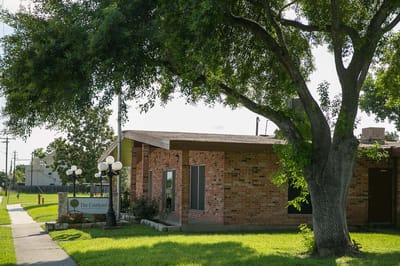
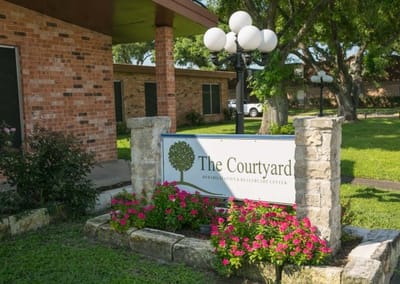
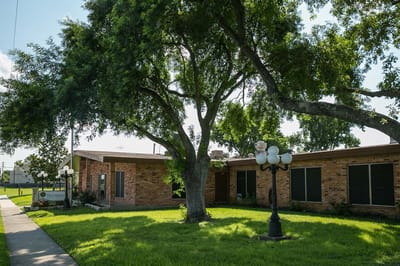
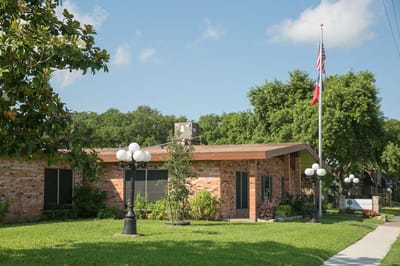
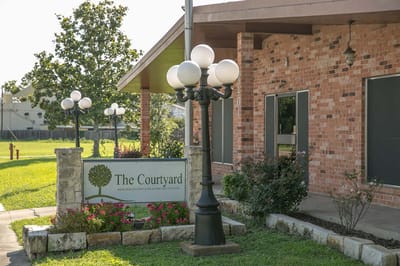
Courtyard Nursing and Rehabilitation is located in Houston, Texas.
Here are the financial assistance programs available to residents in Texas.
Courtyard Nursing and Rehabilitation is in the Southeast Houston neighborhood.
Courtyard Nursing and Rehabilitation has a walk score of 73. Very walkable. Most errands can be accomplished on foot, and many essentials are within a short walk.
Courtyard Nursing and Rehabilitation's occupancy is 59.6%.
No, Courtyard Nursing and Rehabilitation has a no-pet policy.
Courtyard Nursing and Rehabilitation is registered as a for-profit.
Yes — there are 20 photos of Courtyard Nursing and Rehabilitation in the photo gallery on this page.
Courtyard Nursing and Rehabilitation is located at 7499 Stanwick Dr, Houston, TX 77087.
Care Cost Calculator: See Prices in Your Area
Nursing Home Data Explorer
Don’t Wait Too Long: 7 Red Flag Signs Your Parent Needs Assisted Living Now
The True Cost of Assisted Living in 2025 – And How Families Are Paying For It
Understanding Senior Living Costs: Pricing Models, Discounts & Financial Assistance


