Cypress Cove Center
Nursing Home & Memory Care · Muscle Shoals, AL
CMS overall rating Info CMS (the Centers for Medicare & Medicaid Services) is the federal agency that rates nursing home quality. Its Overall Rating runs from 1 to 5 stars, combining health inspections, staffing, and quality measures, with inspections weighted most heavily.

Cypress Cove Center

Nursing Home & Memory Care · Muscle Shoals, AL
CMS overall rating Info CMS (the Centers for Medicare & Medicaid Services) is the federal agency that rates nursing home quality. Its Overall Rating runs from 1 to 5 stars, combining health inspections, staffing, and quality measures, with inspections weighted most heavily.
Calculator: See prices in your area
Cypress Cove Center accepts Medicare, Medicaid, and private pay.

Overview of Cypress Cove Center

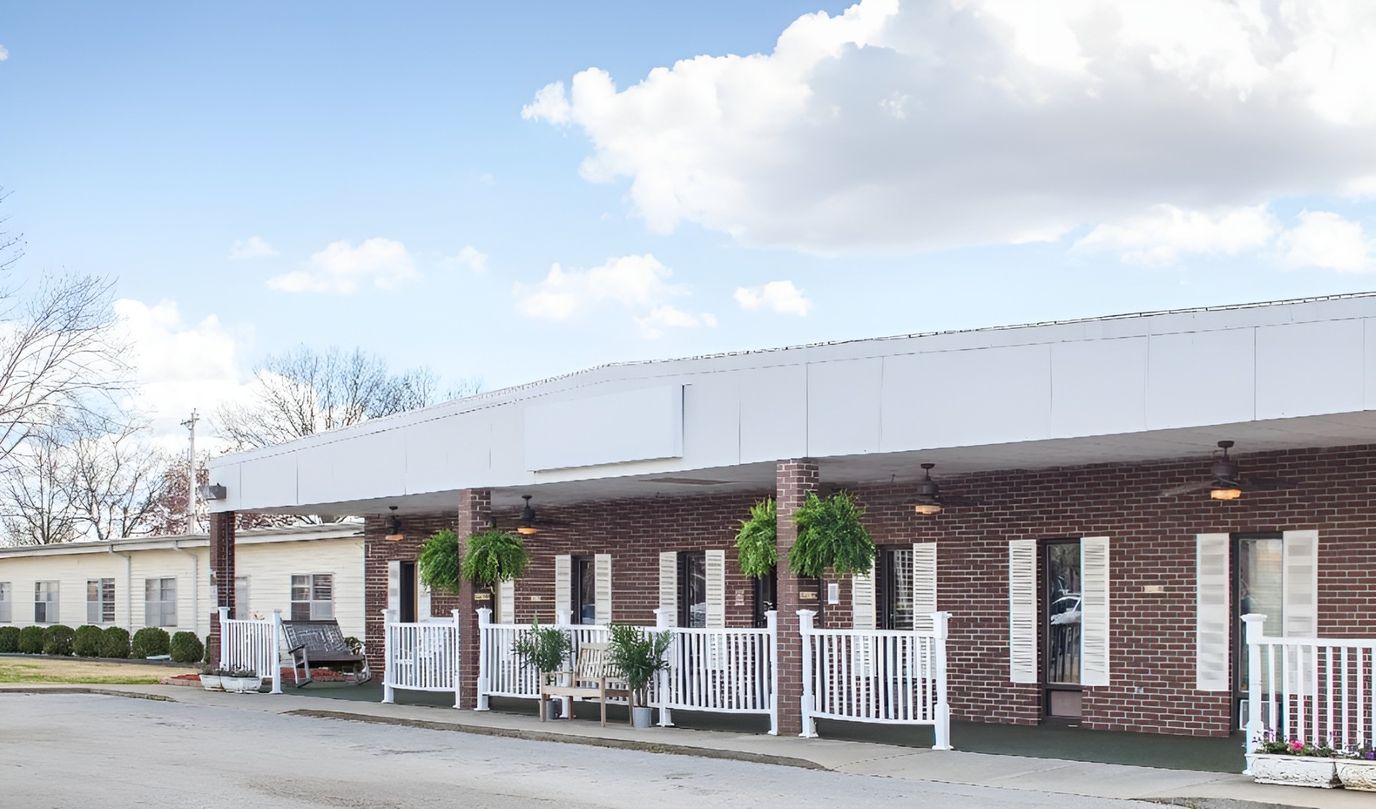
Cypress Cove Center is an astounding nursing home in Muscle Shoals, AL, that offers a wide range of care options, from short-term rehabilitation to long-term care. The community can accommodate up to 84 older adults with its supportive and welcoming environment. Medication management, 24-hour emergency response, and dietary management are also provided to help improve residents’ quality of life. Through a personalized approach to care, the community ensures residents receive the utmost attention and care for their needs.

Educational programs, cultural, and social activities also provide residents with more opportunities to connect with friends and gain meaningful experiences. An on-site medical director and registered nurses also oversee residents’ care to ensure their comfort. Residents also have easy access to restaurants, shops, and other local amenities for their needs and recreation. This nursing home is a trusted care provider in Alabama, striving to help older adults live to their potential in retirement.

Quality ratings

Measured by Centers for Medicare & Medicaid Services (CMS)

Overall rating Info The Overall CMS Rating combines results from health inspections, staffing levels and quality measures. Health inspections carry the most weight. Staffing and quality scores can increase or decrease the final rating based on performance compared to state and national standards.
▲ 70.0% Above AL avg. ▲ 70.0% Above AL avg.AL average: 2.9Click the badge to see the full State ranking.Click here to see the full State ranking.
Health Inspection Info Based on the results of the facility's three most recent standard inspections and any complaint investigations. CMS reviews the number, scope, and severity of deficiencies, with more recent findings weighted more heavily.
▲ 76.4% Above AL avg. ▲ 76.4% Above AL avg.AL average: 2.8Click the badge to see the full State ranking.Click here to see the full State ranking.
Staffing Info Measures average nursing staff hours per resident per day, including Registered Nurses (RNs) and total nursing staff. Ratings are adjusted based on the level of care residents require and are compared to state and national benchmarks.
▲ 12.9% Above AL avg. ▲ 12.9% Above AL avg.AL average: 3.5Click the badge to see the full State ranking.Click here to see the full State ranking.
Quality Measures Info Based on clinical and physical health indicators reported to CMS, such as hospital readmissions, falls, pressure ulcers, and improvements in mobility. These measures reflect how well residents' health needs are being managed.
▲ 34.3% Above AL avg. ▲ 34.3% Above AL avg.AL average: 3.0Click the badge to see the full State ranking.Click here to see the full State ranking.

Staffing hours breakdown

Info Daily nursing hours per resident by staff type, reported to CMS. Higher is generally better — compare this facility to state and national averages to see where staffing stands.

Hours per resident per day — compared to Alabama state averages

Total nursing care / resident Info This home is ranked 123rd out of 136 homes in Alabama for nurse hours. Total adjusted nursing hours per resident per day, combining RN, LPN, and aide time. CMS adjusts this for case-mix so facilities can be fairly compared.
3h 29m per day
Rank #123 / 136Nurse hours — State benchmarkedThis home is ranked 123rd out of 136 homes in Alabama. Shows adjusted nurse hours per resident per day benchmarked to the Alabama average, with a ranking across 136 Alabama facilities. More hours mean more direct care. The national average is about 3.5 hrs; below 3.0 is a red flag.Rankings are based only on facilities in Alabama that report data for that category. Facilities without available data are excluded from the ranking.Click the rank badge to see the full State ranking.Click here to see the full State ranking.
This facility Alabama avg (4h 22m per day)
vs Alabama avg
-20%

4 of 6 metrics below state avg

Standout metric Weekend RN is +73% above state avg
Staff typeHours / Day / Residentvs state avg
Registered Nurse (RN) Info RNs hold the highest nursing license and can assess residents, interpret test results, and direct care plans. More RN hours per day often signals stronger clinical oversight and faster response to health changes. 1h 3m per day ▲ 66% State avg: 38m per day · National avg: 41m per day
LPN / LVN Info Licensed Practical Nurses (LPNs) or Licensed Vocational Nurses (LVNs) deliver routine hands-on care — medication administration, wound dressing, and monitoring vital signs. They work under RN supervision and make up a large share of daily bedside care. 25m per day ▼ 47% State avg: 47m per day · National avg: 52m per day
Nurse Aide Info Certified Nurse Aides (CNAs) provide the most direct day-to-day assistance: bathing, dressing, feeding, and mobility. Nurse aide hours are typically the largest staffing category and directly affect residents' quality of life. 1h 47m per day ▼ 29% State avg: 2h 30m per day · National avg: 2h 21m per day
Weekend Total Nursing Info Combined nursing hours (RN + LPN + Nurse Aide) per resident per day on weekends. Staffing often drops on weekends — this figure reveals whether the facility maintains adequate coverage outside of weekday hours. 2h 48m per day ▼ 15% State avg: 3h 17m per day · National avg: 3h 26m per day
Physical Therapist Info Hours per resident per day provided by licensed Physical Therapists (PTs) or PT Assistants. PT services help residents recover mobility after injury or illness and are especially important for post-acute (short-stay) rehabilitation. 2m per day ▼ 17% State avg: 2m per day · National avg: 4m per day
Weekend RN Info Registered nurse hours specifically on weekends. Facilities sometimes reduce RN presence on Saturdays and Sundays — a low weekend RN figure compared to weekday hours can indicate reduced clinical oversight when most administrative staff are absent. 38m per day ▲ 73% State avg: 22m per day · National avg: 29m per day

Capacity and availability

This home usually has limited availability

Higher occupancy than the Alabama average: 80.8%
Occupancy rate
87.8% Rank #42 / 138Occupancy rate — State benchmarkedThis home is ranked 42nd out of 138 homes in Alabama. Shows this facility's occupancy rate versus the Alabama average, with its Statewide rank out of 138. Higher occupancy signals strong local demand and financial stability.Rankings are based only on facilities in Alabama that report data for that category. Facilities without available data are excluded from the ranking.Click the rank badge to see the full State ranking.Click here to see the full State ranking.
Avg. Length of Stay
96 days
Bed community size
90-bed community Rank #106 / 245Bed count — State benchmarkedThis home is ranked 106th out of 245 homes in Alabama. Shows this facility's certified or reported bed count compared to other Alabama facilities. Larger communities may offer more amenities, programs, and on-site services for residents and families.Rankings are based only on facilities in Alabama that report data for that category. Facilities without available data are excluded from the ranking.Click the rank badge to see the full State ranking.Click here to see the full State ranking.
A larger shared setting that may offer more common spaces and organized community services.
Walk Score
Walk Score: 50 / 100 Rank #118 / 418Walk Score — State benchmarkedThis home is ranked 118th out of 418 homes in Alabama. Shows how walkable this facility's neighborhood is compared to the average Walk Score across Alabama facilities. Higher scores benefit residents, families, and staff.Rankings are based only on facilities in Alabama that report data for that category. Facilities without available data are excluded from the ranking.Click the rank badge to see the full State ranking.Click here to see the full State ranking.
Moderately walkable. Some errands can be accomplished on foot, with a mix of nearby amenities.

Contact Cypress Cove Center

Staffing Data

Reporting period: October 1 – December 31, 2025 (Q4 2025). Source: CMS Payroll-Based Journal report.

Total staff 115
Employees 109
Contractors 6
Staff to resident ratio 1.58 : 1
0% compared with Alabama average
Alabama average ratio: 1.56 : 1 Alabama average ratio: 1.56 : 1See full Alabama ranking
Avg staff/day 37
Average shift 8.3 hours
5% better than Alabama average
Alabama average: 7.9 hours Alabama average shift: 7.9 hoursSee full Alabama ranking
Total staff hours (quarter) 28,091

Nursing staff breakdown

Q4 2025 · Oct 1 – Dec 31 More info This data comes from the CMS Payroll-Based Journal report covering October 1 – December 31, 2025.
Registered Nurse

Manages medical care and health needs.

RN Staff Info 26 total: 25 full-time employees and 1 contractor. 26
Average shift length Info Average shift length. Calculated as total hours divided by days worked and average staff per day. 8.8 hours
Licensed Practical Nurse

Assists with medical care and medications.

LPN Staff Info All 12 LPN Staff are full-time employees. No contractors work on this role. 12
Average shift length Info Average shift length. Calculated as total hours divided by days worked and average staff per day. 9.4 hours
Certified Nursing Assistant

Helps with daily care and mobility.

CNA Staff Info All 40 CNA Staff are full-time employees. No contractors work on this role. 40
Average shift length Info Average shift length. Calculated as total hours divided by days worked and average staff per day. 9 hours

Contractor staffing

Q4 2025 · Oct 1 – Dec 31 More info This data comes from the CMS Payroll-Based Journal report covering October 1 – December 31, 2025.

Total hours from contractors

1.2%

333 contractor hours this quarter

Occupational Therapy Aide: 2 Occupational Therapy Assistant: 2 Registered Nurse: 1 Medical Director: 1

Staff by category

Q4 2025 · Oct 1 – Dec 31 More info This data comes from the CMS Payroll-Based Journal report covering October 1 – December 31, 2025.
Certified Nursing Assistant4004011,57792100%9
Registered Nurse251265,37392100%8.8
Licensed Practical Nurse120122,9319199%9.4
Clinical Nurse Specialist7071,5276470%8
Other Dietary Services Staff3031,2356975%7.8
Physical Therapy Aide4048397885%6.6
Medication Aide/Technician3037884953%10.5
Speech Language Pathologist3037486773%6
Other Social Services Staff1015006267%8.1
Nurse Practitioner1014796065%8
Mental Health Service Worker1014666166%7.6
Administrator2024315459%8
Qualified Social Worker1014046470%6.3
Occupational Therapy Aide0222153740%5.4
Respiratory Therapy Technician3031947177%2.7
Physical Therapy Assistant2021715964%2.9
Nurse Aide in Training101971516%6.5
Medical Director011663134%2.1
Occupational Therapy Assistant022491415%3.5
40 Certified Nursing Assistant
% of Days 100%
26 Registered Nurse
% of Days 100%
12 Licensed Practical Nurse
% of Days 99%
7 Clinical Nurse Specialist
% of Days 70%
3 Other Dietary Services Staff
% of Days 75%
4 Physical Therapy Aide
% of Days 85%
3 Medication Aide/Technician
% of Days 53%
3 Speech Language Pathologist
% of Days 73%
1 Other Social Services Staff
% of Days 67%
1 Nurse Practitioner
% of Days 65%
1 Mental Health Service Worker
% of Days 66%
2 Administrator
% of Days 59%
1 Qualified Social Worker
% of Days 70%
2 Occupational Therapy Aide
% of Days 40%
3 Respiratory Therapy Technician
% of Days 77%
2 Physical Therapy Assistant
% of Days 64%
1 Nurse Aide in Training
% of Days 16%
1 Medical Director
% of Days 34%
2 Occupational Therapy Assistant
% of Days 15%

Penalties and fines

Federal penalties imposed by CMS for regulatory violations, including civil money penalties (fines) and denials of payment for new Medicare/Medicaid admissions.

Source: CMS Penalties Database

No penalties in the past 3 years

No civil money penalties or payment denials were reported in the last 3 years.

Quality of care over time

These measures show how residents usually do over time at this home, based on health outcomes and preventive care.

High-risk clinical events score Info A composite score based on pressure ulcers, falls with injury, weight loss, walking ability decline, and activities of daily living decline. 8.1
9% better than Alabama average

Alabama average: 8.9

Functional decline score Info A composite score based on activities of daily living decline, walking ability decline, and incontinence. 13.0
10% better than Alabama average

Alabama average: 14.5

Long-stay resident measures
Significantly above average Info CMS star rating based on long-stay quality measure performance. 5 stars = significantly above average, 1 star = significantly below average.
Need for Help with Daily Activities Increased Info Percent of long-stay residents whose need for help with daily activities has increased 12.1%
13% better than Alabama average

Alabama average: 13.9%

Walking Ability Worsened Info Percent of long-stay residents whose ability to move independently worsened 13.3%
17% better than Alabama average

Alabama average: 16.1%

Low Risk Residents with Bowel/Bladder Incontinence Info Percent of low risk long-stay residents who lose control of their bowels or bladder 13.6%
In line with Alabama average

Alabama average: 13.6%

Falls with Major Injury Info Percent of long-stay residents experiencing one or more falls with major injury 4.8%
41% worse than Alabama average

Alabama average: 3.4%

High Risk Residents with Pressure Ulcers Info Percent of long-stay high risk residents with pressure ulcers 2.3%
61% better than Alabama average

Alabama average: 5.9%

Urinary Tract Infection Info Percent of long-stay residents with a urinary tract infection 0.4%
86% better than Alabama average

Alabama average: 2.7%

Lost Too Much Weight Info Percent of long-stay residents who lose too much weight 7.8%
44% worse than Alabama average

Alabama average: 5.4%

Depressive Symptoms Info Percent of long-stay residents who have depressive symptoms 7.5%
511% worse than Alabama average

Alabama average: 1.2%

Antipsychotic Use Info Percent of long-stay residents who received an antipsychotic medication 8.7%
58% better than Alabama average

Alabama average: 20.7%

Pneumococcal Vaccine Info Percent of long-stay residents assessed and appropriately given the pneumococcal vaccine 93.8%
In line with Alabama average

Alabama average: 91.5%

Influenza Vaccine Info Percent of long-stay residents assessed and appropriately given the seasonal influenza vaccine 100.0%
6% better than Alabama average

Alabama average: 94.8%

Hospitalizations per 1,000 days Info Number of hospitalizations per 1,000 long-stay resident days. 1.11
45% better than Alabama average

Alabama average: 2.00

ED visits per 1,000 days Info Number of outpatient emergency department visits per 1,000 long-stay resident days. 1.45
19% better than Alabama average

Alabama average: 1.79

Short-stay resident measures
Above average Info CMS star rating based on short-stay quality measure performance. 5 stars = much above average, 1 star = much below average.
Pneumococcal Vaccine Info Percent of short-stay residents assessed and appropriately given the pneumococcal vaccine 93.8%
12% better than Alabama average

Alabama average: 83.7%

Antipsychotic medication increase Info Percent of short-stay residents who newly received an antipsychotic medication 0.0%
100% better than Alabama average

Alabama average: 2.1%

Influenza Vaccine Info Percent of short-stay residents assessed and appropriately given the seasonal influenza vaccine 77.4%
In line with Alabama average

Alabama average: 80.3%

Re-hospitalized after SNF stay Info Percentage of short-stay residents who were re-hospitalized after their nursing home admission. 18.8%
23% better than Alabama average

Alabama average: 24.5%

Emergency department visits Info Percentage of short-stay residents who had an outpatient emergency department visit. 1.9%
83% better than Alabama average

Alabama average: 11.5%

Falls with major injury Info Percentage of SNF residents who experience falls with major injury during their stay. 3.3%
326% worse than Alabama average

Alabama average: 0.8%

Ability to care for self at discharge Info Percentage of residents at or above expected ability to care for themselves at discharge. 55.6%
In line with Alabama average

Alabama average: 53.7%

Successful return to home or community Info Rate of successful return to home or community from a skilled nursing facility. 41.2%
18% worse than Alabama average

Alabama average: 50.6%

Breakdown by payment type

Medicare

34% of new residents, usually for short-term rehab.

Typical stay 25 days

Private pay

59% of new residents, often for short stays.

Typical stay 22 days

Medicaid

7% of new residents, often for long-term daily care.

Typical stay 3 years

Facility Characteristics

Source: CMS Long-Term Care Facility Characteristics (Data as of Jan 2026)

Total residents 73
Medicare
4
5.5% of residents
Medicaid
61
83.6% of residents
Private pay or other
8
11% of residents
Programs & Services
Residents Group

Residents meet regularly to discuss policies, care quality, and activities

Nurse Aide Training

State-approved Nurse Aide Training and Competency Evaluation Program on-site

Active Resident Council

Organized group of residents that meets regularly to discuss facility policies, quality of life, and activities.

Finances and operations

Based on CMS SNF Cost Report for fiscal year ending in 06/2024.

For-profit
Corporation
Net patient revenue Info Net patient revenue — what the home actually collects for resident care, after contractual allowances, bad debt and discounts are subtracted from its gross charges (CMS cost report, Worksheet G-3). It covers resident care only; money the home earns from other sources is shown separately as "Other income."
$8.8M
Net patient income Info Net patient income: net patient revenue minus the home's total operating expenses. A positive figure means it earns more from resident care than it spends to deliver it; a negative figure means the opposite. It excludes non-operating "other income."
$398.1K
For-profit Corporation
Net patient revenue Info Net patient revenue — what the home actually collects for resident care, after contractual allowances, bad debt and discounts are subtracted from its gross charges (CMS cost report, Worksheet G-3). It covers resident care only; money the home earns from other sources is shown separately as "Other income."
$8.8M Rank #62 / 135Revenue — State benchmarkedThis home is ranked 62nd out of 135 homes in Alabama. Shows this facility's annual revenue compared to the Alabama average. Higher revenue generally means more resources for staffing and capital — read alongside Payroll %.Rankings are based only on facilities in Alabama that report data for that category. Facilities without available data are excluded from the ranking.Click the rank badge to see the full State ranking.Click here to see the full State ranking.
Net patient income Info Net patient income: net patient revenue minus the home's total operating expenses. A positive figure means it earns more from resident care than it spends to deliver it; a negative figure means the opposite. It excludes non-operating "other income."
$398.1K
Other income Info Money the home earns outside of resident care — such as investments, grants, rentals and other non-operating sources (CMS cost report, Worksheet G-3). It is tracked separately from net patient revenue: it is not part of that figure, and it is not included in net patient income.
$2.8K
Payroll costs Info Staff salaries plus wage-related costs — benefits such as payroll taxes, health insurance and retirement — from the home's own accounting records (CMS cost report, Worksheet A). Contract or agency labor is counted separately, under other operating costs. Rank #73 / 135Payroll — State benchmarkedThis home is ranked 73rd out of 135 homes in Alabama. Shows total annual staff payroll benchmarked to the Alabama average. Higher payroll investment relative to peers often signals better staffing and less reliance on cheaper contract labor.Rankings are based only on facilities in Alabama that report data for that category. Facilities without available data are excluded from the ranking.Click the rank badge to see the full State ranking.Click here to see the full State ranking.
$3.7M 41.8% of net patient revenue Info Payroll as a share of revenue: staff salaries and wage-related benefits divided by net patient revenue. A higher figure means more of each revenue dollar goes to staff pay. Rank #97 / 133Payroll % — State benchmarkedThis home is ranked 97th out of 133 homes in Alabama. Shows payroll as a percentage of revenue versus the Alabama average. Well-run Alabama facilities typically land around 54–69% — the top third Statewide. Below 25% may signal understaffing or heavy agency use — read with Staffing ratings.Rankings are based only on facilities in Alabama that report data for that category. Facilities without available data are excluded from the ranking.Click the rank badge to see the full State ranking.Click here to see the full State ranking.
Other operating costs Info Everything it costs to run the home apart from payroll — food, utilities, supplies, maintenance, contract labor and administration. Calculated as total operating expense minus payroll (staff salaries and wage-related benefits).
$4.7M
Total costs Info The home's total operating expense for the year — all the costs of running it, salaries included (CMS cost report, Worksheet G-3).
$8.4M

What does this home offer?

Minimum age icon
Minimum age icon

Minimum Age: 84 Years Old

Housing options icon

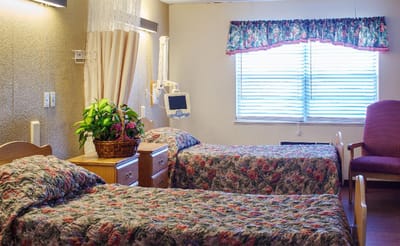
Housing Options: Private / Semi-Private Rooms

Building type icon
Building type icon

Building Type: Single-story

Beauty services icon

Beauty Services

Housekeeping icon
Housekeeping icon

Housekeeping Services

Social and recreational activities icon

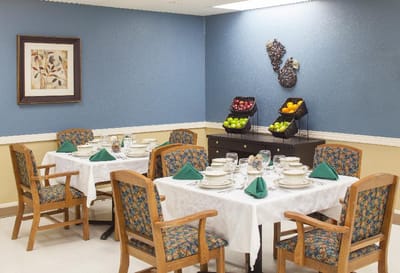
Social and Recreational Activities

Who this home usually serves

TYPE OF STAY

Mix of rehab and long-term care

This home supports both short-term rehab and long-term care, with residents staying for a wide range of durations.

Most new residents arrive under private pay (59% of admissions), and a typical private pay stay runs around 22 days.

Admissions
306 total

Coverage residents most often arrive under.

Medicare 34%
Private pay 59%
Medicaid 7%
Discharges
302 total

Coverage residents most often leave under.

Medicare 29%
Private pay 54%
Medicaid 17%

Places of interest near Cypress Cove Center

Address 1.8 miles from city center Info Estimated distance in miles from Muscle Shoals's city center to Cypress Cove Center's address, calculated via Google Maps.

Calculate Travel Distance to Cypress Cove Center

Add your location

Address

Compare Memory Care around Colbert County

The information below is reported by the Alabama Department of Public Health, Bureau of Health Provider Standards.

Cypress Cove Center
MC
NH
Muscle Shoals (Jackson Heights) -
90
Facility 90
AL AVG 90
Rank #106 / 245
-
50
Facility 50
AL AVG 36
Rank #118 / 418
Private / Semi-Private Rooms
Keller Landing
MC
NH
Tuscumbia (South Sheffield) -
109
Facility 109
AL AVG 90
Rank #77 / 245
-
48
Facility 48
AL AVG 36
Rank #138 / 418
Private / Semi-Private Rooms
Brentwood Retirement Community
MC
NH
AL
Muscle Shoals (Jackson Heights) -
123
Facility 123
AL AVG 90
Rank #59 / 245
-
49
Facility 49
AL AVG 36
Rank #125 / 418
Private Rooms
Glenwood Center
MC
NH
Florence (Ana Drive) -
125
Facility 125
AL AVG 90
Rank #56 / 245
-
56
Facility 56
AL AVG 36
Rank #82 / 418
Private / Semi-Private Rooms

Financial Assistance for
Memory Care in Alabama

Cypress Cove Center is located in Muscle Shoals, Alabama.
Here are the financial assistance programs available to residents in Alabama.

Get Financial aid guidance

Elderly and Disabled Waiver

Alabama Medicaid E&D Waiver

Age 65+ or disabled
General Alabama resident, Medicaid-eligible, requires nursing home-level care but can live in community with support.
Income Limits (2025) ~$2,829/month 300% FBR, individual
Asset Limits $2,000 (individual), $3,000 (couple) (excludes home, car).
AL

Must be assessed by a nurse for nursing home-level care need.

Benefits
In-home personal care (4-6 hours/day, e.g., bathing, dressing) Respite care (up to 240 hours/year) Adult day care (~$50/day avg.) Home-delivered meals Case management

Alabama Respite for Caregivers Program

Alabama Respite (via NFCSP)

Age Caregiver of someone 60+ (or with dementia)
General Alabama resident.
Income Limits No strict limit; prioritizes low-income.
Asset Limits Not applicable.
AL

Focus on rural caregivers; limited funding.

Benefits
In-home respite (4-6 hours/day) Adult day care (~$50/day) Short-term facility care (up to 5 days)

SenioRx Prescription Assistance Program

AL SenioRx

Age 55+
General Alabama resident, chronic illness requiring daily medication, not fully covered by other drug plans.
Income Limits ~$3,000/month individual, varies by AAA
Asset Limits Not strictly enforced; income-focused.
AL

High ROI; saved $43.5M for 6,825 participants in FY 2022.

Benefits
Prescription cost reduction (avg. $6,300/year savings per participant) Medication management support

Weatherization Assistance Program (WAP)

AL WAP

Age 60+ priority
General Alabama resident, own or rent home, low-income status.
Income Limits (2025) ~$2,510/month 200% of poverty level, individual
Asset Limits Not applicable; income-driven.
AL

Prioritizes seniors and disabled; limited annual funding.

Benefits
Insulation Weather stripping HVAC repairs (avg. $500-$1,000 in annual energy savings)

Section 202 Supportive Housing for the Elderly

AL Section 202

Age 62+
General Alabama resident, very low income, able to live independently with support.
Income Limits (2025) ~$1,500/month 50% of area median income, individual, varies by county
Asset Limits $10,000 individual, excludes home if owned
AL

High demand in urban areas like Birmingham; limited units statewide.

Benefits
Subsidized rent (30% of income, e.g., $300-$500/month) On-site services (housekeeping, transportation, ~$200/month value)

Alabama CARES Program

AL CARES

Age
General Caregivers of Alabama residents aged 60+ needing assistance with 3+ daily activities; no age limit for caregivers.
Income Limits No strict limit; cost-sharing based on recipient’s income e.g., ~$2,500/month threshold
Asset Limits Not applicable; focus on need.
AL

Prioritizes caregivers with greatest economic/social need; complements respite programs like AL Lifespan Respite.

Benefits
Respite care (up to 10 days/year) Counseling (4-6 sessions/year) Training (2-3 workshops/year) Supplemental supplies (e.g., $200/year avg.)

Frequently Asked Questions about Cypress Cove Center

What neighborhood is Cypress Cove Center in?

Cypress Cove Center is in the Jackson Heights neighborhood.

Is Cypress Cove Center in a walkable area?

Cypress Cove Center has a walk score of 50. Moderately walkable. Some errands can be accomplished on foot, with a mix of nearby amenities.

What is the occupancy rate at Cypress Cove Center?

Cypress Cove Center's occupancy is 87.8%.

Does Cypress Cove Center operate as a for-profit or non-profit?

Cypress Cove Center is registered as a for-profit.

Are there photos of Cypress Cove Center?

Yes — there are 4 photos of Cypress Cove Center in the photo gallery on this page.

What is the address of Cypress Cove Center?

Cypress Cove Center is located at 200 Alabama Ave, Muscle Shoals, AL 35661.

What is the phone number of Cypress Cove Center?

(256) 381-4330 will put you in contact with the team at Cypress Cove Center.

Guides for Better Senior Living

Care Cost Calculator: See Prices in Your Area

Nursing Home Data Explorer

Don’t Wait Too Long: 7 Red Flag Signs Your Parent Needs Assisted Living Now

The True Cost of Assisted Living in 2025 – And How Families Are Paying For It

Understanding Senior Living Costs: Pricing Models, Discounts & Financial Assistance