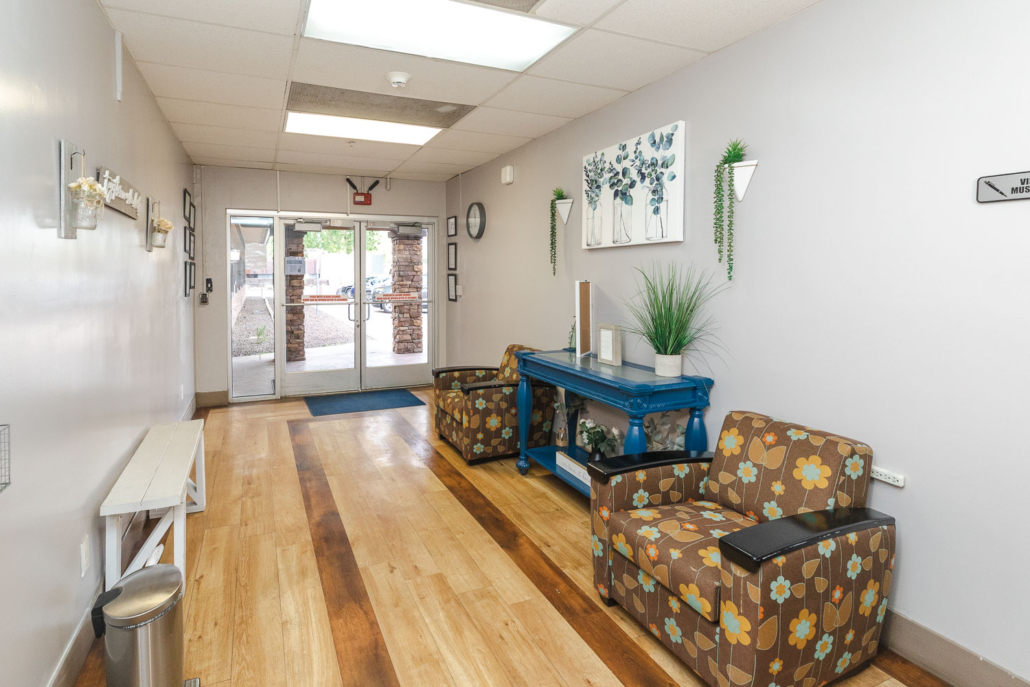
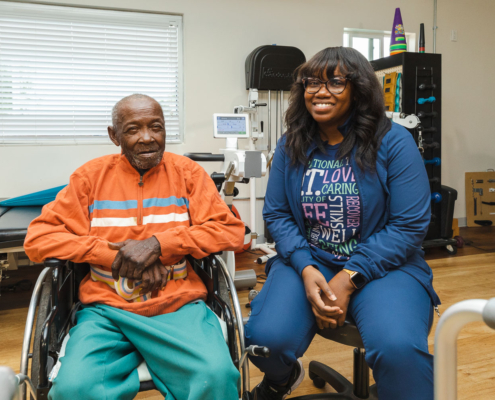
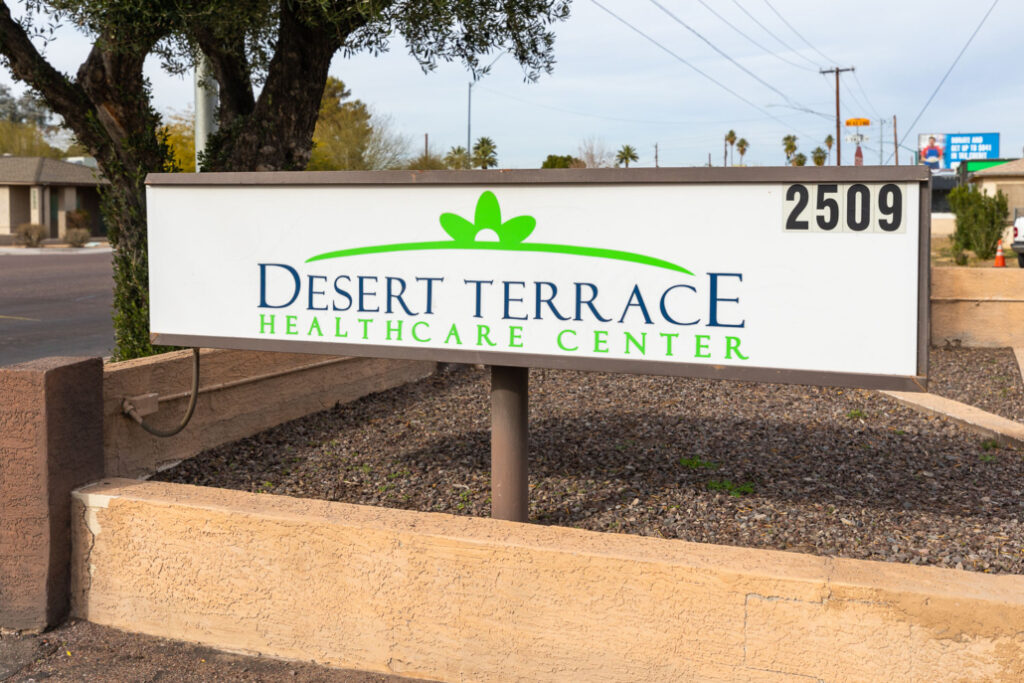
Conveniently set in Phoenix, AZ, Desert Terrace Healthcare Center is a welcoming community that offers excellent short-term rehabilitation and long-term care. The community features a team of reliable caregivers trained to help residents with their rehabilitation and daily needs. They also cater to the needs of those living with Alzheimer’s through their Integrated Cognitive Program and round-the-clock support.
In-house therapists are always available to support residents with their recovery needs or maintain their highest level of functionality. A full range of entertaining and enriching activities are offered daily to help keep everyone busy and happy. Here, residents find a comfortable environment to continue enjoying their desired life.
Measured by Centers for Medicare & Medicaid Services (CMS)
Overall ratingThe Overall CMS Rating combines results from health inspections, staffing levels and quality measures. Health inspections carry the most weight. Staffing and quality scores can increase or decrease the final rating based on performance compared to state and national standards.
3/5
Arizona average: 3.5/5
Health InspectionBased on the results of the facility's three most recent standard inspections and any complaint investigations. CMS reviews the number, scope, and severity of deficiencies, with more recent findings weighted more heavily.
2/5
Arizona average: 2.8/5
StaffingMeasures average nursing staff hours per resident per day, including Registered Nurses (RNs) and total nursing staff. Ratings are adjusted based on the level of care residents require and are compared to state and national benchmarks.
3/5
Arizona average: 3.5/5
Quality MeasuresBased on clinical and physical health indicators reported to CMS, such as hospital readmissions, falls, pressure ulcers, and improvements in mobility. These measures reflect how well residents' health needs are being managed.
5/5
Arizona average: 4.6/5
Nursing care per resident
This shows how many total hours of nursing staff time are available per resident each day. Higher numbers usually mean more staff support.
3h 54m per day
This home provides 7% less nursing time per resident than the Arizona average.
Arizona average: 4h 11m per day
Staffing hours breakdown
Hours of care per resident per day, broken down by staff type. Data from CMS Medicare.
Staff typeFacilityState avgNational avg
Registered Nurse (RN) Registered nurse hours per resident per day.37m per day43m per day41m per day
Nurse Aide Nurse aide hours per resident per day.2h 1m per day2h 22m per day2h 21m per day
Total Nursing (Weekend) Total number of nurse staff hours per resident per day on weekends.3h 7m per day3h 38m per day3h 26m per day
Physical Therapist Physical therapist staff hours per resident per day.4m per day6m per day4m per day
RN (Weekend) Registered nurse hours per resident per day on weekends.29m per day31m per day29m per day
Capacity and availability
Medium-capacity home
Offers a balance of services and community atmosphere.
Total beds108
This home usually has availability
Lower occupancy suggests more openings may be available.
10% of new residents, usually for short-term rehab.
Typical stay24 days
Private pay
37% of new residents, often for short stays.
Typical stay19 days
Medicaid
53% of new residents, often for long-term daily care.
Typical stay2 months
Finances and operations
Privately-owned community
Operated by a business corporation.
Home revenue
$10.3M
Profit
$509.5K
Privately-owned community Operated by a business corporation.
Home revenue
$10,290,313.00
Profit
$509,474.00
Payroll costsThe portion of the home's budget spent on staff, including nurses, caregivers, and other employees who support care and operations.
$5.2M
51% of revenue
Other operating costsAll remaining costs needed to run the home, such as food, utilities, building maintenance, supplies and administrative expenses.
$4.5M
Total costs$9.8M
Tooltip
Certification details
License Number:35014
Owner Name:BANDERA HEALTHCARE LLC
Rural vs. Urban:Urban
County:MARICOPA
Type of Control:Privately-owned community — Operated by a business corporation.
Source: Centers for Medicare & Medicaid Services (CMS) and State data
Who this home usually serves
This view explains the types of residents this home most often serves, based on who is admitted and discharged over time. It reflects patterns, not individual cases.
Admissions
Indicate who is most often coming into the home.
Total709
PERCENTAGES
Medicare10%
Private Pay37%
Medicaid53%
Discharges
Show who is most often leaving the home, and under which coverage.
Total708
PERCENTAGES
Medicare9%
Private Pay38%
Medicaid53%
How we assess these insights
We analyze official CMS data and reported admissions information to understand the types of residents a nursing home most often serves.
This includes
Medicare, Medicaid, and private-pay admissions
Number of nights covered by each payment type
Typical length of stay
How we calculate length of stay
We calculate length of stay separately for each payment type (Medicare, Medicaid and private) by dividing total number of nights by total number of admissions.
What "optimal for" means
The tags you see are guidance, not recommendations. They highlight scenarios where this home's care model, stay length and payer mix may align well with certain needs.
108-bed community
A larger shared setting that may offer more common spaces and organized community services.
Walk Score: 67 / 100
Moderately walkable. Some errands can be accomplished on foot, with a mix of nearby amenities.
BBB Rating: C+ (Not Accredited)
An independent rating from the Better Business Bureau based on factors such as complaint history, transparency, and business practices. How BBB ratings work
How BBB ratings work
BBB ratings provide context about a business’s trust and complaint history. They are not a measure of care quality or regulatory compliance.
Ratings range from A+ (highest) to F (lowest).
What the rating reflects
Complaint history and resolution
Business practices and transparency
Time in operation
About this community
License details
Facility type
Nursing Care Institution
StatusActive
ExpirationJune 30, 2026
Additional licensing details
License number:NCI-237
CMS Certification Number:35014
Qualification:Health Care
Ownership & operating entity
Desert Terrace Healthcare Center is legally operated by Desert Terrace Healthcare Center, and administrated by JUSTIN LEWIS.
Staffing
Key information about the people who lead and staff this community.
Leadership
Contact:Mr. Forrest Peterson, Manager
Care Services
Nursing Services
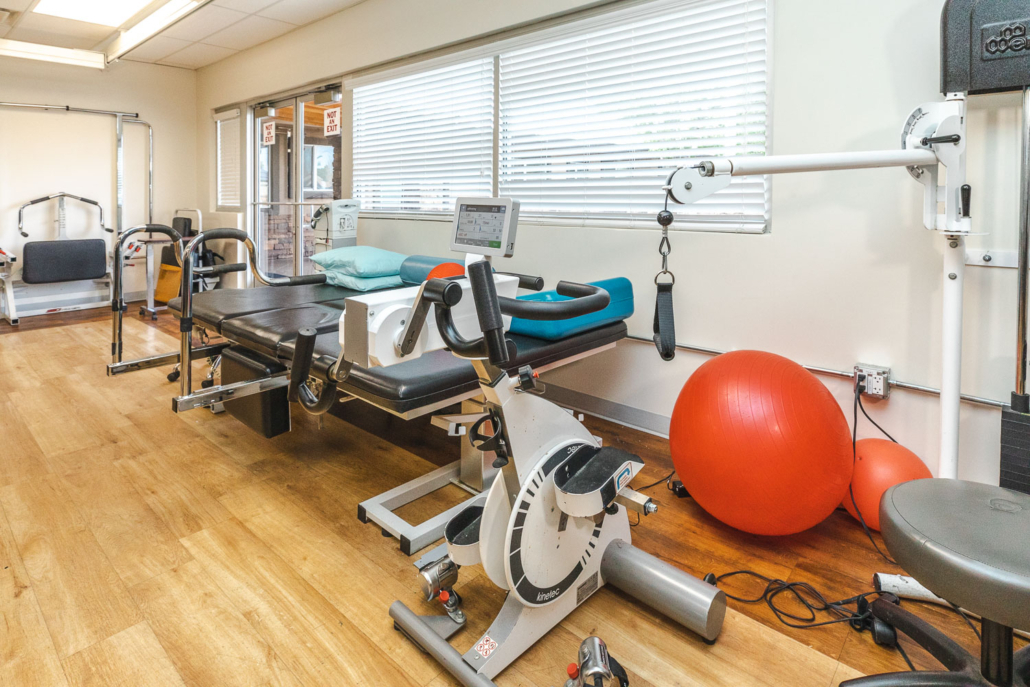
Rehabilitation Services
Skilled Nursing
Licensed Nurses/CNAs
Programs & Activities
Specific Programs
In-house Therapy, Skilled Nursing, Stay Active
What does this home offer?
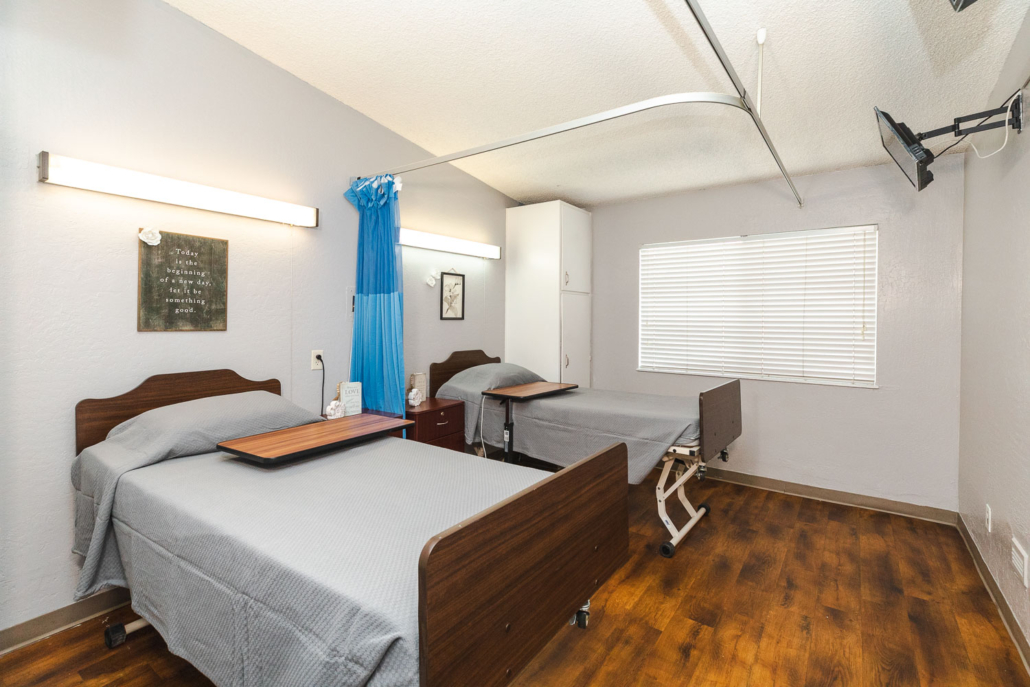
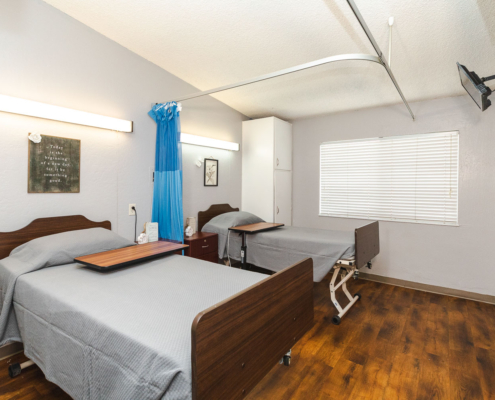
Housing Options: Private / Semi-Private Rooms
Building Type: Single-story
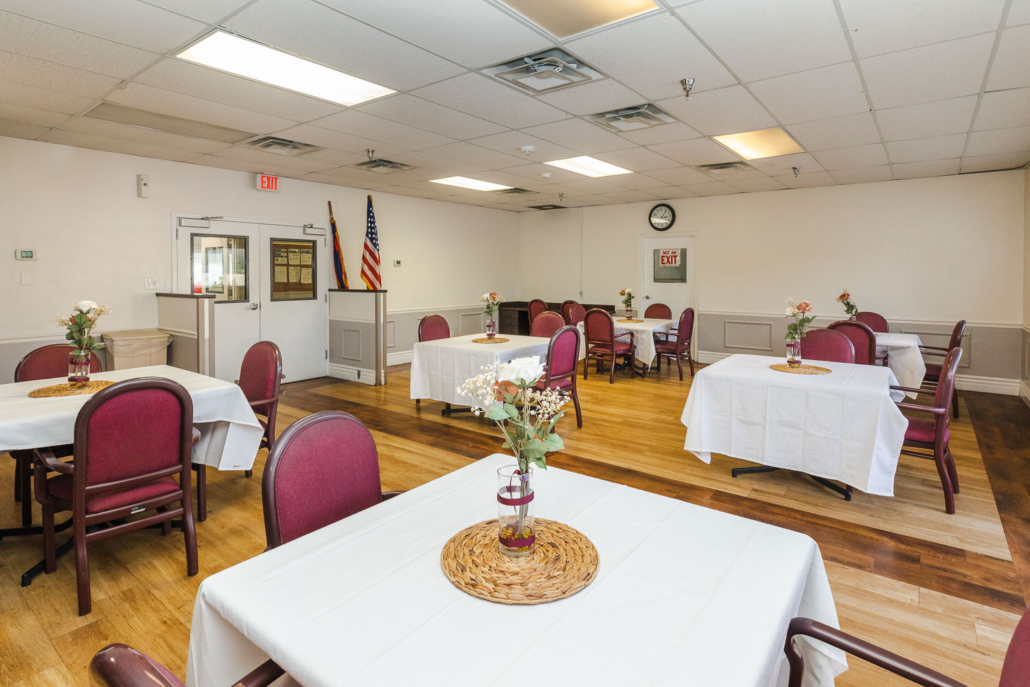
Dining Services
Housekeeping Services
Transportation Services
Recreational Activities
Exercise Programs
Types of Care at Desert Terrace Healthcare Center
Nursing Home
Memory Care
Types of Care
Assisted Living
Definition: Residential care for older adults who need help with activities of daily living (ADLs) such as medication management, bathing, dressing and meals.
Purpose: Support independence while providing daily assistance and limited medical oversight — a step below nursing home care.
Focus: Safety, personal care, social engagement and a community-based lifestyle.
Amenities and Services: Often include:
• Recreational activities
• Housekeeping and laundry
• Transportation
• Meal services
Care Level: 24/7 staff availability with personalized care plans; limited clinical care compared to nursing homes.
Home Care
Home care is a type of care wherein qualified professionals assist with activities of daily living (ADLs), like personal hygiene, meal preparation, and dressing, at home. This type of care provides a wide range of services, including personal care, skilled nursing care, rehabilitation services, and companionship. This is ideal for those looking to stay at home in retirement but needing care and support for ADLs and chronic conditions. Hourly care and live-in care are often provided for flexibility, ensuring older adults receive care tailored to their needs and preferences.
Skilled Nursing
Skilled nursing care is a type of care provided by registered nurses in a medical setting under a physician’s supervision, focusing on intensive medical care and rehabilitation. It is typically provided in hospitals and purposely built skilled nursing communities and healthcare centers, usually aimed at short-term and transitional care.
Nursing Care
Nursing care is usually provided in a nursing home environment by nursing aides and licensed practical nurses. This type of care focuses on helping older adults with activities of daily living (ADLs), like personal hygiene and medication, alongside medical care. Long-term residential care is provided, helping those with complex medical needs, chronic conditions, cognitive, functional, and behavioral issues.
Respite Care
Respite care, also known as short-term stay, allows primary caregivers to rest and have time for themselves by providing care for their loved ones. This type of care is temporary and may range from a few hours to weeks, provided either at home or in a senior care community.
Memory Care
Definition: Specialized residential care for people with memory loss, Alzheimer’s disease or other forms of dementia.
Purpose: Provide a safe, structured environment with trained staff and programs tailored to cognitive impairment.
Focus: Secure settings, enhanced supervision and routines that support memory and reduce stress.
Amenities and Services: Typically include:
• Assistance with ADLs
• Cognitive stimulation and therapeutic activities
• Secure indoor/outdoor spaces
Care Level: Staff specially trained in dementia care with higher caregiver-to-resident ratios.
Independent Living
Definition: A living option typically for those 55 and over, including senior housing, retirement homes, and active adult communities.
Purpose: Ideal for those seeking to live with peers of the same age without needing support for activities of daily living (ADLs) or medical care.
Focus: Emphasizes convenience and recreation, eliminating the hassles of housekeeping and maintenance.
Amenities and Services: Offers a variety of amenities, which may include:
• Spa
• Concierge
• Community gathering spaces
Luxury Levels: Amenities vary depending on the level of luxury provided by the community.
Hospice Care
Focusing on those with life-limiting conditions or terminal illness, hospice care provides physical, emotional, social, and spiritual support. This type of care aims to ease older adults’ discomfort and pain and does not focus on finding a cure. Typically provided with a multidisciplinary team of doctors, nurses, social workers, and hospice aides, in older adults’ preferred setting, may it be at home, hospital, or senior living community. Hospice care provides care for those with a life expectancy estimated at six months or less.
Nursing Home
This type of retirement option focuses on older adults who require advanced healthcare but do not necessarily require hospital care. Nursing homes often provide a wide range of personal care, health care, and skilled nursing, tailored to older adults’ healthcare needs. This is ideal for those who cannot stay at home due to complex healthcare needs but do not need to be in a hospital setting.
Residential Care
A senior living option that focuses on providing support with activities of daily living, including personal hygiene and medication management. However, unlike assisted living, this type of care provides a smaller and more intimate environment, catering to a smaller number of residents. This is ideal for those needing assistance with daily living without extensive medical care and preferring a smaller setting.
Adult Day Care
This type of care provides curated activities for older adults in a non-residential care setting, promoting holistic well-being with health, social, nutritional, and emotional support. Adult day care promotes social interactions in a supervised manner, allowing family caregivers to rest during the day. This is beneficial in terms of preventing loneliness in older adults and providing additional support for family caregivers.
Palliative Care
This type of care focuses on providing comfort, pain relief, and emotional support for those with serious illness. Unlike hospice care, palliative care provides support at any stage of the illness, even alongside curative treatments. This can be provided at home, in nursing homes, in hospitals, and in other senior living communities.
Continuing Care Retirement Communities (CCRC)
Continuing Care Retirement Community (CCRC) is a type of senior living community that provides a wide range of care options in a residential setting. Also known as a life plan community, CCRC often provides independent living, assisted living, memory care, and skilled nursing, allowing older adults to age in place. Due to its comprehensive care, older adults do not have to transfer to communities when the level of care increases.
Key indicators of commitment to quality care and safety.
Ratings
Quality Rating
A
Highest rating
Based on state quality rating data.
Inspection History
In Arizona, the Department of Health Services, Bureau of Long Term Care Licensing performs regular onsite inspections and investigates complaints for all licensed residential and nursing facilities.
Formal expressions of dissatisfaction or concern made by residents, or their families regarding various aspects of the care, services, and environment provided.
Arizona average: 6 complaints
Latest inspection
Date:September 3, 2025
Type:Complaint
Results:No deficiencies
14 violations
Violations indicate regulatory issues. A higher number implies the facility had several areas requiring improvement.
Arizona average: 12 violations
14 deficiencies
Deficiencies indicate regulatory issues. A higher number implies the facility had several areas requiring improvement.
Inspection Report Summary for Desert Terrace Healthcare Center
The most recent inspection on September 3, 2025, found no deficiencies. Earlier inspections showed a pattern of occasional deficiencies primarily related to abuse reporting, quality of care, care planning, health services policies, pharmacy services, and Life Safety Code issues such as fire safety and electrical system maintenance. Complaint investigations were mostly unsubstantiated, with one deficiency cited for abuse reporting in January 2025 and a few others related to care and administrative policies in prior reports. No fines, immediate jeopardy findings, or license actions were listed in the available reports. The overall trend suggests improvement, as recent inspections have consistently found no deficiencies.
Inspection Reports
Loading reports...
Health Inspection History
Inspections
Total health inspections7
Arizona average6.3
Last Health inspection on Jan 2025
Total health citations24
Arizona average23.2
Citations per inspection
3.43
Arizona average3.82
Health citations are formal notices following inspections when they fail to comply with safety and care standards.
20 of 24 citations resulted from standard inspections; and 4 of 24 resulted from complaint investigations.
Breakdown of citation severity (last 3 years)
Critical Health citations0
100% better than Arizona average
Arizona average: 0.1
Serious Health citations0
100% better than Arizona average
Arizona average: 0.6
0 critical citationsArizona average: 0.1
0 serious citationsArizona average: 0.6
23 moderate citationsArizona average: 22.3
1 minor citationArizona average: 0.2
Citations history (last 3 years)
Abuse/Neglect moderate citationIssues related to protecting resident's from harm, including abuse, neglect, or mistreatment.Jan 24, 2025
Corrected
Abuse/Neglect moderate citationIssues related to protecting resident's from harm, including abuse, neglect, or mistreatment.Oct 10, 2024
Corrected
Quality of Care moderate citationIssues related to how well residents receive appropriate treatment and support for their medical and daily care needs.Jul 03, 2024
Corrected
Pharmacy moderate citationIssues related to medication management, including how drugs are stored, administered, and monitored.Jan 16, 2024
Corrected
Quality of Care moderate citationIssues related to how well residents receive appropriate treatment and support for their medical and daily care needs.Oct 20, 2023
Corrected
Nursing Services minor citationIssues related to the availability and quality of nursing staff and the care they provide.Sep 09, 2022
Corrected
Pharmacy moderate citationIssues related to medication management, including how drugs are stored, administered, and monitored.Sep 09, 2022
Corrected
Pharmacy moderate citationIssues related to medication management, including how drugs are stored, administered, and monitored.Sep 09, 2022
Corrected
Quality of Care moderate citationIssues related to how well residents receive appropriate treatment and support for their medical and daily care needs.Sep 09, 2022
Corrected
Quality of Care moderate citationIssues related to how well residents receive appropriate treatment and support for their medical and daily care needs.Sep 09, 2022
Corrected
Quality of Care moderate citationIssues related to how well residents receive appropriate treatment and support for their medical and daily care needs.Sep 09, 2022
Corrected
Quality of Care moderate citationIssues related to how well residents receive appropriate treatment and support for their medical and daily care needs.Sep 09, 2022
Corrected
Quality of Care moderate citationIssues related to how well residents receive appropriate treatment and support for their medical and daily care needs.Sep 09, 2022
Corrected
Care Planning moderate citationIssues related to creating and updating personalized care plans for residents based on their needs and conditions.Sep 09, 2022
Corrected
Resident Rights moderate citationIssues related to resident's rights, including dignity, privacy, and the ability to make decisions about their care.Sep 09, 2022
Corrected
Resident Rights moderate citationIssues related to resident's rights, including dignity, privacy, and the ability to make decisions about their care.Sep 09, 2022
Corrected
Infection Control moderate citationIssues related to preventing and controlling infections, including hygiene practices and safety protocols.Apr 08, 2021
Corrected
Nursing Services moderate citationIssues related to the availability and quality of nursing staff and the care they provide.Apr 08, 2021
Corrected
Quality of Care moderate citationIssues related to how well residents receive appropriate treatment and support for their medical and daily care needs.Apr 08, 2021
Corrected
Quality of Care moderate citationIssues related to how well residents receive appropriate treatment and support for their medical and daily care needs.Apr 08, 2021
Corrected
Quality of Care moderate citationIssues related to how well residents receive appropriate treatment and support for their medical and daily care needs.Apr 08, 2021
Corrected
Care Planning moderate citationIssues related to creating and updating personalized care plans for residents based on their needs and conditions.Apr 08, 2021
Corrected
Resident Rights moderate citationIssues related to resident's rights, including dignity, privacy, and the ability to make decisions about their care.Apr 08, 2021
Corrected
Resident Rights moderate citationIssues related to resident's rights, including dignity, privacy, and the ability to make decisions about their care.Apr 08, 2021
Corrected
Compare Nursing Homes around Maricopa CountyThe information below is reported by the Arizona Department of Health Services, Bureau of Long Term Care Licensing.
5 facilities compared · CMS & AZ Dept. of Health data · Updated Mar 2026
Memory CareSecured, specialized care for people living with Alzheimer's or dementia. Staff trained in cognitive impairment, with higher staff-to-resident ratios and an environment designed to reduce confusion and wandering risk.
NH
Nursing HomeLicensed facility providing 24/7 skilled nursing care for residents with complex, ongoing medical needs. Staffed by RNs, LPNs, and CNAs. Inspected and star-rated annually by CMS. Accepts Medicare (short-term rehab) and Medicaid (long-term care).
Assisted LivingA licensed, long-term care setting for seniors or individuals with disabilities who need help with daily activities — like bathing, dressing, and medication management — but not 24-hour skilled nursing. Offers housing, meals, and around-the-clock support while aiming to maximize resident independence.
MC
Memory CareSecured, specialized care for people living with Alzheimer's or dementia. Staff trained in cognitive impairment, with higher staff-to-resident ratios and an environment designed to reduce confusion and wandering risk.
NH
Nursing HomeLicensed facility providing 24/7 skilled nursing care for residents with complex, ongoing medical needs. Staffed by RNs, LPNs, and CNAs. Inspected and star-rated annually by CMS. Accepts Medicare (short-term rehab) and Medicaid (long-term care).
Assisted LivingA licensed, long-term care setting for seniors or individuals with disabilities who need help with daily activities — like bathing, dressing, and medication management — but not 24-hour skilled nursing. Offers housing, meals, and around-the-clock support while aiming to maximize resident independence.
IL
Independent LivingLifestyle-focused communities for older adults offering dining, activities, and transportation with minimal personal care. Best for active, independent seniors who want community without medical support.
NH
Nursing HomeLicensed facility providing 24/7 skilled nursing care for residents with complex, ongoing medical needs. Staffed by RNs, LPNs, and CNAs. Inspected and star-rated annually by CMS. Accepts Medicare (short-term rehab) and Medicaid (long-term care).
Source: CMS Long-Term Care Facility Characteristics
(Data as of Jan 2026)
Total census
74 residents
Residents by payment source
Medicare
3 residents (4.1%)
Medicaid
56 residents (75.7%)
Private pay or other
15 residents (20.3%)
Programs & Services
Residents' Group
Residents meet regularly to discuss policies, care quality, and activities
Active Resident Council
Organized group of residents that meets regularly to discuss facility policies, quality of life, and activities.
Quality of care over time
These measures show how residents usually do over time at this home, based on health outcomes and preventive care.
High-risk clinical events scoreA composite score based on pressure ulcers, falls with injury, weight loss, walking ability decline, and activities of daily living decline.8.6
13% worse than Arizona average
Arizona average: 7.6
Functional decline scoreA composite score based on activities of daily living decline, walking ability decline, and incontinence.19.8
23% worse than Arizona average
Arizona average: 16.1
Long-stay resident measures
Significantly above averageArizona avg: 3.7CMS star rating based on long-stay quality measure performance. 5 stars = significantly above average, 1 star = significantly below average.
Need for Help with Daily Activities Increased Percent of long-stay residents whose need for help with daily activities has increased10.2%
10% better than Arizona average
Arizona average: 11.2%
Walking Ability Worsened Percent of long-stay residents whose ability to move independently worsened17.1%
8% worse than Arizona average
Arizona average: 15.8%
Low Risk Residents with Bowel/Bladder Incontinence Percent of low risk long-stay residents who lose control of their bowels or bladder32.2%
54% worse than Arizona average
Arizona average: 20.8%
Falls with Major Injury Percent of long-stay residents experiencing one or more falls with major injury1.4%
36% better than Arizona average
Arizona average: 2.1%
High Risk Residents with Pressure Ulcers Percent of long-stay high risk residents with pressure ulcers5.6%
11% worse than Arizona average
Arizona average: 5.1%
Urinary Tract Infection Percent of long-stay residents with a urinary tract infection0.0%
100% better than Arizona average
Arizona average: 1.3%
Lost Too Much Weight Percent of long-stay residents who lose too much weight8.8%
62% worse than Arizona average
Arizona average: 5.4%
Depressive Symptoms Percent of long-stay residents who have depressive symptoms3.1%
30% better than Arizona average
Arizona average: 4.5%
Antipsychotic Use Percent of long-stay residents who received an antipsychotic medication8.6%
16% better than Arizona average
Arizona average: 10.3%
Pneumococcal Vaccine Percent of long-stay residents assessed and appropriately given the pneumococcal vaccine81.6%
16% worse than Arizona average
Arizona average: 97.2%
Influenza Vaccine Percent of long-stay residents assessed and appropriately given the seasonal influenza vaccine92.4%
In line with Arizona average
Arizona average: 94.6%
Short-stay resident measures
AverageArizona avg: 4.3CMS star rating based on short-stay quality measure performance. 5 stars = much above average, 1 star = much below average.
Pneumococcal VaccinePercent of short-stay residents assessed and appropriately given the pneumococcal vaccine81.8%
11% worse than Arizona average
Arizona average: 91.5%
Antipsychotic medication increasePercent of short-stay residents who newly received an antipsychotic medication0.0%
100% better than Arizona average
Arizona average: 1.0%
Influenza VaccinePercent of short-stay residents assessed and appropriately given the seasonal influenza vaccine76.7%
12% worse than Arizona average
Arizona average: 87.3%
Re-hospitalized after SNF stayPercentage of short-stay residents who were re-hospitalized after their nursing home admission.42.2%
72% worse than Arizona average
Arizona average: 24.6%
Emergency department visitsPercentage of short-stay residents who had an outpatient emergency department visit.23.8%
122% worse than Arizona average
Arizona average: 10.7%
Falls with major injuryPercentage of SNF residents who experience falls with major injury during their stay.0.0%
100% better than Arizona average
Arizona average: 0.8%
Ability to care for self at dischargePercentage of residents at or above expected ability to care for themselves at discharge.52.0%
In line with Arizona average
Arizona average: 53.7%
Successful return to home or communityRate of successful return to home or community from a skilled nursing facility.53.1%
5% better than Arizona average
Arizona average: 50.6%
Financial Trends
Historical financial and operational data for Desert Terrace Healthcare Center based on CMS SNF Cost Reports.
Occupancy Rate81.3%↑ 1.3pp vs 2022
Net Income$509,474↓ ~$484K vs 2022
Total Payroll$6,462,328↑ ~$426K vs 2022
Profit Margin5.0%↓ 4.6pp vs 2022
Loading trend charts...
Could not load trend charts.
Occupancy Rate
Financial Performance
Payroll & Labor Costs
SalariesFixed annual pay for full-time employees.
Contract LaborPay for temporary or external contractors hired.
Wage CostsHourly pay for staff who are paid by the hour.