Springdale Village
Nursing Home, Assisted Living & Independent Living · Mesa, AZ
CMS overall rating Info CMS (the Centers for Medicare & Medicaid Services) is the federal agency that rates nursing home quality. Its Overall Rating runs from 1 to 5 stars, combining health inspections, staffing, and quality measures, with inspections weighted most heavily.

Springdale Village

Nursing Home, Assisted Living & Independent Living · Mesa, AZ
CMS overall rating Info CMS (the Centers for Medicare & Medicaid Services) is the federal agency that rates nursing home quality. Its Overall Rating runs from 1 to 5 stars, combining health inspections, staffing, and quality measures, with inspections weighted most heavily.
Calculator: See prices in your area
Springdale Village accepts Medicare, Medicaid, and private pay.

Overview of Springdale Village

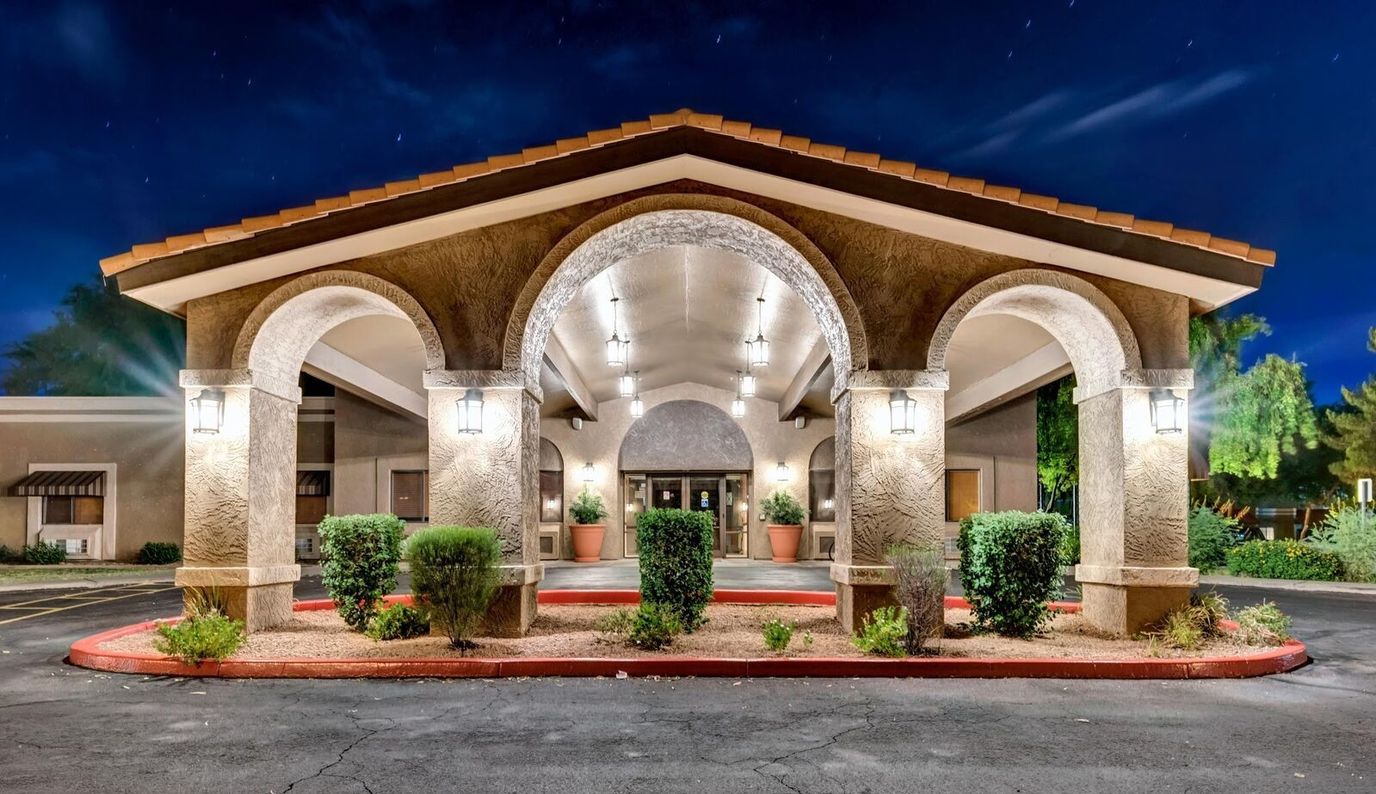
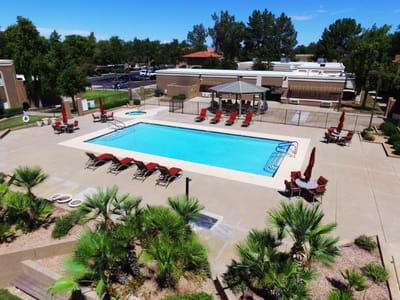
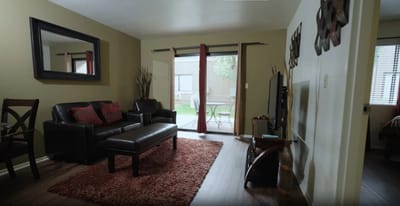
Experience tailored care with Springdale Village, an excellent community in Mesa, AZ that offers an array of care services for residents’ individual needs. By offering access to independent living, assisted living, and long-term care, the community ensures residents are well cared for throughout their journey. Their excellent care team is awake 24/7 to assist with daily activities and other things residents may need help with.

Active and dynamic residents find it appealing with an array of recreational amenities like a heated pool and fitness center available to enjoy. Residents here also enjoy the convenience of having on-site medical personnel and a team that handles maintenance and housekeeping services. With a range of services tailored to various needs, residents here enjoy a comfortable and well-supported life amidst a nurturing environment.

(480) 482-7300

Quality ratings

Measured by Centers for Medicare & Medicaid Services (CMS)

Overall rating Info The Overall CMS Rating combines results from health inspections, staffing levels and quality measures. Health inspections carry the most weight. Staffing and quality scores can increase or decrease the final rating based on performance compared to state and national standards.
▼ 9.5% Below AZ avg. ▼ 9.5% Below AZ avg.AZ average: 3.3Click the badge to see the full State ranking.Click here to see the full State ranking.
Health Inspection Info Based on the results of the facility's three most recent standard inspections and any complaint investigations. CMS reviews the number, scope, and severity of deficiencies, with more recent findings weighted more heavily.
▼ 27.8% Below AZ avg. ▼ 27.8% Below AZ avg.AZ average: 2.8Click the badge to see the full State ranking.Click here to see the full State ranking.
Staffing Info Measures average nursing staff hours per resident per day, including Registered Nurses (RNs) and total nursing staff. Ratings are adjusted based on the level of care residents require and are compared to state and national benchmarks.
▼ 34.1% Below AZ avg. ▼ 34.1% Below AZ avg.AZ average: 3.0Click the badge to see the full State ranking.Click here to see the full State ranking.
Quality Measures Info Based on clinical and physical health indicators reported to CMS, such as hospital readmissions, falls, pressure ulcers, and improvements in mobility. These measures reflect how well residents' health needs are being managed.
▲ 10.8% Above AZ avg. ▲ 10.8% Above AZ avg.AZ average: 4.5Click the badge to see the full State ranking.Click here to see the full State ranking.

Staffing hours breakdown

Info Daily nursing hours per resident by staff type, reported to CMS. Higher is generally better — compare this facility to state and national averages to see where staffing stands.

Hours per resident per day — compared to Arizona state averages

Total nursing care / resident Info This home is ranked 19th out of 71 homes in Arizona for nurse hours. Total adjusted nursing hours per resident per day, combining RN, LPN, and aide time. CMS adjusts this for case-mix so facilities can be fairly compared.
4h 16m per day
Rank #19 / 71Nurse hours — State benchmarkedThis home is ranked 19th out of 71 homes in Arizona. Shows adjusted nurse hours per resident per day benchmarked to the Arizona average, with a ranking across 71 Arizona facilities. More hours mean more direct care. The national average is about 3.5 hrs; below 3.0 is a red flag.Rankings are based only on facilities in Arizona that report data for that category. Facilities without available data are excluded from the ranking.Click the rank badge to see the full State ranking.Click here to see the full State ranking.
This facility Arizona avg (4h 4m per day)
vs Arizona avg
+5%

3 of 6 metrics below state avg

Standout metric Physical Therapist is +16% above state avg
Staff typeHours / Day / Residentvs state avg
Registered Nurse (RN) Info RNs hold the highest nursing license and can assess residents, interpret test results, and direct care plans. More RN hours per day often signals stronger clinical oversight and faster response to health changes. 45m per day ▲ 4% State avg: 43m per day · National avg: 41m per day
LPN / LVN Info Licensed Practical Nurses (LPNs) or Licensed Vocational Nurses (LVNs) deliver routine hands-on care — medication administration, wound dressing, and monitoring vital signs. They work under RN supervision and make up a large share of daily bedside care. 1h 3m per day ■ Avg State avg: 1h 3m per day · National avg: 52m per day
Nurse Aide Info Certified Nurse Aides (CNAs) provide the most direct day-to-day assistance: bathing, dressing, feeding, and mobility. Nurse aide hours are typically the largest staffing category and directly affect residents' quality of life. 1h 46m per day ▼ 25% State avg: 2h 22m per day · National avg: 2h 21m per day
Weekend Total Nursing Info Combined nursing hours (RN + LPN + Nurse Aide) per resident per day on weekends. Staffing often drops on weekends — this figure reveals whether the facility maintains adequate coverage outside of weekday hours. 3h 10m per day ▼ 13% State avg: 3h 38m per day · National avg: 3h 26m per day
Physical Therapist Info Hours per resident per day provided by licensed Physical Therapists (PTs) or PT Assistants. PT services help residents recover mobility after injury or illness and are especially important for post-acute (short-stay) rehabilitation. 7m per day ▲ 16% State avg: 6m per day · National avg: 4m per day
Weekend RN Info Registered nurse hours specifically on weekends. Facilities sometimes reduce RN presence on Saturdays and Sundays — a low weekend RN figure compared to weekday hours can indicate reduced clinical oversight when most administrative staff are absent. 16m per day ▼ 48% State avg: 31m per day · National avg: 29m per day

Capacity and availability

Avg. Length of Stay
43 days
Bed community size
82-bed community
A larger shared setting that may offer more common spaces and organized community services.
Years in operation
9 years in operation
An established community with some operational experience and growing routines.
Walk Score
Walk Score: 29 / 100
Somewhat walkable. A few nearby services may be reachable on foot, but most trips require transportation.

About this community

Occupancy

Occupancy rate
54%
Rank #57 / 76Occupancy rate — State benchmarkedThis home is ranked 57th out of 76 homes in Arizona. Shows this facility's occupancy rate versus the Arizona average, with its Statewide rank out of 76. Higher occupancy signals strong local demand and financial stability.Rankings are based only on facilities in Arizona that report data for that category. Facilities without available data are excluded from the ranking.Click the rank badge to see the full State ranking.Click here to see the full State ranking.
Lower than the Arizona average: 72.7%
Occupied beds
45 / 82
Average occupied beds in Arizona homes 84 beds

License Details

Facility TypeAssisted Living Center
StatusActive
IssuanceMarch 28, 2017
ExpirationFebruary 28, 2027
License NumberAL10288C
QualificationHealth Care

Ownership & Operating Entity

Springdale Village is administered by Inge G Duran.

OwnerALLEGIANT HEALTHCARE AL, LLC

Staffing

Key information about the people who lead and staff this community.

Leadership

ContactJaqueline Harris

Contact Springdale Village

Inspection History

In Arizona, the Department of Health Services, Bureau of Long Term Care Licensing performs regular onsite inspections and investigates complaints for all licensed residential and nursing facilities.

Since 2021 · 5 years of data 29 deficiencies 4 complaints 5 inspections
Inspection Score Info A composite 0–100 score combining this facility's inspections, citations, complaints, and enforcement actions relative to the Arizona state average. The score below shows how many points this facility sits above or below the typical Arizona nursing home score (the benchmark); higher is better.

11 points below the Arizona average for nursing homes (82/100)

Rank #31 / 53 in Arizona Inspection Score — State benchmarked This home is ranked 31st out of 53 homes in Arizona. Shows this facility's inspection score compared to the Arizona average among 53 comparable communities in the ranking pool. Rankings are based only on facilities in Arizona that report data for that category. Facilities without available data are excluded from the ranking. Inspection score: 71 out of 100. Letter grade C-. 11 points below the Arizona average for nursing homes (82/100)

Inspection Scorecard Info This scorecard compares key inspection, citation, and complaint metrics at this facility against the Arizona state average. Metrics rated ≥15% worse than average are highlighted in red; those ≥15% better are highlighted in green.

Since 2021 vs. Arizona state average
Overall vs. AZ average 4 Worse Metrics worse than Arizona average:
• Total deficiencies (222% above)
• Deficiencies per year (222% above)
• Deficiencies per inspection (222% above)
• Enforcement actions (456% above)
1 At Avg Metrics at Arizona average:
• Total inspections (at AZ avg)
2 Better Metrics better than Arizona average:
• Total complaints (33% below)
• Complaints per year (33% below)
Latest Inspection October 22, 2025 Complaint 1 deficiencies

Deficiencies Info Deficiencies are formal regulatory issues recorded during state inspections.

This FacilityAZ Averagevs. AZ Avg
Total deficiencies Info Formal regulatory issues recorded by inspectors across all inspection types. 299 This facility has 222% more total deficiencies than a typical Arizona nursing home (29 vs. AZ avg 9).↑ 222% worse Rank #487 / 500 Total deficiencies — State benchmarked This home is ranked 487th out of 500 homes in Arizona. Shows this facility's deficiencies compared to the Arizona average among 500 comparable communities in the ranking pool. Rankings are based only on facilities in Arizona that report data for that category. Facilities without available data are excluded from the ranking.
Deficiencies per year Info Average deficiencies per year since 2021. 5.81.8 This facility has 222% more deficiencies per year than a typical Arizona nursing home (5.8 vs. AZ avg 1.8).↑ 222% worse
Deficiencies per inspection Info Average deficiencies per inspection. 5.81.8 This facility has 222% more deficiencies per inspection than a typical Arizona nursing home (5.8 vs. AZ avg 1.8).↑ 222% worse Rank #496 / 500 Deficiencies per inspection — State benchmarked This home is ranked 496th out of 500 homes in Arizona. Shows this facility's deficiencies per inspection compared to the Arizona average among 500 comparable communities in the ranking pool. Rankings are based only on facilities in Arizona that report data for that category. Facilities without available data are excluded from the ranking.
Enforcement actions Info Formal penalties or interventions imposed by Arizona regulators — directed plans of correction, civil monetary penalties, denial of payment, or appointment of temporary management. 50.9 This facility has 456% more enforcement actions than a typical Arizona nursing home (5 vs. AZ avg 0.9).↑ 456% worse

Inspections Info State inspections evaluate whether the facility meets health and safety standards.

This FacilityAZ Averagevs. AZ Avg
Total inspections Info Combined count of all routine and focused inspections. Excludes complaint investigations. 55 This facility has total inspections in line with the Arizona average (5 vs. AZ avg 5).— At avg

Complaints & Investigations Info Complaints are formal concerns filed by residents, families, or staff. Investigations are on-site follow-ups.

This FacilityAZ Averagevs. AZ Avg
Total complaints Info Formal expressions of concern made by residents, families, or staff. 46 This facility has 33% fewer total complaints than a typical Arizona nursing home (4 vs. AZ avg 6).↓ 33% better Rank #350 / 500 Total complaints — State benchmarked This home is ranked 350th out of 500 homes in Arizona. Shows this facility's complaint-related visits compared to the Arizona average among 500 comparable communities in the ranking pool. Rankings are based only on facilities in Arizona that report data for that category. Facilities without available data are excluded from the ranking.
Complaints per year Info Average complaints per year since 2021. 0.81.2 This facility has 33% fewer complaints per year than a typical Arizona nursing home (0.8 vs. AZ avg 1.2).↓ 33% better

Inspection Reports Summary Info An editor-reviewed summary of the themes and findings across this facility's recent inspection reports.

  • The most recent inspection on October 22, 2025, found one environmental deficiency that was corrected after the inspection.
  • The April 10, 2025 complaint investigation substantiated six deficiencies including medication errors, failure to notify families after condition changes, incomplete care plans, and inadequate elopement supervision.
  • The facility was fined $1,000 in February 2025 for infection control, care planning, and cleanliness failures, reflecting ongoing issues with health and safety compliance.

Health Inspection History

Inspections since 2021
Total health inspections 6

Arizona average 6.3


Last Health inspection on Apr 2025

Total health citations
28 Rank #48 / 75Health citations — State benchmarkedThis home is ranked 48th out of 75 homes in Arizona. Shows this facility's total health deficiency citations benchmarked to the Arizona State average, with a ranking across all 75 AZ facilities. Lower citation counts earn a better rank.Rankings are based only on facilities in Arizona that report data for that category. Facilities without available data are excluded from the ranking.Click the rank badge to see the full State ranking.Click here to see the full State ranking.

Arizona average 23.2

Citations per inspection
4.67 Rank #51 / 75Citations per inspection — State benchmarkedThis home is ranked 51st out of 75 homes in Arizona. Shows average deficiency citations per CMS inspection for this facility versus the Arizona mean across 75 facilities with citation data. Lower is better.Rankings are based only on facilities in Arizona that report data for that category. Facilities without available data are excluded from the ranking.Click the rank badge to see the full State ranking.Click here to see the full State ranking.

Arizona average 3.82


Health citations are formal notices following inspections when they fail to comply with safety and care standards.

19 of 28 citations resulted from standard inspections; 8 of 28 resulted from complaint investigations; and 1 of 28 came from combined inspections (standard and complaint).

Breakdown of citation severity (last 5 years)
Critical health citations
0
100% better than Arizona average

Arizona average: 0.1


Serious health citations
0
100% better than Arizona average

Arizona average: 0.6

0 critical citations Arizona average: 0.1

0 serious citations Arizona average: 0.6

28 moderate citations Arizona average: 22.3

0 minor citations Arizona average: 0.2
Citations history (last 5 years)
Quality of Care moderate citation Apr 10, 2025
Corrected

Quality of Care moderate citation Apr 10, 2025
Corrected

Care Planning moderate citation Apr 10, 2025
Corrected

Care Planning moderate citation Apr 10, 2025
Corrected

Staffing Data

Reporting period: October 1 – December 31, 2025 (Q4 2025). Source: CMS Payroll-Based Journal report.

Total staff 101
Employees 101
Contractors 0
Staff to resident ratio 10.10 : 1
461% more staff per resident than Arizona average
Arizona average ratio: 1.80 : 1 Arizona average ratio: 1.80 : 1See full Arizona ranking
Avg staff/day 24
Average shift 8.4 hours
0% compared with Arizona average
Arizona average: 8.5 hours Arizona average shift: 8.5 hoursSee full Arizona ranking
Total staff hours (quarter) 18,651

Nursing staff breakdown

Q4 2025 · Oct 1 – Dec 31 More info This data comes from the CMS Payroll-Based Journal report covering October 1 – December 31, 2025.
Registered Nurse

Manages medical care and health needs.

RN Staff Info All 12 RN Staff are full-time employees. No contractors work on this role. 12
Average shift length Info Average shift length. Calculated as total hours divided by days worked and average staff per day. 8.5 hours
Licensed Practical Nurse

Assists with medical care and medications.

LPN Staff Info All 26 LPN Staff are full-time employees. No contractors work on this role. 26
Average shift length Info Average shift length. Calculated as total hours divided by days worked and average staff per day. 9.5 hours
Certified Nursing Assistant

Helps with daily care and mobility.

CNA Staff Info All 35 CNA Staff are full-time employees. No contractors work on this role. 35
Average shift length Info Average shift length. Calculated as total hours divided by days worked and average staff per day. 9.2 hours

Contractor staffing

Q4 2025 · Oct 1 – Dec 31 More info This data comes from the CMS Payroll-Based Journal report covering October 1 – December 31, 2025.
Total hours from contractors 0% — all staff are direct employees this quarter

Staff by category

Q4 2025 · Oct 1 – Dec 31 More info This data comes from the CMS Payroll-Based Journal report covering October 1 – December 31, 2025.
Certified Nursing Assistant350356,65392100%9.2
Licensed Practical Nurse260263,84592100%9.5
Dental Services Staff5051,8388896%7.9
Registered Nurse120121,5909098%8.5
Physical Therapy Assistant3031,1176874%7.3
Clinical Nurse Specialist4046726672%7.3
Administrator1015286672%8
Nurse Practitioner1015286773%7.9
Respiratory Therapy Technician2024346470%6.8
Speech Language Pathologist4043996267%6.1
Dietitian1013945661%7
Qualified Social Worker3033255560%5.5
Physical Therapy Aide1012185560%4
RN Director of Nursing2021031011%10.3
Occupational Therapy Aide101833%2.6
35 Certified Nursing Assistant
% of Days 100%
26 Licensed Practical Nurse
% of Days 100%
5 Dental Services Staff
% of Days 96%
12 Registered Nurse
% of Days 98%
3 Physical Therapy Assistant
% of Days 74%
4 Clinical Nurse Specialist
% of Days 72%
1 Administrator
% of Days 72%
1 Nurse Practitioner
% of Days 73%
2 Respiratory Therapy Technician
% of Days 70%
4 Speech Language Pathologist
% of Days 67%
1 Dietitian
% of Days 61%
3 Qualified Social Worker
% of Days 60%
1 Physical Therapy Aide
% of Days 60%
2 RN Director of Nursing
% of Days 11%
1 Occupational Therapy Aide
% of Days 3%

Penalties and fines

Federal penalties imposed by CMS for regulatory violations, including civil money penalties (fines) and denials of payment for new Medicare/Medicaid admissions.

Source: CMS Penalties Database

No penalties in the past 3 years

No civil money penalties or payment denials were reported in the last 3 years.

Quality of care over time

These measures show how residents usually do over time at this home, based on health outcomes and preventive care.

High-risk clinical events score Info A composite score based on pressure ulcers, falls with injury, weight loss, walking ability decline, and activities of daily living decline. 4.4
42% better than Arizona average

Arizona average: 7.6

Functional decline score Info A composite score based on activities of daily living decline, walking ability decline, and incontinence. 20.6
28% worse than Arizona average

Arizona average: 16.1

Long-stay resident measures
Above average Info CMS star rating based on long-stay quality measure performance. 5 stars = significantly above average, 1 star = significantly below average.
Need for Help with Daily Activities Increased Info Percent of long-stay residents whose need for help with daily activities has increased 13.6%
21% worse than Arizona average

Arizona average: 11.2%

Low Risk Residents with Bowel/Bladder Incontinence Info Percent of low risk long-stay residents who lose control of their bowels or bladder 27.5%
32% worse than Arizona average

Arizona average: 20.8%

Falls with Major Injury Info Percent of long-stay residents experiencing one or more falls with major injury 0.0%
100% better than Arizona average

Arizona average: 2.1%

High Risk Residents with Pressure Ulcers Info Percent of long-stay high risk residents with pressure ulcers 3.9%
24% better than Arizona average

Arizona average: 5.1%

Urinary Tract Infection Info Percent of long-stay residents with a urinary tract infection 0.0%
100% better than Arizona average

Arizona average: 1.3%

Lost Too Much Weight Info Percent of long-stay residents who lose too much weight 0.0%
100% better than Arizona average

Arizona average: 5.4%

Depressive Symptoms Info Percent of long-stay residents who have depressive symptoms 4.7%
In line with Arizona average

Arizona average: 4.5%

Antipsychotic Use Info Percent of long-stay residents who received an antipsychotic medication 2.1%
80% better than Arizona average

Arizona average: 10.3%

Pneumococcal Vaccine Info Percent of long-stay residents assessed and appropriately given the pneumococcal vaccine 100.0%
In line with Arizona average

Arizona average: 97.2%

Short-stay resident measures
Pneumococcal Vaccine Info Percent of short-stay residents assessed and appropriately given the pneumococcal vaccine 72.4%
21% worse than Arizona average

Arizona average: 91.5%

Antipsychotic medication increase Info Percent of short-stay residents who newly received an antipsychotic medication 2.2%
112% worse than Arizona average

Arizona average: 1.0%

Influenza Vaccine Info Percent of short-stay residents assessed and appropriately given the seasonal influenza vaccine 67.2%
23% worse than Arizona average

Arizona average: 87.3%

Successful return to home or community Info Rate of successful return to home or community from a skilled nursing facility. 53.5%
6% better than Arizona average

Arizona average: 50.6%

Breakdown by payment type

Medicare

7% of new residents, usually for short-term rehab.

Typical stay 28 days

Private pay

51% of new residents, often for short stays.

Typical stay 23 days

Medicaid

43% of new residents, often for long-term daily care.

Typical stay 2 - 3 months

Facility Characteristics

Source: CMS Long-Term Care Facility Characteristics (Data as of Jan 2026)

Total residents 10
Medicaid
10
100% of residents
Programs & Services
Residents Group

Residents meet regularly to discuss policies, care quality, and activities

CCRC

Part of a Continuing Care Retirement Community offering multiple care levels

Active Resident Council

Organized group of residents that meets regularly to discuss facility policies, quality of life, and activities.

Finances and operations

Based on CMS SNF Cost Report for fiscal year ending in 12/2023.

Privately-owned community
Operated by a single business entity.
Net patient revenue Info Net patient revenue — what the home actually collects for resident care, after contractual allowances, bad debt and discounts are subtracted from its gross charges (CMS cost report, Worksheet G-3). It covers resident care only; money the home earns from other sources is shown separately as "Other income."
$8.1M
Net patient income Info Net patient income: net patient revenue minus the home's total operating expenses. A positive figure means it earns more from resident care than it spends to deliver it; a negative figure means the opposite. It excludes non-operating "other income."
-$1.1M
Privately-owned community Operated by a single business entity.
Net patient revenue Info Net patient revenue — what the home actually collects for resident care, after contractual allowances, bad debt and discounts are subtracted from its gross charges (CMS cost report, Worksheet G-3). It covers resident care only; money the home earns from other sources is shown separately as "Other income."
$8.1M Rank #62 / 79Revenue — State benchmarkedThis home is ranked 62nd out of 79 homes in Arizona. Shows this facility's annual revenue compared to the Arizona average. Higher revenue generally means more resources for staffing and capital — read alongside Payroll %.Rankings are based only on facilities in Arizona that report data for that category. Facilities without available data are excluded from the ranking.Click the rank badge to see the full State ranking.Click here to see the full State ranking.
Net patient income Info Net patient income: net patient revenue minus the home's total operating expenses. A positive figure means it earns more from resident care than it spends to deliver it; a negative figure means the opposite. It excludes non-operating "other income."
-$1.1M
Other income Info Money the home earns outside of resident care — such as investments, grants, rentals and other non-operating sources (CMS cost report, Worksheet G-3). It is tracked separately from net patient revenue: it is not part of that figure, and it is not included in net patient income.
$216.9K
Payroll costs Info Staff salaries plus wage-related costs — benefits such as payroll taxes, health insurance and retirement — from the home's own accounting records (CMS cost report, Worksheet A). Contract or agency labor is counted separately, under other operating costs. Rank #62 / 79Payroll — State benchmarkedThis home is ranked 62nd out of 79 homes in Arizona. Shows total annual staff payroll benchmarked to the Arizona average. Higher payroll investment relative to peers often signals better staffing and less reliance on cheaper contract labor.Rankings are based only on facilities in Arizona that report data for that category. Facilities without available data are excluded from the ranking.Click the rank badge to see the full State ranking.Click here to see the full State ranking.
$5.1M 63.7% of net patient revenue Info Payroll as a share of revenue: staff salaries and wage-related benefits divided by net patient revenue. A higher figure means more of each revenue dollar goes to staff pay. Rank #32 / 79Payroll % — State benchmarkedThis home is ranked 32nd out of 79 homes in Arizona. Shows payroll as a percentage of revenue versus the Arizona average. Well-run Arizona facilities typically land around 58–71% — the top third Statewide. Below 25% may signal understaffing or heavy agency use — read with Staffing ratings.Rankings are based only on facilities in Arizona that report data for that category. Facilities without available data are excluded from the ranking.Click the rank badge to see the full State ranking.Click here to see the full State ranking.
Other operating costs Info Everything it costs to run the home apart from payroll — food, utilities, supplies, maintenance, contract labor and administration. Calculated as total operating expense minus payroll (staff salaries and wage-related benefits).
$4.0M
Total costs Info The home's total operating expense for the year — all the costs of running it, salaries included (CMS cost report, Worksheet G-3).
$9.1M

What does this home offer?

Housing options icon

Housing Options: 1 Bed / 2 Bed / Semi-Private Rooms

Building type icon
Building type icon

Building Type: 2-story

Beauty services icon

Beauty Services

Transportation services icon

Transportation Services

Security systems icon

Security Systems

Recreational activities icon

Recreational Activities

Exercise program icon

Exercise Programs

Who this home usually serves

TYPE OF STAY

Mix of rehab and long-term care

This home supports both short-term rehab and long-term care, with residents staying for a wide range of durations.

Most new residents arrive under private pay (51% of admissions), and a typical private pay stay runs around 23 days.

Admissions
533 total

Coverage residents most often arrive under.

Medicare 7%
Private pay 51%
Medicaid 43%
Discharges
565 total

Coverage residents most often leave under.

Medicare 6%
Private pay 50%
Medicaid 44%

Places of interest near Springdale Village

Address 9.9 miles from city center Info Estimated distance in miles from Mesa's city center to Springdale Village's address, calculated via Google Maps.

Calculate Travel Distance to Springdale Village

Add your location

Address

Compare Nursing Homes around Maricopa County

The information below is reported by the Arizona Department of Health Services, Bureau of Long Term Care Licensing.

2 facilities compared · CMS & AZ Dept. of Health data

Springdale Village
NH
AL
IL
Mesa (East Broadway Road)82
54.3%
Facility 54.3%
AZ AVG 72.7%
Rank #57 / 76
-25%
4.27
Facility 4.27
AZ AVG 4.06
Rank #19 / 71
+19%+5%
$0
Facility $0
AZ AVG $31.7k
Rank #1 / 75
71
Facility 71
AZ AVG 82
Rank #31 / 53
28
Facility 28
AZ AVG 23.2
Rank #48 / 75
4.7
Facility 4.7
AZ AVG 3.8
Rank #51 / 75
-41- 29 Laura Miller
$8.1M
Facility $8.1M
AZ AVG $14.7M
Rank #62 / 79
$5.1M
Facility $5.1M
AZ AVG $6.4M
Rank #62 / 79
63.7%
Facility 63.7%
AZ AVG 48.1%
Rank #32 / 79
35207
Caliche Senior Living -
NH
AL
Casa Grande130--------------- 10
-
Facility -
AZ AVG $14.7M
Rank #65 / 79
-
Facility -
AZ AVG $6.4M
Rank #64 / 79
-
Facility -
AZ AVG 48.1%
Rank #24 / 79
35137

Financial Assistance for
Nursing Home in Arizona

Springdale Village is located in Mesa, Arizona.
Here are the financial assistance programs available to residents in Arizona.

Get Financial aid guidance

Arizona Long Term Care System

ALTCS

Age 65+ or disabled
General Arizona resident, Medicaid-eligible, nursing home-level care need.
Income Limits (2025) ~$2,829/month 300% FBR, individual
Asset Limits $2,000 (individual), $3,000 (couple).
AZ

Covers tribal members; rural outreach.

Benefits
In-home care (6-8 hours/day) Assisted living Nursing home care Medical services Transportation (10 trips/month)

Non-Medical Home and Community Based Services

AZ DES Non-Medical HCBS

Age 60+
General Arizona resident, at risk of institutionalization.
Income Limits ~$2,000/month individual, varies
Asset Limits $10,000 individual
AZ

Limited funding; waitlists common.

Benefits
Homemaker services (3-5 hours/week) Respite care (up to 10 days/year) Adult day care (~$60/day)

Weatherization Assistance Program (WAP)

AZ WAP

Age 60+ priority
General Arizona resident, own/rent home, low-income.
Income Limits (2025) ~$2,510/month 200% of poverty level, individual
Asset Limits Not applicable; income-focused.
AZ

High demand in rural desert areas; limited annual funds.

Benefits
Insulation Weather stripping HVAC repairs (avg. $500-$1,000/year savings)

Section 202 Supportive Housing for the Elderly

AZ Section 202

Age 62+
General Arizona resident, very low income, able to live independently with support.
Income Limits (2025) ~$1,645/month 50% of area median income, individual, varies by county
Asset Limits $10,000 individual, excludes home if owned
AZ

Limited units; high demand in metro areas like Phoenix.

Benefits
Subsidized rent (30% of income, e.g., $300-$500/month) On-site services (housekeeping, transportation, ~$200/month value)

Arizona CARES Program

AZ CARES

Age
General Caregivers of Arizona residents 60+ needing help with 3+ daily activities; no caregiver age limit.
Income Limits No strict limit; cost-sharing above ~$2,500/month threshold.
Asset Limits Not applicable; need-based.
AZ

Focus on rural access; complements ALTCS respite.

Benefits
Respite care (up to 10 days/year) Counseling (4-6 sessions/year) Training (2-3 workshops/year) Supplies (~$200/year)

AZ DES Non-Medical Home and Community Based Services (HCBS)

AZ DES Non-Medical HCBS

Age 60+ or disabled
General Arizona resident, need assistance with daily activities, not eligible for Medicaid/ALTCS.
Income Limits Above Medicaid threshold but low-income ~$1,500-$2,500/month, varies by region
Asset Limits Not specified; income-driven eligibility.
AZ

Targets those ineligible for ALTCS; prioritizes rural and tribal areas.

Benefits
Homemaker services (3-5 hours/week) Personal care (limited hours) Respite care (up to 10 days/year) Transportation (~5 trips/month)

Frequently Asked Questions about Springdale Village

What neighborhood is Springdale Village in?

Springdale Village is in the East Broadway Road neighborhood of Mesa.

Who is the owner of Springdale Village?

The legal owner and operator of Springdale Village is Allegiant Healthcare Al, Llc.

Is Springdale Village in a walkable area?

Springdale Village has a walk score of 29. Somewhat walkable. A few nearby services may be reachable on foot, but most trips require transportation.

What is the license number of Springdale Village?

According to AZ state health department records, Springdale Village's license number is AL10288C.

When does Springdale Village's license expire?

According to AZ state health department records, Springdale Village's license expires on February 28, 2027.

What is the occupancy rate at Springdale Village?

Springdale Village's occupancy is 54%.

Who is the administrator of Springdale Village?

Inge G Duran is the administrator of Springdale Village.

Guides for Better Senior Living

Care Cost Calculator: See Prices in Your Area

Nursing Home Data Explorer

Don’t Wait Too Long: 7 Red Flag Signs Your Parent Needs Assisted Living Now

The True Cost of Assisted Living in 2025 – And How Families Are Paying For It

Understanding Senior Living Costs: Pricing Models, Discounts & Financial Assistance