Total health inspections
3
New Hampshire average 3.5
Last Health inspection on May 2025

We arrange tours, appointments, and even moving support so you don’t have to
Thank you for your interest!
Our team will be in touch shortly to help with next steps.
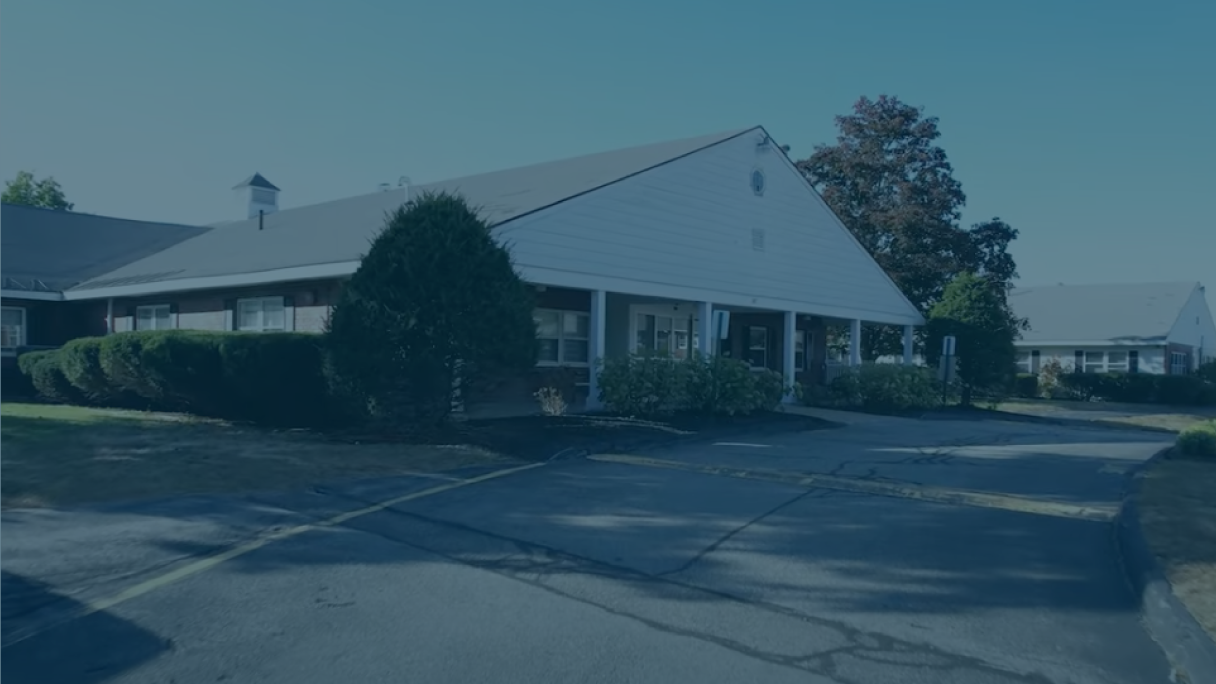


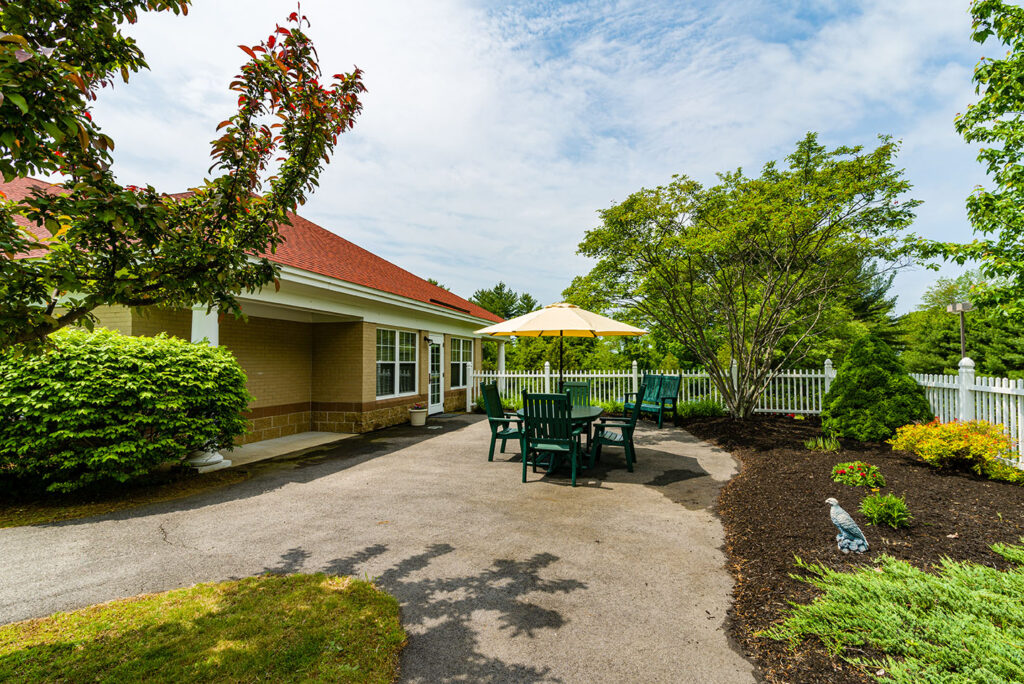
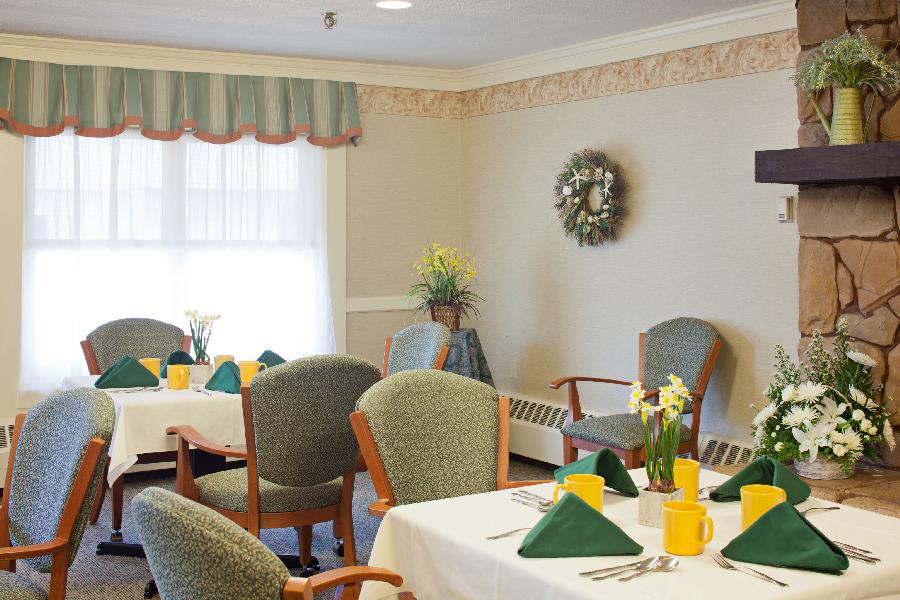
Dover Center for Health and Rehabilitation is a nursing home that proudly elevates the recovery experience of its residents. As a member of the National Health Care Associates, the health and rehab center strives to work everyday with quality service to its residents so that residents maintain a level of independence and individuality. Dover Center receives full support that helps nourish their holistic needs in a charming and convenient environment.
The services are multidisciplinary for both skilled nursing and rehabilitation– focusing on post-surgical care and on-site therapy (physical, occupational, and speech). Community services include housekeeping, laundry, transportation, meals provided, and recreational activities.
Jennifer Montague is the Center Administrator at Dover Center for Health & Rehabilitation. She is an experienced nursing home administrator with over 17 years in the skilled nursing industry as a licensed nurse. Jennifer holds a master’s degree in Healthcare Administration, a B.S. in business, and is a Licensed Nursing Home Administrator. She is dedicated to providing patient-centered care throughout all stages of a resident's stay.
Offers a balance of services and community atmosphere.
Occupancy is moderate, suggesting balanced demand.
Most residents typically stay for a few weeks or months before returning home or moving on.
51% of new residents, usually for short-term rehab.
43% of new residents, often for short stays.
6% of new residents, often for long-term daily care.
Dover Center for Health & Rehabilitation is administrated by Jennifer L Montague.
Key information about the people who lead and staff this community.
Ways to qualify for care at this community, including accepted programs and payment options.
This facility is certified for eligible Medicaid services.
This facility is certified for eligible Medicare services.
In New Hampshire, the Department of Health and Human Services, Health Facilities Administration is responsible for the unannounced inspection and licensing of all residential care and nursing facilities.
1 visits/inspections triggered by complaints
3 with issues
0 without issues
Deficiencies indicate regulatory issues. A higher number implies the facility had several areas requiring improvement.
New Hampshire average: 17 deficiencies
New Hampshire average 3.5
Last Health inspection on May 2025
New Hampshire average 14.4
New Hampshire average 3.99
Health citations are formal notices following inspections when they fail to comply with safety and care standards.
All 15 citations resulted from standard inspections.
New Hampshire average: 0.2
New Hampshire average: 0.1
Data sourced from CMS Health Deficiencies reports. Citation severity codes range from A (least serious) to L (most serious). Immediate Jeopardy (J-L) citations indicate situations where the facility's noncompliance has placed residents at risk of death or serious harm.
Nursing Home Licensed facility providing 24/7 skilled nursing care for residents with complex, ongoing medical needs. Staffed by RNs, LPNs, and CNAs. Inspected and star-rated annually by CMS. Accepts Medicare (short-term rehab) and Medicaid (long-term care).
Independent Living Lifestyle-focused communities for older adults offering dining, activities, and transportation with minimal personal care. Best for active, independent seniors who want community without medical support.
Nursing
Nursing Home Licensed facility providing 24/7 skilled nursing care for residents with complex, ongoing medical needs. Staffed by RNs, LPNs, and CNAs. Inspected and star-rated annually by CMS. Accepts Medicare (short-term rehab) and Medicaid (long-term care).
Assisted Living A licensed, long-term care setting for seniors or individuals with disabilities who need help with daily activities — like bathing, dressing, and medication management — but not 24-hour skilled nursing. Offers housing, meals, and around-the-clock support while aiming to maximize resident independence.
Nursing Home Licensed facility providing 24/7 skilled nursing care for residents with complex, ongoing medical needs. Staffed by RNs, LPNs, and CNAs. Inspected and star-rated annually by CMS. Accepts Medicare (short-term rehab) and Medicaid (long-term care).
Nursing
Respite Care Short-term temporary care — days to weeks — to give family caregivers a break. Full care provided during the stay. Often used after hospitalization or to trial a facility before a permanent placement decision.
Nursing Home Licensed facility providing 24/7 skilled nursing care for residents with complex, ongoing medical needs. Staffed by RNs, LPNs, and CNAs. Inspected and star-rated annually by CMS. Accepts Medicare (short-term rehab) and Medicaid (long-term care).
Assisted Living A licensed, long-term care setting for seniors or individuals with disabilities who need help with daily activities — like bathing, dressing, and medication management — but not 24-hour skilled nursing. Offers housing, meals, and around-the-clock support while aiming to maximize resident independence.
Nursing
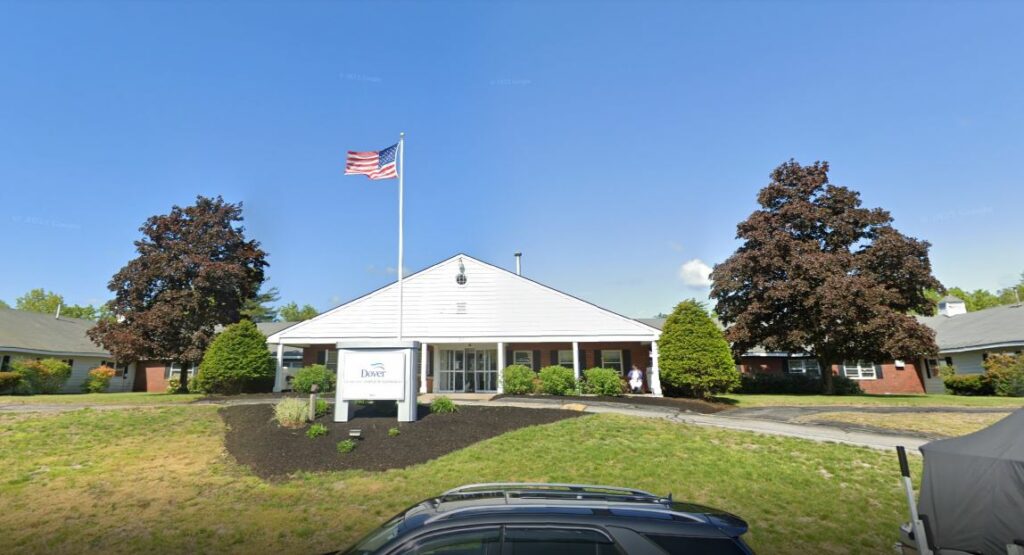
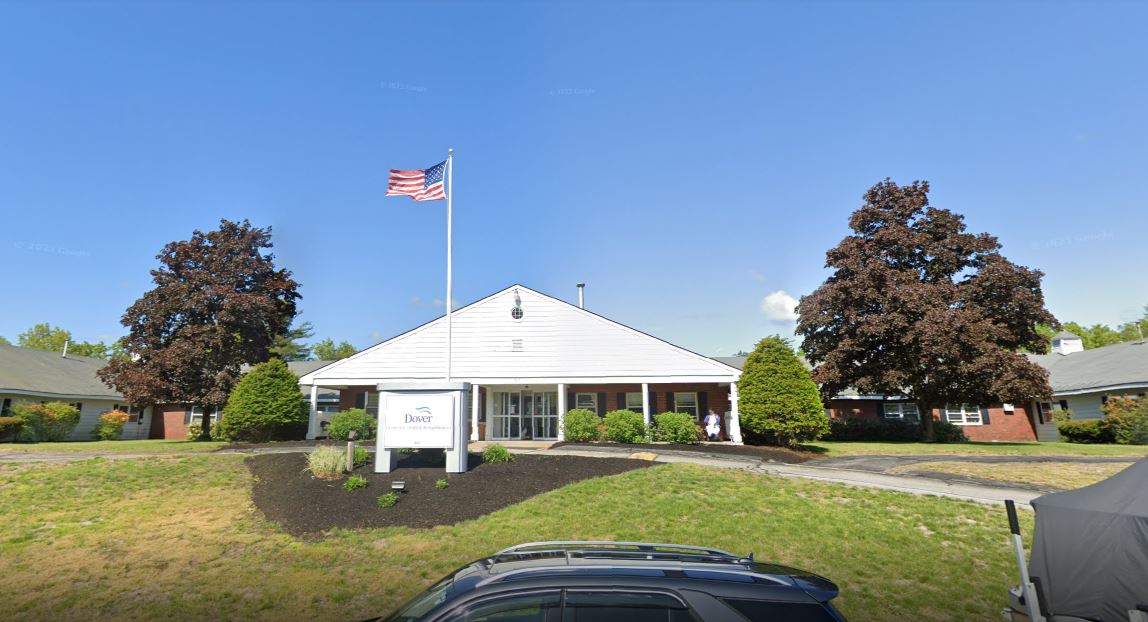
![]() 1.8 miles from city center — 0.82 miles to nearest hospital (Wentworth-Douglass Hospital)
1.8 miles from city center — 0.82 miles to nearest hospital (Wentworth-Douglass Hospital)
![]() 307 Plaza Dr, Dover, NH 03820
307 Plaza Dr, Dover, NH 03820
Add your location
This data corresponds to Q2 2025 and is based on CMS Payroll-Based Journal.
New Hampshire average ratio: 1.87:1
New Hampshire average: 7.8 hours
Manages medical care and health needs.
This role is partially covered by contractors.
Assists with medical care and medications.
This role is partially covered by contractors.
Helps with daily care and mobility.
No contractors work on this role.
Total hours from contractors
6,736 contractor hours this quarter
| Certified Nursing Assistant | 44 | 0 | 44 | 15,049 | 91 | 100% | 8.9 |
| Licensed Practical Nurse | 11 | 21 | 32 | 8,072 | 91 | 100% | 9 |
| Registered Nurse | 14 | 15 | 29 | 4,722 | 91 | 100% | 8.2 |
| Clinical Nurse Specialist | 3 | 0 | 3 | 1,234 | 64 | 70% | 8 |
| Medication Aide/Technician | 5 | 0 | 5 | 983 | 82 | 90% | 9.3 |
| Respiratory Therapy Technician | 0 | 5 | 5 | 957 | 78 | 86% | 7 |
| Dietitian | 2 | 0 | 2 | 771 | 76 | 84% | 6.9 |
| Physical Therapy Assistant | 0 | 3 | 3 | 652 | 65 | 71% | 6.5 |
| Other Dietary Services Staff | 2 | 0 | 2 | 580 | 79 | 87% | 6 |
| Administrator | 1 | 0 | 1 | 520 | 65 | 71% | 8 |
| Mental Health Service Worker | 2 | 0 | 2 | 514 | 55 | 60% | 7.5 |
| Qualified Activities Professional | 1 | 0 | 1 | 504 | 63 | 69% | 8 |
| Nurse Practitioner | 1 | 0 | 1 | 488 | 61 | 67% | 8 |
| Qualified Social Worker | 0 | 1 | 1 | 484 | 64 | 70% | 7.6 |
| Nurse Aide in Training | 6 | 0 | 6 | 476 | 26 | 29% | 6.5 |
| Speech Language Pathologist | 0 | 2 | 2 | 411 | 53 | 58% | 7.8 |
| Occupational Therapy Aide | 1 | 0 | 1 | 407 | 49 | 54% | 8.3 |
| Dental Services Staff | 1 | 0 | 1 | 228 | 29 | 32% | 7.9 |
| Physical Therapy Aide | 0 | 2 | 2 | 201 | 27 | 30% | 7.1 |
| Occupational Therapy Assistant | 0 | 1 | 1 | 36 | 6 | 7% | 6 |
| Medical Director | 0 | 1 | 1 | 26 | 13 | 14% | 2 |
Source: CMS Long-Term Care Facility Characteristics (Data as of Jan 2026)
Residents meet regularly to discuss policies, care quality, and activities
Organized group of residents that meets regularly to discuss facility policies, quality of life, and activities.
Data sourced from CMS Long-Term Care Facility Characteristics quarterly report. Payer mix reflects the current resident census by primary payment source.
These measures show how residents usually do over time at this home, based on health outcomes and preventive care.
New Hampshire average: 11.4
New Hampshire average: 23.2
New Hampshire average: 21.9%
New Hampshire average: 20.3%
New Hampshire average: 27.1%
New Hampshire average: 4.6%
New Hampshire average: 4.5%
New Hampshire average: 2.5%
New Hampshire average: 5.6%
New Hampshire average: 8.3%
New Hampshire average: 17.4%
New Hampshire average: 96.0%
New Hampshire average: 98.0%
New Hampshire average: 1.65
New Hampshire average: 1.90
New Hampshire average: 83.8%
New Hampshire average: 1.6%
New Hampshire average: 83.0%
New Hampshire average: 22.1%
New Hampshire average: 14.1%
New Hampshire average: 0.8%
New Hampshire average: 53.7%
New Hampshire average: 50.6%
Quality measures are calculated from Minimum Data Set (MDS) assessments. For most measures, lower percentages indicate better care quality.
Historical financial and operational data for Dover Center for Health & Rehabilitation based on CMS SNF Cost Reports.
Loading trend charts...
Care Cost Calculator: See Prices in Your Area
Nursing Home Data Explorer
Don’t Wait Too Long: 7 Red Flag Signs Your Parent Needs Assisted Living Now
The True Cost of Assisted Living in 2025 – And How Families Are Paying For It
Understanding Senior Living Costs: Pricing Models, Discounts & Financial Assistance

Touring a community? Use this expert-backed checklist to stay organized, ask the right questions, and find the perfect fit.
We'll send you a PDF version of the touring checklist.