East Cascade Retirement Community
Nursing Home, Assisted Living, Independent Living & Memory Care · Madras, OR
CMS overall rating Info CMS (the Centers for Medicare & Medicaid Services) is the federal agency that rates nursing home quality. Its Overall Rating runs from 1 to 5 stars, combining health inspections, staffing, and quality measures, with inspections weighted most heavily.

East Cascade Retirement Community

Nursing Home, Assisted Living, Independent Living & Memory Care · Madras, OR
CMS overall rating Info CMS (the Centers for Medicare & Medicaid Services) is the federal agency that rates nursing home quality. Its Overall Rating runs from 1 to 5 stars, combining health inspections, staffing, and quality measures, with inspections weighted most heavily.
Calculator: See prices in your area
East Cascade Retirement Community accepts Medicare, Medicaid, and private pay.

Overview of East Cascade Retirement Community

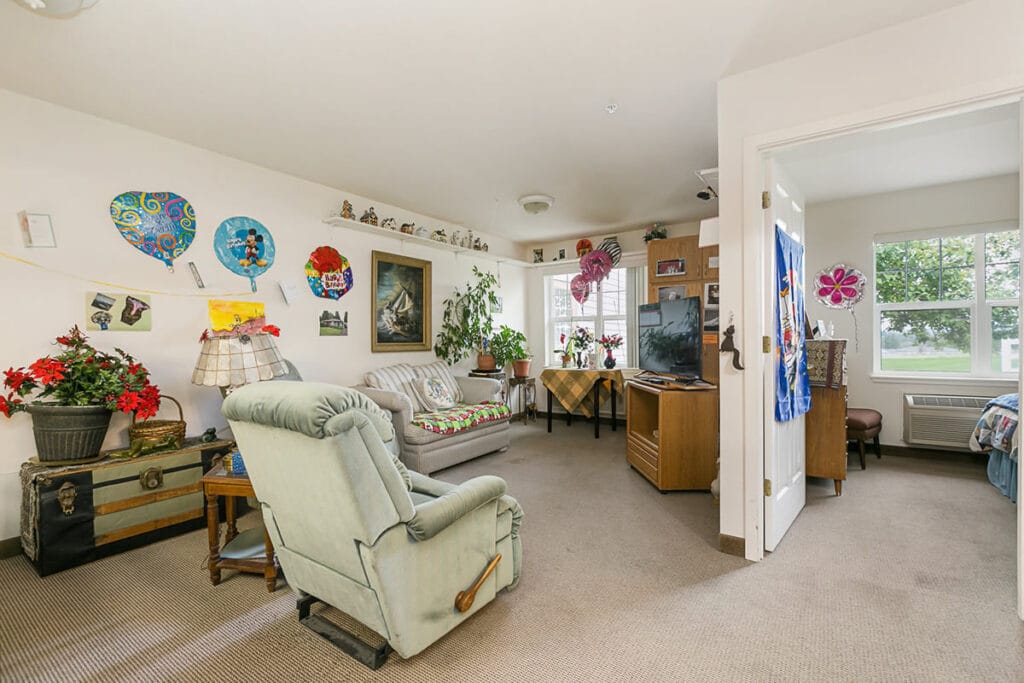
Operated by Brownor Enterprises Inc. , East Cascade Retirement Community is a nursing home in Madras, Oregon. Its Walk Score of 79 makes it easy for visiting family members to get around the surrounding neighborhood on foot. The 48-bed home has been serving the local community for 27 years, so it has a long track record of serving the community.

It accepts Medicare, Medicaid, and private pay, giving families several ways to cover short-term rehabilitation and longer-term nursing care. The community has an occupancy rate of 74%, and residents stay an average of 111 days.

Nurse staffing averages 5 hours and 16 minutes of nursing care each day. This includes 1 hour and 18 minutes of registered nurse care, 3 hours and 59 minutes of nurse aide support, and 1 hour and 2 minutes of licensed practical nurse care. The staffing structure provides consistent coverage for residents throughout the day.

Rehabilitation services are a major focus of the home. These services support residents recovering from surgery, stroke, illness, or a hospital stay who need therapy and nursing care during recovery. The facility also has 24-hour staffing, so support is available at any time of day or night for immediate needs.

Dining is offered in a family-style setting with home-cooked meals rather than a more institutional dining experience. This creates a comfortable and familiar atmosphere for residents and their families.

State inspections have focused on areas such as food storage, food preparation, sanitation practices, environmental requirements, and facility maintenance. The home has worked on these areas and has improved over time.

The community has emergency call systems, housekeeping, and maintenance services to support daily living. Families considering East Cascade Retirement Community should take a tour to learn more about the home’s culture and daily routines.

Quality ratings

Measured by Centers for Medicare & Medicaid Services (CMS)

Overall rating Info The Overall CMS Rating combines results from health inspections, staffing levels and quality measures. Health inspections carry the most weight. Staffing and quality scores can increase or decrease the final rating based on performance compared to state and national standards.
Health Inspection Info Based on the results of the facility's three most recent standard inspections and any complaint investigations. CMS reviews the number, scope, and severity of deficiencies, with more recent findings weighted more heavily.
Staffing Info Measures average nursing staff hours per resident per day, including Registered Nurses (RNs) and total nursing staff. Ratings are adjusted based on the level of care residents require and are compared to state and national benchmarks.
Quality Measures Info Based on clinical and physical health indicators reported to CMS, such as hospital readmissions, falls, pressure ulcers, and improvements in mobility. These measures reflect how well residents' health needs are being managed.

Staffing hours breakdown

Info Daily nursing hours per resident by staff type, reported to CMS. Higher is generally better — compare this facility to state and national averages to see where staffing stands.

Hours per resident per day — compared to state averages

Total nursing care / resident Info Total adjusted nursing hours per resident per day, combining RN, LPN, and aide time. CMS adjusts this for case-mix so facilities can be fairly compared.
5h 16m per day
Rank #37 / 97Nurse hours — State benchmarkedThis home is ranked 37th out of 97 homes in Oregon. Shows adjusted nurse hours per resident per day benchmarked to the Oregon average, with a ranking across 97 Oregon facilities. More hours mean more direct care. The national average is about 3.5 hrs; below 3.0 is a red flag.Rankings are based only on facilities in Oregon that report data for that category. Facilities without available data are excluded from the ranking.Click the rank badge to see the full State ranking.Click here to see the full State ranking.
vs avg

1 of 6 metrics below state avg

Standout metric Registered Nurse (RN) is +91% above state avg
Staff typeHours / Day / Residentvs state avg
Registered Nurse (RN) Info RNs hold the highest nursing license and can assess residents, interpret test results, and direct care plans. More RN hours per day often signals stronger clinical oversight and faster response to health changes. 1h 18m per day ▲ 91% State avg: 41m per day · National avg: 41m per day
LPN / LVN Info Licensed Practical Nurses (LPNs) or Licensed Vocational Nurses (LVNs) deliver routine hands-on care — medication administration, wound dressing, and monitoring vital signs. They work under RN supervision and make up a large share of daily bedside care. 1h 2m per day ▲ 15% State avg: 54m per day · National avg: 52m per day
Nurse Aide Info Certified Nurse Aides (CNAs) provide the most direct day-to-day assistance: bathing, dressing, feeding, and mobility. Nurse aide hours are typically the largest staffing category and directly affect residents' quality of life. 3h 59m per day ▲ 18% State avg: 3h 22m per day · National avg: 2h 20m per day
Weekend Total Nursing Info Combined nursing hours (RN + LPN + Nurse Aide) per resident per day on weekends. Staffing often drops on weekends — this figure reveals whether the facility maintains adequate coverage outside of weekday hours. 5h 18m per day ▲ 21% State avg: 4h 23m per day · National avg: 3h 26m per day
Physical Therapist Info Hours per resident per day provided by licensed Physical Therapists (PTs) or PT Assistants. PT services help residents recover mobility after injury or illness and are especially important for post-acute (short-stay) rehabilitation. 4m per day ▼ 25% State avg: 5m per day · National avg: 4m per day
Weekend RN Info Registered nurse hours specifically on weekends. Facilities sometimes reduce RN presence on Saturdays and Sundays — a low weekend RN figure compared to weekday hours can indicate reduced clinical oversight when most administrative staff are absent. 48m per day ▲ 84% State avg: 26m per day · National avg: 28m per day

Capacity and availability

Avg. Length of Stay
111 days
Bed community size
48-bed community Rank #237 / 351Bed count — State benchmarkedThis home is ranked 237th out of 351 homes in Oregon. Shows this facility's certified or reported bed count compared to other Oregon facilities. Larger communities may offer more amenities, programs, and on-site services for residents and families.Rankings are based only on facilities in Oregon that report data for that category. Facilities without available data are excluded from the ranking.Click the rank badge to see the full State ranking.Click here to see the full State ranking.
A moderately sized community that may balance personal attention with shared amenities and social activities.
Years in operation
27 years in operation Rank #115 / 374Years in operation — State benchmarkedThis home is ranked 115th out of 374 homes in Oregon. Shows how long this facility has been in operation compared to other Oregon facilities. Longer operating histories may benefit residents, families, and staff.Rankings are based only on facilities in Oregon that report data for that category. Facilities without available data are excluded from the ranking.Click the rank badge to see the full State ranking.Click here to see the full State ranking.
A longer operating history, which may indicate experience navigating regulations and delivering ongoing care.
Walk Score
Walk Score: 79 / 100 Rank #94 / 476Walk Score — State benchmarkedThis home is ranked 94th out of 476 homes in Oregon. Shows how walkable this facility's neighborhood is compared to the average Walk Score across Oregon facilities. Higher scores benefit residents, families, and staff.Rankings are based only on facilities in Oregon that report data for that category. Facilities without available data are excluded from the ranking.Click the rank badge to see the full State ranking.Click here to see the full State ranking.
Very walkable. Most errands can be accomplished on foot, and many essentials are within a short walk.

About this community

Occupancy

Occupancy rate
74%
Rank #23 / 95Occupancy rate — State benchmarkedThis home is ranked 23rd out of 95 homes in Oregon. Shows this facility's occupancy rate versus the Oregon average, with its Statewide rank out of 95. Higher occupancy signals strong local demand and financial stability.Rankings are based only on facilities in Oregon that report data for that category. Facilities without available data are excluded from the ranking.Click the rank badge to see the full State ranking.Click here to see the full State ranking.
Higher than the Oregon average: 65.7%
Occupied beds
36 / 48
Average occupied beds in Oregon homes 55 beds

License Details

Facility TypeAssisted Living Facility
StatusActive
IssuanceApril 6, 1999
CountyJefferson
License Number70M212
CMS Certification Number385181
AccreditationsAHCA/NCAL National Quality Award at the Bronze Level

Ownership & Operating Entity

East Cascade Retirement Community is administered by Michael Bell.

Owner NameEast Cascade Retirement Community, LLC

Safety & Compliance

Emergency SystemsYes

Therapy & Rehabilitation

1 service
Rehabilitation Services

Staffing & Medical

1 service
24-Hour Staffing

Contact Information

Amenities & Lifestyle

Emergency Call System
Family Style Dining
Housekeeping
Maintenance
Touring HoursMonday – Friday 8:00am – 5:00pm

Contact East Cascade Retirement Community

Inspection History

In Oregon, the Department of Human Services, Aging and People with Disabilities performs unannounced surveys and regular inspections to ensure resident safety in all care settings.

Since 2022 · 4 years of data 21 deficiencies 4 inspections

Inspection Scorecard Info This scorecard compares key inspection, deficiency, and complaint metrics at this facility against the Oregon state average. Metrics rated ≥15% worse than average are highlighted in red; those ≥15% better are highlighted in green.

Since 2022 vs. Oregon state average
Overall vs. OR average 1 Worse Metrics worse than Oregon average:
• Deficiencies per inspection (20% above)
3 Better Metrics better than Oregon average:
• Total deficiencies (32% below)
• Deficiencies per year (32% below)
• Total inspections (43% below)
Latest Inspection January 6, 2025

Deficiencies Info Deficiencies are formal regulatory issues recorded during state inspections.

This FacilityOR Averagevs. OR Avg
Total deficiencies Info Formal regulatory issues recorded by inspectors across all inspection types. 2131 This facility has 32% fewer total deficiencies than a typical Oregon assisted living residence (21 vs. OR avg 31).↓ 32% better
Deficiencies per year Info Average deficiencies per year since 2022. 5.37.8 This facility has 32% fewer deficiencies per year than a typical Oregon assisted living residence (5.3 vs. OR avg 7.8).↓ 32% better
Deficiencies per inspection Info Average deficiencies per inspection. 5.34.4 This facility has 20% more deficiencies per inspection than a typical Oregon assisted living residence (5.3 vs. OR avg 4.4).↑ 20% worse

Inspections Info State inspections evaluate whether the facility meets health and safety standards.

This FacilityOR Averagevs. OR Avg
Total inspections Info Combined count of all routine and focused inspections. Excludes complaint investigations. 47 This facility has 43% fewer total inspections than a typical Oregon assisted living residence (4 vs. OR avg 7).↓ 43% better

Inspection Reports Summary Info An editor-reviewed summary of the themes and findings across this facility's recent inspection reports.

  • The most recent inspection on November 18, 2025, found two deficiencies labeled as initial comments with no substantiated complaints.
  • The facility had 17 deficiencies in June 2023, including unsafe environment, inadequate care, medication errors, staffing shortages, and call system failures, with many issues unresolved at follow-up.
  • Repeated food sanitation failures appeared in inspections from July 2022 through January 2025, with some improvements noted but recurring problems in cleanliness, storage, labeling, and temperature monitoring.

Health Inspection History

Inspections since 2022
Total health inspections 4

State average N/A


Last Health inspection on Oct 2024

Total health citations
37 Rank #56 / 95Health citations — State benchmarkedThis home is ranked 56th out of 95 homes in Oregon. Shows this facility's total health deficiency citations benchmarked to the Oregon State average, with a ranking across all 95 OR facilities. Lower citation counts earn a better rank.Rankings are based only on facilities in Oregon that report data for that category. Facilities without available data are excluded from the ranking.Click the rank badge to see the full State ranking.Click here to see the full State ranking.

State average N/A

Citations per inspection
9.25 Rank #77 / 95Citations per inspection — State benchmarkedThis home is ranked 77th out of 95 homes in Oregon. Shows average deficiency citations per CMS inspection for this facility versus the Oregon mean across 95 facilities with citation data. Lower is better.Rankings are based only on facilities in Oregon that report data for that category. Facilities without available data are excluded from the ranking.Click the rank badge to see the full State ranking.Click here to see the full State ranking.

State average N/A


Health citations are formal notices following inspections when they fail to comply with safety and care standards.

22 of 37 citations resulted from standard inspections; 1 of 37 resulted from complaint investigations; and 14 of 37 came from combined inspections (standard and complaint).

Breakdown of citation severity (last 4 years)
Critical health citations
0
In line with State average

State average: N/A


Serious health citations
3
In line with State average

State average: N/A

0 critical citations State average: N/A

3 serious citations State average: N/A

34 moderate citations State average: N/A

0 minor citations State average: N/A
Citations history (last 4 years)
Nutrition moderate citation Oct 09, 2024
Corrected

Pharmacy moderate citation Oct 09, 2024
Corrected

Quality of Care moderate citation Jul 11, 2024
Corrected

Environmental moderate citation Jun 30, 2023
Corrected

Staffing Data

Reporting period: October 1 – December 31, 2025 (Q4 2025). Source: CMS Payroll-Based Journal report.

Total staff 55
Employees 26
Contractors 29
Staff to resident ratio 3.44 : 1
0% compared with State average

State average ratio: 0 : 0

Avg staff/day 16
Average shift 8 hours
0% compared with State average

State average: 0 hours

Total staff hours (quarter) 11,776

Nursing staff breakdown

Q4 2025 · Oct 1 – Dec 31 More info This data comes from the CMS Payroll-Based Journal report covering October 1 – December 31, 2025.
Registered Nurse

Manages medical care and health needs.

RN Staff Info All 5 RN Staff are full-time employees. No contractors work on this role. 5
Average shift length Info Average shift length. Calculated as total hours divided by days worked and average staff per day. 9.3 hours
Licensed Practical Nurse

Assists with medical care and medications.

LPN Staff Info All 4 LPN Staff are full-time employees. No contractors work on this role. 4
Average shift length Info Average shift length. Calculated as total hours divided by days worked and average staff per day. 9.2 hours
Certified Nursing Assistant

Helps with daily care and mobility.

CNA Staff Info 31 total: 12 full-time employees and 19 contractors. 31
Average shift length Info Average shift length. Calculated as total hours divided by days worked and average staff per day. 9.9 hours

Contractor staffing

Q4 2025 · Oct 1 – Dec 31 More info This data comes from the CMS Payroll-Based Journal report covering October 1 – December 31, 2025.

Total hours from contractors

9.1%

1,068 contractor hours this quarter

Certified Nursing Assistant: 19 Respiratory Therapy Technician: 2 Qualified Social Worker: 2 Physical Therapy Assistant: 2 Occupational Therapy Aide: 1 Medical Director: 1 Occupational Therapy Assistant: 1 Speech Language Pathologist: 1

Staff by category

Q4 2025 · Oct 1 – Dec 31 More info This data comes from the CMS Payroll-Based Journal report covering October 1 – December 31, 2025.
Certified Nursing Assistant1219316,07192100%9.9
Licensed Practical Nurse4041,5819199%9.2
Registered Nurse5051,50192100%9.3
Other Dietary Services Staff2028627986%6.6
Administrator1015286672%8
Nurse Practitioner1014886166%8
Dental Services Staff1014736470%7.4
Respiratory Therapy Technician022956368%1.1
Occupational Therapy Aide011901213%7.5
Physical Therapy Assistant022452426%1.7
Qualified Social Worker022141213%1.2
Occupational Therapy Assistant0111267%2.1
Speech Language Pathologist011944%2.2
Medical Director01171415%0.5
31 Certified Nursing Assistant
% of Days 100%
4 Licensed Practical Nurse
% of Days 99%
5 Registered Nurse
% of Days 100%
2 Other Dietary Services Staff
% of Days 86%
1 Administrator
% of Days 72%
1 Nurse Practitioner
% of Days 66%
1 Dental Services Staff
% of Days 70%
2 Respiratory Therapy Technician
% of Days 68%
1 Occupational Therapy Aide
% of Days 13%
2 Physical Therapy Assistant
% of Days 26%
2 Qualified Social Worker
% of Days 13%
1 Occupational Therapy Assistant
% of Days 7%
1 Speech Language Pathologist
% of Days 4%
1 Medical Director
% of Days 15%

Penalties and fines

Federal penalties imposed by CMS for regulatory violations, including civil money penalties (fines) and denials of payment for new Medicare/Medicaid admissions.

Source: CMS Penalties Database (Data as of Jan 2026)

Total fines amount $70K Rank #85 / 98Federal fines — State benchmarkedThis home is ranked 85th out of 98 homes in Oregon. Shows this facility's cumulative CMS federal fine dollars versus the Oregon average among facilities with fines, and where it ranks among 98 facilities in the pool. Lower total dollars mean a better rank.Rankings are based only on facilities in Oregon that report data for that category. Facilities without available data are excluded from the ranking.Click the rank badge to see the full State ranking.Click here to see the full State ranking.
17% higher than State average

State average: $60K

Number of fines 1
41% fewer fines than State average

State average: 1.7

Payment Denials Info Serious action where Medicare and/or Medicaid temporarily stops payments for new residents until issues are fixed. 0
100% fewer payment denials than State average

State average: 0.1

Fines amount comparison
This facility $70K
State average $60K

No penalties in the past 3 years

No civil money penalties or payment denials were reported in the last 3 years.

Quality of care over time

These measures show how residents usually do over time at this home, based on health outcomes and preventive care.

High-risk clinical events score Info A composite score based on pressure ulcers, falls with injury, weight loss, walking ability decline, and activities of daily living decline. 6.1
42% better than State average

State average: 10.5

Functional decline score Info A composite score based on activities of daily living decline, walking ability decline, and incontinence. 17.4
17% better than State average

State average: 21.1

Long-stay resident measures
Below average State avg: 3.4 Info CMS star rating based on long-stay quality measure performance. 5 stars = significantly above average, 1 star = significantly below average.
Need for Help with Daily Activities Increased Info Percent of long-stay residents whose need for help with daily activities has increased 9.5%
42% better than State average

State average: 16.3%

Low Risk Residents with Bowel/Bladder Incontinence Info Percent of low risk long-stay residents who lose control of their bowels or bladder 25.3%
12% worse than State average

State average: 22.6%

Falls with Major Injury Info Percent of long-stay residents experiencing one or more falls with major injury 0.0%
100% better than State average

State average: 2.4%

High Risk Residents with Pressure Ulcers Info Percent of long-stay high risk residents with pressure ulcers 6.6%
In line with State average

State average: 6.9%

Urinary Tract Infection Info Percent of long-stay residents with a urinary tract infection 6.8%
229% worse than State average

State average: 2.1%

Lost Too Much Weight Info Percent of long-stay residents who lose too much weight 8.2%
55% worse than State average

State average: 5.3%

Depressive Symptoms Info Percent of long-stay residents who have depressive symptoms 0.0%
100% better than State average

State average: 4.6%

Antipsychotic Use Info Percent of long-stay residents who received an antipsychotic medication 27.3%
106% worse than State average

State average: 13.2%

Pneumococcal Vaccine Info Percent of long-stay residents assessed and appropriately given the pneumococcal vaccine 94.9%
In line with State average

State average: 95.7%

Short-stay resident measures
Pneumococcal Vaccine Info Percent of short-stay residents assessed and appropriately given the pneumococcal vaccine 84.1%
In line with State average

State average: 86.2%

Antipsychotic medication increase Info Percent of short-stay residents who newly received an antipsychotic medication 2.2%
21% worse than State average

State average: 1.8%

Influenza Vaccine Info Percent of short-stay residents assessed and appropriately given the seasonal influenza vaccine 90.5%
11% better than State average

State average: 81.2%

Successful return to home or community Info Rate of successful return to home or community from a skilled nursing facility. 41.3%
18% worse than State average

State average: 50.6%

Breakdown by payment type

Medicare

30% of new residents, usually for short-term rehab.

Typical stay 1 months

Private pay

25% of new residents, often for short stays.

Typical stay 4 years

Medicaid

45% of new residents, often for long-term daily care.

Typical stay 5 - 6 months

Facility Characteristics

Source: CMS Long-Term Care Facility Characteristics (Data as of Jan 2026)

Total residents 16
Medicare
1
6.3% of residents
Medicaid
14
87.5% of residents
Private pay or other
1
6.3% of residents
Programs & Services
Residents Group

Residents meet regularly to discuss policies, care quality, and activities

Active Resident Council

Organized group of residents that meets regularly to discuss facility policies, quality of life, and activities.

Finances and operations

Based on CMS SNF Cost Report for fiscal year ending in 12/2023.

For-profit
Operated by a single business entity.
Net patient revenue Info Net patient revenue — what the home actually collects for resident care, after contractual allowances, bad debt and discounts are subtracted from its gross charges (CMS cost report, Worksheet G-3). It covers resident care only; money the home earns from other sources is shown separately as "Other income."
$6.0M
Net patient income Info Net patient income: net patient revenue minus the home's total operating expenses. A positive figure means it earns more from resident care than it spends to deliver it; a negative figure means the opposite. It excludes non-operating "other income."
-$350.9K
For-profit Operated by a single business entity.
Net patient revenue Info Net patient revenue — what the home actually collects for resident care, after contractual allowances, bad debt and discounts are subtracted from its gross charges (CMS cost report, Worksheet G-3). It covers resident care only; money the home earns from other sources is shown separately as "Other income."
$6.0M Rank #82 / 93Revenue — State benchmarkedThis home is ranked 82nd out of 93 homes in Oregon. Shows this facility's annual revenue compared to the Oregon average. Higher revenue generally means more resources for staffing and capital — read alongside Payroll %.Rankings are based only on facilities in Oregon that report data for that category. Facilities without available data are excluded from the ranking.Click the rank badge to see the full State ranking.Click here to see the full State ranking.
Net patient income Info Net patient income: net patient revenue minus the home's total operating expenses. A positive figure means it earns more from resident care than it spends to deliver it; a negative figure means the opposite. It excludes non-operating "other income."
-$350.9K
Other income Info Money the home earns outside of resident care — such as investments, grants, rentals and other non-operating sources (CMS cost report, Worksheet G-3). It is tracked separately from net patient revenue: it is not part of that figure, and it is not included in net patient income.
$487.7K
Payroll costs Info Staff salaries plus wage-related costs — benefits such as payroll taxes, health insurance and retirement — from the home's own accounting records (CMS cost report, Worksheet A). Contract or agency labor is counted separately, under other operating costs. Rank #83 / 93Payroll — State benchmarkedThis home is ranked 83rd out of 93 homes in Oregon. Shows total annual staff payroll benchmarked to the Oregon average. Higher payroll investment relative to peers often signals better staffing and less reliance on cheaper contract labor.Rankings are based only on facilities in Oregon that report data for that category. Facilities without available data are excluded from the ranking.Click the rank badge to see the full State ranking.Click here to see the full State ranking.
$3.2M 52.2% of net patient revenue Info Payroll as a share of revenue: staff salaries and wage-related benefits divided by net patient revenue. A higher figure means more of each revenue dollar goes to staff pay. Rank #41 / 93Payroll % — State benchmarkedThis home is ranked 41st out of 93 homes in Oregon. Shows payroll as a percentage of revenue versus the Oregon average. Well-run Oregon facilities typically land around 51–62% — the top third Statewide. Below 25% may signal understaffing or heavy agency use — read with Staffing ratings.Rankings are based only on facilities in Oregon that report data for that category. Facilities without available data are excluded from the ranking.Click the rank badge to see the full State ranking.Click here to see the full State ranking.
Other operating costs Info Everything it costs to run the home apart from payroll — food, utilities, supplies, maintenance, contract labor and administration. Calculated as total operating expense minus payroll (staff salaries and wage-related benefits).
$3.2M
Total costs Info The home's total operating expense for the year — all the costs of running it, salaries included (CMS cost report, Worksheet G-3).
$6.4M

Who this home usually serves

TYPE OF STAY

Mostly long-term care residents

Most residents stay for extended periods and receive ongoing daily care.

New residents most often arrive under Medicaid (45% of admissions), and a typical Medicaid stay runs around 5 - 6 months.

Admissions
60 total

Coverage residents most often arrive under.

Medicare 30%
Private pay 25%
Medicaid 45%
Discharges
59 total

Coverage residents most often leave under.

Medicare 20%
Private pay 32%
Medicaid 47%

Places of interest near East Cascade Retirement Community

Address 0.0 miles from city center Info Estimated distance in miles from Madras's city center to East Cascade Retirement Community's address, calculated via Google Maps.

Calculate Travel Distance to East Cascade Retirement Community

Add your location

Address

Compare Nursing Homes around the area

The information below is reported by the Oregon Department of Human Services, Aging and People with Disabilities.

East Cascade Retirement Community
NH
AL
IL
MC
Madras -48 - 79 -
EmpRes Hillsboro Health and Rehabilitation Center
NH
AL
Hillsboro (Northeast Cornell Road) -78 - 75 Studio / 1 Bed
Avamere at Hillsboro
NH
AL
IL
MC
RC
Hillsboro (Southeast 30Th Avenue) -24 - 60 Studio / 1 Bed / 2 Bed
Country Meadows Village
NH
AL
IL
Woodburn (Country Meadows Village) -50 - 55 Studio / 1 Bed / 2 Bed
Rose Linn Care Center
NH
AL
MC
RC
West Linn (Willamette) -71 - 33 -

Frequently Asked Questions about East Cascade Retirement Community

Is East Cascade Retirement Community in a walkable area?

East Cascade Retirement Community has a walk score of 79. Very walkable. Most errands can be accomplished on foot, and many essentials are within a short walk.

What is the license number of East Cascade Retirement Community?

According to OR state health department records, East Cascade Retirement Community's license number is 70M212.

What is the occupancy rate at East Cascade Retirement Community?

East Cascade Retirement Community's occupancy is 74%.

What is the best email address for East Cascade Retirement Community?

The team at East Cascade Retirement Community can be reached at michaelb@eastcascade.com.

Does East Cascade Retirement Community operate as a for-profit or non-profit?

East Cascade Retirement Community is registered as a for-profit in OR.

Who is the administrator of East Cascade Retirement Community?

Michael Bell is the administrator of East Cascade Retirement Community.

How many beds does East Cascade Retirement Community have?

East Cascade Retirement Community has 48 beds.

Guides for Better Senior Living

Care Cost Calculator: See Prices in Your Area

Nursing Home Data Explorer

Don’t Wait Too Long: 7 Red Flag Signs Your Parent Needs Assisted Living Now

The True Cost of Assisted Living in 2025 – And How Families Are Paying For It

Understanding Senior Living Costs: Pricing Models, Discounts & Financial Assistance