Explore Open Rooms
1 Contact details
2 What type of senior care service are you looking for?
3 What budget do you have in mind for senior care?
4 How soon do you need to find care?
5 Additional details

Thank you for your interest!

Our team will be in touch shortly to help with next steps.

Memory Care in Rochester

CMS overall rating Info The Overall CMS Rating combines results from health inspections, staffing levels and quality measures. Health inspections carry the most weight. Staffing and quality scores can increase or decrease the final rating based on performance compared to state and national standards.

Edenbrook Rochester

Overview of Edenbrook Rochester

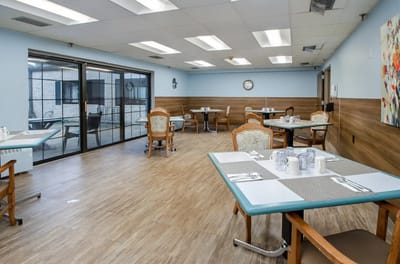
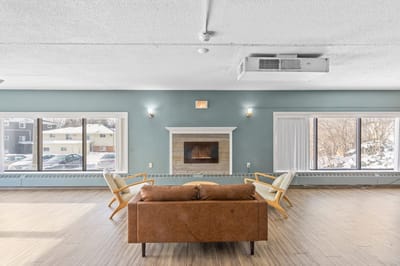
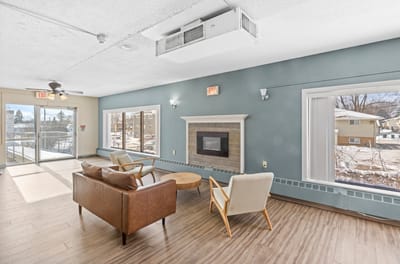
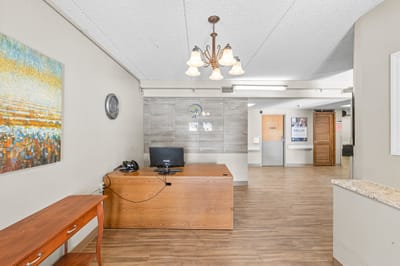
Edenbrook St. of Rochester emerges as the city’s foremost selection for post-hospital Rehabilitation and enduring long-term care solutions. Located in Rochester, Minnesota, their thoughtfully crafted memory care program is dedicated to serving individuals with Dementia and Alzheimer’s, reflecting their commitment to exceptional care. With a strong focus on a comprehensive array of therapy services, Edenbrook St. has reimagined and elevated the standard for transitional care.

As a vital contributor to the community, the establishment takes pride in engaging local experts and caregivers to provide attentive support to their residents. A firsthand experience of the brand-new Edenbrook St. of Rochester awaits.

Quality ratings

Measured by Centers for Medicare & Medicaid Services (CMS)

Overall rating Info The Overall CMS Rating combines results from health inspections, staffing levels and quality measures. Health inspections carry the most weight. Staffing and quality scores can increase or decrease the final rating based on performance compared to state and national standards.
1/5
Minnesota average: 3.2/5
Health Inspection Info Based on the results of the facility's three most recent standard inspections and any complaint investigations. CMS reviews the number, scope, and severity of deficiencies, with more recent findings weighted more heavily.
1/5
Minnesota average: 2.8/5
Staffing Info Measures average nursing staff hours per resident per day, including Registered Nurses (RNs) and total nursing staff. Ratings are adjusted based on the level of care residents require and are compared to state and national benchmarks.
4/5
Minnesota average: 4.1/5
Quality Measures Info Based on clinical and physical health indicators reported to CMS, such as hospital readmissions, falls, pressure ulcers, and improvements in mobility. These measures reflect how well residents' health needs are being managed.
4/5
Minnesota average: 3.1/5

Nursing care per resident

Info This shows how many total hours of nursing staff time are available per resident each day. Higher numbers usually mean more staff support.
4h 3m per day

This home provides 15% less nursing time per resident than the Minnesota average.

Minnesota average: 4h 46m per day

Staffing hours breakdown

Info Hours of care per resident per day, broken down by staff type. Data from CMS Medicare.
Staff type Facility State avg National avg
Registered Nurse (RN) Info Registered nurse hours per resident per day. 51m per day 1h 4m per day 41m per day
Nurse Aide Info Nurse aide hours per resident per day. 1h 56m per day 2h 33m per day 2h 21m per day
Total Nursing (Weekend) Info Total number of nurse staff hours per resident per day on weekends. 3h 9m per day 3h 41m per day 3h 26m per day
Physical Therapist Info Physical therapist staff hours per resident per day. 10m per day 4m per day 4m per day
RN (Weekend) Info Registered nurse hours per resident per day on weekends. 32m per day 41m per day 29m per day

Capacity and availability

Smaller home

May offer a more intimate, personalized care environment.

Total beds 81

This home usually has availability

Lower occupancy suggests more openings may be available.

Lower demand than the Minnesota average
Occupancy rate 66.6%
Residents per day (avg) 52
Occupancy rate
66.6%
Residents per day (avg)
52

Who this home usually serves

TYPE OF STAY

Mix of rehab and long-term care

This home supports both short-term rehab and long-term care, with residents staying for a wide range of durations.

Breakdown by payment type

Medicare

27% of new residents, usually for short-term rehab.

Typical stay 18 days

Private pay

38% of new residents, often for short stays.

Typical stay 25 days

Medicaid

34% of new residents, often for long-term daily care.

Typical stay 3 - 4 months

Finances and operations

Privately-owned community
Operated by a business corporation.
Home revenue
$8.3M
Profit
$316.6K
Privately-owned community Operated by a business corporation.
Home revenue
$8.3M
Profit
$316.6K
Payroll costs Info The portion of the home's budget spent on staff, including nurses, caregivers, and other employees who support care and operations.
$3.8M
46.1% of revenue
Other operating costs Info All remaining costs needed to run the home, such as food, utilities, building maintenance, supplies and administrative expenses.
$4.2M
Total costs $8.0M
Walk Score
Walk Score: 39 / 100
Somewhat walkable. A few nearby services may be reachable on foot, but most trips require transportation.

About this community

Therapy & Rehabilitation

2 services
Rehabilitation Services
Short-Term Rehab

Staffing & Medical

3 services
Nursing Services
Skilled Nursing
Licensed Nurses/CNAs

Amenities & Lifestyle

0 amenities
Specific ProgramsRehabilitation, Specialty Care, Primary Care, Accepted Insurance, Amenities & Gallery, Careers, Eden Fun, Contact Us

Types of Care at Edenbrook Rochester

Skilled Nursing Memory Care Respite Care Hospice Care

Contact Edenbrook Rochester

Health Inspection History

Inspections
Total health inspections 11

Minnesota average 6


Last Health inspection on May 2025

Total health citations 38

Minnesota average 23.2

Citations per inspection
3.45

Minnesota average 3.76


Health citations are formal notices following inspections when they fail to comply with safety and care standards.

19 of 38 citations resulted from standard inspections; 18 of 38 resulted from complaint investigations; and 1 of 38 came from combined inspections (standard and complaint).

Breakdown of citation severity (last 3 years)
Critical Health citations More info 1
43% worse than Minnesota average

Minnesota average: 0.7


Serious Health citations More info 3
500% worse than Minnesota average

Minnesota average: 0.5

1 critical citation More info Minnesota average: 0.7

3 serious citations More info Minnesota average: 0.5

34 moderate citations More info Minnesota average: 21.2

0 minor citations More info Minnesota average: 0.8
Citations history (last 3 years)
Infection Control moderate citation Info Issues related to preventing and controlling infections, including hygiene practices and safety protocols. May 01, 2025
Corrected

Pharmacy moderate citation Info Issues related to medication management, including how drugs are stored, administered, and monitored. May 01, 2025
Corrected

Care Planning moderate citation Info Issues related to creating and updating personalized care plans for residents based on their needs and conditions. May 01, 2025
Corrected

Resident Rights moderate citation Info Issues related to resident's rights, including dignity, privacy, and the ability to make decisions about their care. May 01, 2025
Corrected

Compare Memory Care around Rochester The information below is reported by the Minnesota Department of Health, Health Regulation Division.

Filter by care type
Cottagewood Senior Community
MC

Memory Care Secured, specialized care for people living with Alzheimer's or dementia. Staff trained in cognitive impairment, with higher staff-to-resident ratios and an environment designed to reduce confusion and wandering risk.

Rochester
125
No
36
-
-
72.0%
-
4
84.4%
1
7
AVIVA River Bend
AL

Assisted Living A licensed, long-term care setting for seniors or individuals with disabilities who need help with daily activities — like bathing, dressing, and medication management — but not 24-hour skilled nursing. Offers housing, meals, and around-the-clock support while aiming to maximize resident independence.

MC

Memory Care Secured, specialized care for people living with Alzheimer's or dementia. Staff trained in cognitive impairment, with higher staff-to-resident ratios and an environment designed to reduce confusion and wandering risk.

Rochester
90
Yes
78
Studio / 1 Bed / 2 Bed
-
-
-
2
92%
0
0
Edenbrook Rochester
HC

Home Care Professional care delivered in the person's own home — from companionship and errands to skilled nursing and therapy. Allows seniors to age in place. Medicare covers skilled home health when medically necessary.

MC

Memory Care Secured, specialized care for people living with Alzheimer's or dementia. Staff trained in cognitive impairment, with higher staff-to-resident ratios and an environment designed to reduce confusion and wandering risk.

NH

Nursing Home Licensed facility providing 24/7 skilled nursing care for residents with complex, ongoing medical needs. Staffed by RNs, LPNs, and CNAs. Inspected and star-rated annually by CMS. Accepts Medicare (short-term rehab) and Medicaid (long-term care).

RC

Respite Care Short-term temporary care — days to weeks — to give family caregivers a break. Full care provided during the stay. Often used after hospitalization or to trial a facility before a permanent placement decision.

Rochester
81
No
39
-
-
66.6%
-
-
-
-
0
0
Cascade Creek Memory Care
MC

Memory Care Secured, specialized care for people living with Alzheimer's or dementia. Staff trained in cognitive impairment, with higher staff-to-resident ratios and an environment designed to reduce confusion and wandering risk.

Rochester
50
No
10
Private Suite
-
90.0%
-
3
81.8%
1
12
Meadow Lakes Senior Living
AL

Assisted Living A licensed, long-term care setting for seniors or individuals with disabilities who need help with daily activities — like bathing, dressing, and medication management — but not 24-hour skilled nursing. Offers housing, meals, and around-the-clock support while aiming to maximize resident independence.

IL

Independent Living Lifestyle-focused communities for older adults offering dining, activities, and transportation with minimal personal care. Best for active, independent seniors who want community without medical support.

MC

Memory Care Secured, specialized care for people living with Alzheimer's or dementia. Staff trained in cognitive impairment, with higher staff-to-resident ratios and an environment designed to reduce confusion and wandering risk.

RC

Respite Care Short-term temporary care — days to weeks — to give family caregivers a break. Full care provided during the stay. Often used after hospitalization or to trial a facility before a permanent placement decision.

Rochester
-
No
11
-
25
-
A+
-
-
-
0
0

Places of interest near Edenbrook Rochester

Address 2.7 miles from city center — 1.11 miles to nearest hospital (Hy-Vee Pharmacy)

Calculate Travel Distance to Edenbrook Rochester

Add your location

Address

Staffing Data (Q2 2025)

This data corresponds to Q2 2025 and is based on CMS Payroll-Based Journal.

Total staff 106
Employees 81
Contractors 25
Staff to resident ratio 2.08:1
6% worse than Minnesota average

Minnesota average ratio: 2.22:1

Avg staff/day 33
Average shift 7.5 hours
0% compared with Minnesota average

Minnesota average: 7.5 hours

Total staff hours (quarter) 22,395
Nursing staff breakdown
Registered Nurse

Manages medical care and health needs.

Total count 11
Average shift length Info Average shift length. Calculated as total hours divided by days worked and average staff per day. 8.1 hours

This role is partially covered by contractors.

Licensed Practical Nurse

Assists with medical care and medications.

Total count 12
Average shift length Info Average shift length. Calculated as total hours divided by days worked and average staff per day. 8.8 hours

No contractors work on this role.

Certified Nursing Assistant

Helps with daily care and mobility.

Total count 54
Average shift length Info Average shift length. Calculated as total hours divided by days worked and average staff per day. 7.3 hours

This role is partially covered by contractors.

Contractor staffing

Total hours from contractors

8%

1,789 contractor hours this quarter

Certified Nursing Assistant: 6 Physical Therapy Assistant: 5 Respiratory Therapy Technician: 4 Speech Language Pathologist: 3 Qualified Social Worker: 2 Registered Nurse: 1 Physical Therapy Aide: 1 Occupational Therapy Assistant: 1 Occupational Therapy Aide: 1 Medical Director: 1
Staff by category
Certified Nursing Assistant4865410,03191100%7.3
Licensed Practical Nurse120123,75591100%8.8
Registered Nurse101113,46891100%8.1
Administrator3037477380%8.1
Respiratory Therapy Technician1456826774%5.4
Nurse Practitioner1015126470%8
Clinical Nurse Specialist1015126470%8
Dietitian1015126470%8
Physical Therapy Assistant1564706470%5.3
Speech Language Pathologist0334606774%5.4
Mental Health Service Worker1014505864%7.8
Other Dietary Services Staff1014216774%6.3
Physical Therapy Aide0112405055%4.8
Occupational Therapy Aide112991820%5.5
Qualified Social Worker022201719%1.2
Occupational Therapy Assistant0111022%5
Medical Director011633%2
54 Certified Nursing Assistant
% of Days 100%
12 Licensed Practical Nurse
% of Days 100%
11 Registered Nurse
% of Days 100%
3 Administrator
% of Days 80%
5 Respiratory Therapy Technician
% of Days 74%
1 Nurse Practitioner
% of Days 70%
1 Clinical Nurse Specialist
% of Days 70%
1 Dietitian
% of Days 70%
6 Physical Therapy Assistant
% of Days 70%
3 Speech Language Pathologist
% of Days 74%
1 Mental Health Service Worker
% of Days 64%
1 Other Dietary Services Staff
% of Days 74%
1 Physical Therapy Aide
% of Days 55%
2 Occupational Therapy Aide
% of Days 20%
2 Qualified Social Worker
% of Days 19%
1 Occupational Therapy Assistant
% of Days 2%
1 Medical Director
% of Days 3%

Facility Characteristics

Source: CMS Long-Term Care Facility Characteristics (Data as of Jan 2026)

Total census
51 residents
Residents by payment source
Medicare
3 residents (5.9%)
Medicaid
35 residents (68.6%)
Private pay or other
13 residents (25.5%)
Programs & Services
Residents' Group

Residents meet regularly to discuss policies, care quality, and activities

Active Resident Council

Organized group of residents that meets regularly to discuss facility policies, quality of life, and activities.

Quality of care over time

These measures show how residents usually do over time at this home, based on health outcomes and preventive care.

High-risk clinical events score Info A composite score based on pressure ulcers, falls with injury, weight loss, walking ability decline, and activities of daily living decline. 8.2
26% better than Minnesota average

Minnesota average: 11.1

Functional decline score Info A composite score based on activities of daily living decline, walking ability decline, and incontinence. 18.2
19% better than Minnesota average

Minnesota average: 22.6

Long-stay resident measures
Above average Minnesota avg: 2.9 Info CMS star rating based on long-stay quality measure performance. 5 stars = significantly above average, 1 star = significantly below average.
Need for Help with Daily Activities Increased Info Percent of long-stay residents whose need for help with daily activities has increased 15.4%
18% better than Minnesota average

Minnesota average: 18.9%

Walking Ability Worsened Info Percent of long-stay residents whose ability to move independently worsened 15.3%
36% better than Minnesota average

Minnesota average: 23.8%

Low Risk Residents with Bowel/Bladder Incontinence Info Percent of low risk long-stay residents who lose control of their bowels or bladder 23.9%
5% better than Minnesota average

Minnesota average: 25.0%

Falls with Major Injury Info Percent of long-stay residents experiencing one or more falls with major injury 2.9%
22% better than Minnesota average

Minnesota average: 3.7%

High Risk Residents with Pressure Ulcers Info Percent of long-stay high risk residents with pressure ulcers 4.6%
15% better than Minnesota average

Minnesota average: 5.4%

Urinary Tract Infection Info Percent of long-stay residents with a urinary tract infection 4.1%
52% worse than Minnesota average

Minnesota average: 2.7%

Lost Too Much Weight Info Percent of long-stay residents who lose too much weight 2.6%
38% better than Minnesota average

Minnesota average: 4.1%

Depressive Symptoms Info Percent of long-stay residents who have depressive symptoms 20.4%
370% worse than Minnesota average

Minnesota average: 4.4%

Antipsychotic Use Info Percent of long-stay residents who received an antipsychotic medication 12.9%
25% better than Minnesota average

Minnesota average: 17.2%

Pneumococcal Vaccine Info Percent of long-stay residents assessed and appropriately given the pneumococcal vaccine 97.1%
In line with Minnesota average

Minnesota average: 97.3%

Influenza Vaccine Info Percent of long-stay residents assessed and appropriately given the seasonal influenza vaccine 97.7%
In line with Minnesota average

Minnesota average: 96.0%

Hospitalizations per 1,000 days Info Number of hospitalizations per 1,000 long-stay resident days. 1.39
17% better than Minnesota average

Minnesota average: 1.67

ED visits per 1,000 days Info Number of outpatient emergency department visits per 1,000 long-stay resident days. 1.12
44% better than Minnesota average

Minnesota average: 1.99

Short-stay resident measures
Above average Minnesota avg: 2.7 Info CMS star rating based on short-stay quality measure performance. 5 stars = much above average, 1 star = much below average.
Pneumococcal Vaccine Info Percent of short-stay residents assessed and appropriately given the pneumococcal vaccine 89.5%
In line with Minnesota average

Minnesota average: 88.9%

Antipsychotic medication increase Info Percent of short-stay residents who newly received an antipsychotic medication 0.5%
75% better than Minnesota average

Minnesota average: 1.9%

Influenza Vaccine Info Percent of short-stay residents assessed and appropriately given the seasonal influenza vaccine 82.5%
In line with Minnesota average

Minnesota average: 82.6%

Re-hospitalized after SNF stay Info Percentage of short-stay residents who were re-hospitalized after their nursing home admission. 16.3%
29% better than Minnesota average

Minnesota average: 23.1%

Emergency department visits Info Percentage of short-stay residents who had an outpatient emergency department visit. 21.0%
50% worse than Minnesota average

Minnesota average: 14.0%

Falls with major injury Info Percentage of SNF residents who experience falls with major injury during their stay. 0.0%
100% better than Minnesota average

Minnesota average: 0.8%

Ability to care for self at discharge Info Percentage of residents at or above expected ability to care for themselves at discharge. 40.5%
25% worse than Minnesota average

Minnesota average: 53.7%

Successful return to home or community Info Rate of successful return to home or community from a skilled nursing facility. 53.2%
5% better than Minnesota average

Minnesota average: 50.6%

Penalties and fines

Federal penalties imposed by CMS for regulatory violations, including civil money penalties (fines) and denials of payment for new Medicare/Medicaid admissions.

Source: CMS Penalties Database (Data as of Jan 2026)

Total fines amount $68K
53% higher than Minnesota average

Minnesota average: $44K

Number of fines 4
99% more fines than Minnesota average

Minnesota average: 2.0

Payment Denials Info Serious action where Medicare and/or Medicaid temporarily stops payments for new residents until issues are fixed. 0
100% fewer payment denials than Minnesota average

Minnesota average: 0.4

Fines amount comparison
This facility $68K
Minnesota average $44K
Penalty History

Penalties are imposed by CMS for violations of federal nursing home regulations.

Civil Money Penalty Info Fines imposed for noncompliance, which can be assessed per day or per instance of violation. Jan 13, 2025
$16K
Civil Money Penalty Info Fines imposed for noncompliance, which can be assessed per day or per instance of violation. Jul 10, 2024
$14K
Civil Money Penalty Info Fines imposed for noncompliance, which can be assessed per day or per instance of violation. Mar 28, 2024
$27K
Civil Money Penalty Info Fines imposed for noncompliance, which can be assessed per day or per instance of violation. Jan 18, 2023
$11K

Last updated: Jan 2026

Guides for Better Senior Living

Care Cost Calculator: See Prices in Your Area

Nursing Home Data Explorer

Don’t Wait Too Long: 7 Red Flag Signs Your Parent Needs Assisted Living Now

The True Cost of Assisted Living in 2025 – And How Families Are Paying For It

Understanding Senior Living Costs: Pricing Models, Discounts & Financial Assistance

Financial Aid for Minnesota Seniors

Get financial aid guidance

Elderly Waiver

Minnesota Medicaid EW

Age 65+, Minnesota resident, Medicaid-eligible, nursing home-level care need.

~$2,829/month (300% FBR, individual).

$3,000 (individual, higher than most states).

Higher asset limit; rural access focus.

Essential Community Supports (ECS)

Minnesota ECS

Age 65+, Minnesota resident, at risk of decline but not nursing home level.

~$1,732/month (individual, varies).

$3,000 (individual).

Bridges gap for those ineligible for waivers.

Alternative Care (AC) Program

Minnesota Alternative Care Program

Age 65+, Minnesota resident, NFLOC, not MA-eligible.

~$1,255-$2,829/month (100%-300% FPL); sliding scale copays.

$3,000 (individual); home equity limit $713,000.

CDCS option; statewide via counties.

Minnesota Senior Health Options (MSHO)

Minnesota Senior Health Options

Age 65+, Minnesota resident, eligible for MA and Medicare Parts A/B.

~$1,255/month (100% FPL for MA); spenddown allowed.

$3,000 (individual), $6,000 (couple).

7 health plans (e.g., UCare, HealthPartners); care coordinator assigned.

Minnesota Senior Care Plus (MSC+)

Minnesota Senior Care Plus

Age 65+, Minnesota resident, MA-eligible, not on Medicare.

~$1,255/month (100% FPL); spenddown allowed.

$3,000 (individual), $6,000 (couple).

Includes EW services; 7 health plans available.

Consumer Support Grant (CSG)

Minnesota Consumer Support Grant

Age 65+ or disabled, Minnesota resident, eligible for MA personal care but opts for grant.

~$1,255/month (MA-eligible); spenddown allowed.

$3,000 (individual).

Can hire family; statewide via counties.

Medicare Savings Program (MSP)

Minnesota Medicare Savings Program

Age 65+ or disabled, Minnesota resident, Medicare Part A/B.

~$2,510/month (QMB), ~$3,380/month (SLMB), ~$3,598/month (QI)—individual.

$9,430 (individual), $14,130 (couple).

Three tiers; no waitlist; includes Extra Help for Part D.

VA Aid and Attendance (A&A) and Housebound Benefits

Minnesota VA Aid and Attendance/Housebound

Age 65+ or disabled veteran/spouse, Minnesota resident, wartime service, need for ADL help (A&A) or homebound.

Net income < ~$1,984/month (veteran with dependent, A&A); pension offsets income.

~$155,356 (net worth limit).

High veteran demand in rural/urban areas.

Tour Icon
Planning a tour? Check our touring checklist.
Chat Icon
Thinking of living here? We can help you speak to a current resident