Elevate Home Health & Hospice, LLC
Nursing Home & Home Care · Price, UT
CMS overall rating Info CMS (the Centers for Medicare & Medicaid Services) is the federal agency that rates nursing home quality. Its Overall Rating runs from 1 to 5 stars, combining health inspections, staffing, and quality measures, with inspections weighted most heavily.

Elevate Home Health & Hospice, LLC

Nursing Home & Home Care · Price, UT
CMS overall rating Info CMS (the Centers for Medicare & Medicaid Services) is the federal agency that rates nursing home quality. Its Overall Rating runs from 1 to 5 stars, combining health inspections, staffing, and quality measures, with inspections weighted most heavily.
Calculator: See prices in your area
Elevate Home Health & Hospice, LLC accepts Medicare, Medicaid, and private pay.

Overview of Elevate Home Health & Hospice, LLC

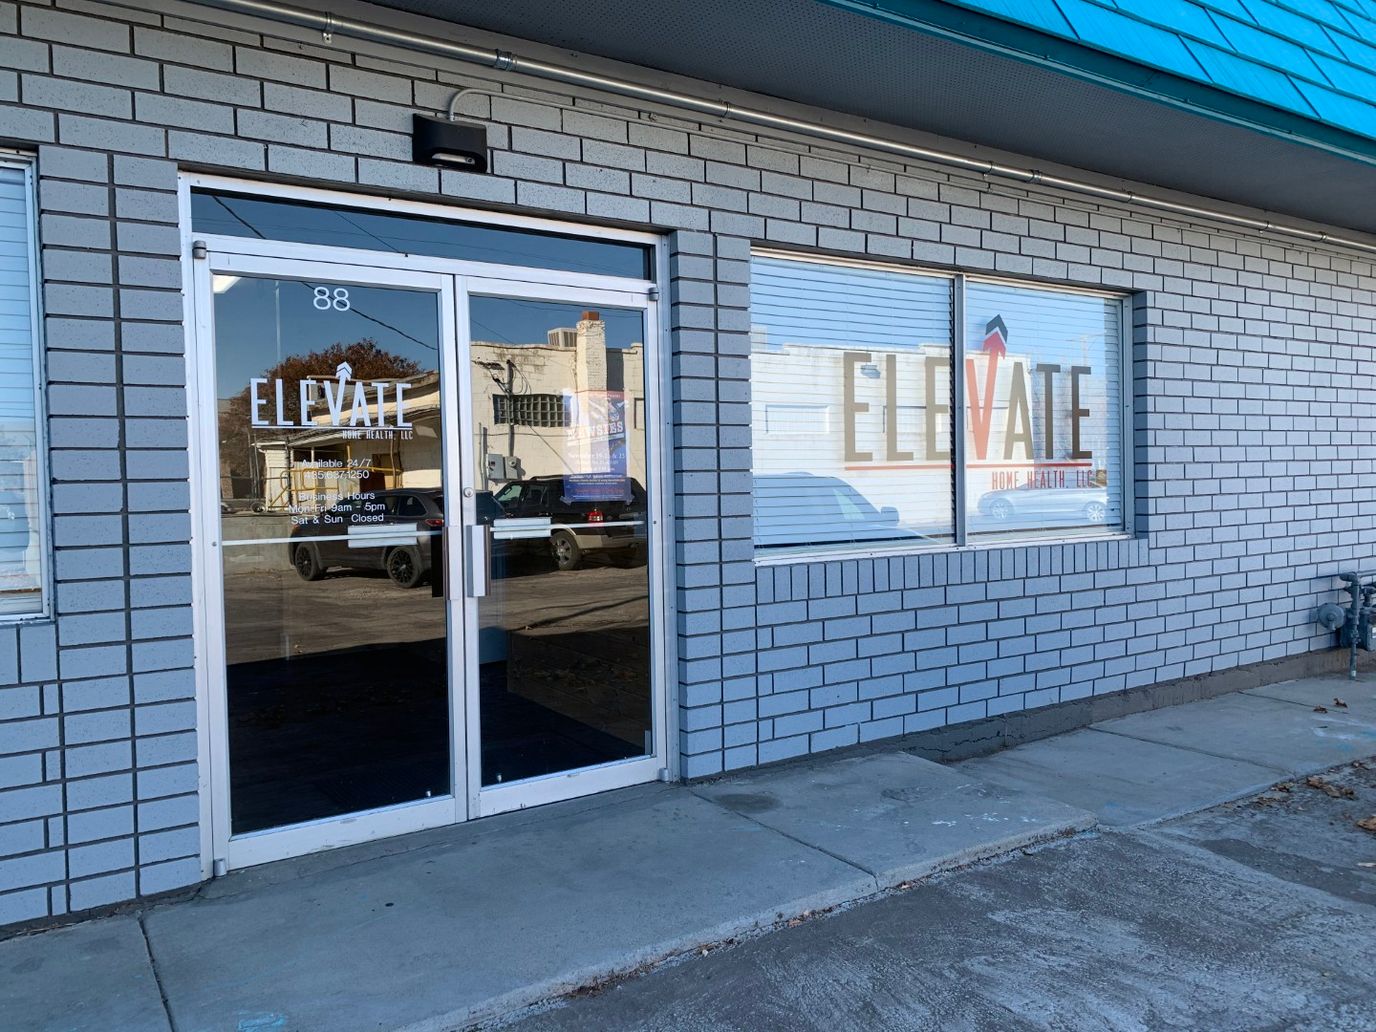
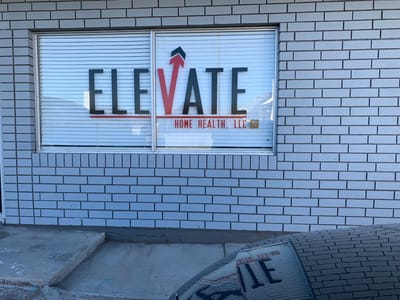
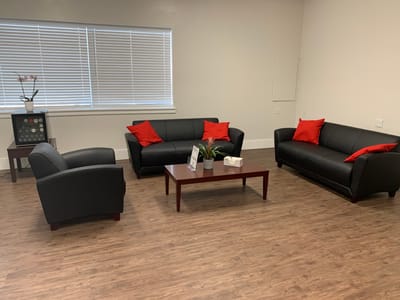
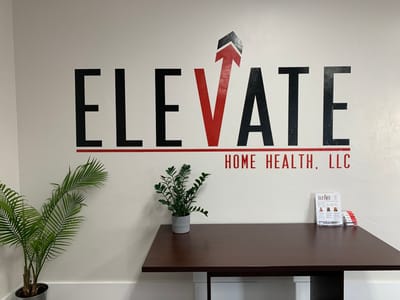
Elevate Home Health & Hospice LLC is a locally-owned and operated home care provider in Price, UT, that offers home health care and hospice care. With its dedicated services, older adults receive the utmost attention and care for their unique needs. Light housekeeping and meal preparation are also taken care of to maintain a clean environment for older adults and their families.

Through genuine companionship, older adults will not feel lonely and can live actively. Those with life-limiting conditions can also ease their worries, as dedicated support is provided to ease their discomfort and pain. This home care provider is ideal for those aiming to spend their golden years at home.

Quality ratings

Measured by Centers for Medicare & Medicaid Services (CMS)

Overall rating Info The Overall CMS Rating combines results from health inspections, staffing levels and quality measures. Health inspections carry the most weight. Staffing and quality scores can increase or decrease the final rating based on performance compared to state and national standards.
Health Inspection Info Based on the results of the facility's three most recent standard inspections and any complaint investigations. CMS reviews the number, scope, and severity of deficiencies, with more recent findings weighted more heavily.
Staffing Info Measures average nursing staff hours per resident per day, including Registered Nurses (RNs) and total nursing staff. Ratings are adjusted based on the level of care residents require and are compared to state and national benchmarks.
Quality Measures Info Based on clinical and physical health indicators reported to CMS, such as hospital readmissions, falls, pressure ulcers, and improvements in mobility. These measures reflect how well residents' health needs are being managed.

Staffing hours breakdown

Info Daily nursing hours per resident by staff type, reported to CMS. Higher is generally better — compare this facility to state and national averages to see where staffing stands.

Hours per resident per day — compared to state averages

Total nursing care / resident Info Total adjusted nursing hours per resident per day, combining RN, LPN, and aide time. CMS adjusts this for case-mix so facilities can be fairly compared.
3h 40m per day
Rank #27 / 80Nurse hours — State benchmarkedThis home is ranked 27th out of 80 homes in Utah. Shows adjusted nurse hours per resident per day benchmarked to the Utah average, with a ranking across 80 Utah facilities. More hours mean more direct care. The national average is about 3.5 hrs; below 3.0 is a red flag.Rankings are based only on facilities in Utah that report data for that category. Facilities without available data are excluded from the ranking.Click the rank badge to see the full State ranking.Click here to see the full State ranking.
vs avg
Staff typeHours / Day / Residentvs state avg
Weekend Total Nursing Info Combined nursing hours (RN + LPN + Nurse Aide) per resident per day on weekends. Staffing often drops on weekends — this figure reveals whether the facility maintains adequate coverage outside of weekday hours. 3h 20m per day

Capacity and availability

This home usually has availability

Lower occupancy than the state average
Occupancy rate
63.8% Rank #55 / 86Occupancy rate — State benchmarkedThis home is ranked 55th out of 86 homes in Utah. Shows this facility's occupancy rate versus the Utah average, with its Statewide rank out of 86. Higher occupancy signals strong local demand and financial stability.Rankings are based only on facilities in Utah that report data for that category. Facilities without available data are excluded from the ranking.Click the rank badge to see the full State ranking.Click here to see the full State ranking.
Avg. Length of Stay
83 days
Bed community size
120-bed community Rank #33 / 196Bed count — State benchmarkedThis home is ranked 33rd out of 196 homes in Utah. Shows this facility's certified or reported bed count compared to other Utah facilities. Larger communities may offer more amenities, programs, and on-site services for residents and families.Rankings are based only on facilities in Utah that report data for that category. Facilities without available data are excluded from the ranking.Click the rank badge to see the full State ranking.Click here to see the full State ranking.
A larger shared setting that may offer more common spaces and organized community services.
Walk Score
Walk Score: 70 / 100 Rank #60 / 280Walk Score — State benchmarkedThis home is ranked 60th out of 280 homes in Utah. Shows how walkable this facility's neighborhood is compared to the average Walk Score across Utah facilities. Higher scores benefit residents, families, and staff.Rankings are based only on facilities in Utah that report data for that category. Facilities without available data are excluded from the ranking.Click the rank badge to see the full State ranking.Click here to see the full State ranking.
Very walkable. Most errands can be accomplished on foot, and many essentials are within a short walk.

Payment & Insurance

1 service
Accept Medicare

Therapy & Rehabilitation

1 service
Rehabilitation Services

Staffing & Medical

1 service
24-Hour Staffing

Additional Services

2 services
Home Health
Personal Care

Contact Elevate Home Health & Hospice, LLC

Staffing Data

Reporting period: July 1 – September 30, 2025 (Q3 2025). Source: CMS Payroll-Based Journal report.

Total staff 145
Employees 135
Contractors 10
Staff to resident ratio 1.96 : 1
0% compared with State average

State average ratio: 0 : 0

Avg staff/day 48
Average shift 7.7 hours
0% compared with State average

State average: 0 hours

Total staff hours (quarter) 34,004

Nursing staff breakdown

Q3 2025 · Jul 1 – Sep 30 More info This data comes from the CMS Payroll-Based Journal report covering July 1 – September 30, 2025.
Registered Nurse

Manages medical care and health needs.

RN Staff Info 19 total: 17 full-time employees and 2 contractors. 19
Average shift length Info Average shift length. Calculated as total hours divided by days worked and average staff per day. 9.2 hours
Licensed Practical Nurse

Assists with medical care and medications.

LPN Staff Info All 9 LPN Staff are full-time employees. No contractors work on this role. 9
Average shift length Info Average shift length. Calculated as total hours divided by days worked and average staff per day. 8.6 hours
Certified Nursing Assistant

Helps with daily care and mobility.

CNA Staff Info 61 total: 54 full-time employees and 7 contractors. 61
Average shift length Info Average shift length. Calculated as total hours divided by days worked and average staff per day. 7.6 hours

Contractor staffing

Q3 2025 · Jul 1 – Sep 30 More info This data comes from the CMS Payroll-Based Journal report covering July 1 – September 30, 2025.

Total hours from contractors

0.8%

257 contractor hours this quarter

Certified Nursing Assistant: 7 Registered Nurse: 2 Respiratory Therapy Technician: 1

Staff by category

Q3 2025 · Jul 1 – Sep 30 More info This data comes from the CMS Payroll-Based Journal report covering July 1 – September 30, 2025.
Certified Nursing Assistant5476113,50492100%7.6
Registered Nurse172194,64892100%9.2
Licensed Practical Nurse9093,32692100%8.6
Dental Services Staff4042,0187986%7.6
Qualified Social Worker6061,8806975%7.2
Speech Language Pathologist4041,7497986%7.2
Nurse Aide in Training9091,2708289%7.3
Other Dietary Services Staff6067327683%5.8
Respiratory Therapy Technician3147097278%7.1
Physical Therapy Aide2026296065%6.9
Nurse Practitioner1015946672%9
Clinical Nurse Specialist1015766470%9
Dietitian2025466672%7.9
Administrator1015286672%8
Therapeutic Recreation Specialist3034696166%5.5
Physical Therapy Assistant100104377076%5.7
Medication Aide/Technician1012382932%8.2
RN Director of Nursing2021523134%4.9
61 Certified Nursing Assistant
% of Days 100%
19 Registered Nurse
% of Days 100%
9 Licensed Practical Nurse
% of Days 100%
4 Dental Services Staff
% of Days 86%
6 Qualified Social Worker
% of Days 75%
4 Speech Language Pathologist
% of Days 86%
9 Nurse Aide in Training
% of Days 89%
6 Other Dietary Services Staff
% of Days 83%
4 Respiratory Therapy Technician
% of Days 78%
2 Physical Therapy Aide
% of Days 65%
1 Nurse Practitioner
% of Days 72%
1 Clinical Nurse Specialist
% of Days 70%
2 Dietitian
% of Days 72%
1 Administrator
% of Days 72%
3 Therapeutic Recreation Specialist
% of Days 66%
10 Physical Therapy Assistant
% of Days 76%
1 Medication Aide/Technician
% of Days 32%
2 RN Director of Nursing
% of Days 34%

Penalties and fines

Includes penalties issued in 2023

Federal penalties imposed by CMS for regulatory violations, including civil money penalties (fines) and denials of payment for new Medicare/Medicaid admissions.

Source: CMS Penalties Database (Data as of Jan 2026)

Total fines amount $38K Rank #62 / 80Federal fines — State benchmarkedThis home is ranked 62nd out of 80 homes in Utah. Shows this facility's cumulative CMS federal fine dollars versus the Utah average among facilities with fines, and where it ranks among 80 facilities in the pool. Lower total dollars mean a better rank.Rankings are based only on facilities in Utah that report data for that category. Facilities without available data are excluded from the ranking.Click the rank badge to see the full State ranking.Click here to see the full State ranking.
28% lower than State average

State average: $53K

Number of fines 1
48% fewer fines than State average

State average: 1.9

Payment Denials Info Serious action where Medicare and/or Medicaid temporarily stops payments for new residents until issues are fixed. 0
100% fewer payment denials than State average

State average: 0.3

Fines amount comparison
This facility $38K
State average $53K
Penalty History

Penalties are imposed by CMS for violations of federal nursing home regulations.

1 penalty in the past 3 years

Jul 18, 2023 · $38K

Civil Money Penalty Info Fines imposed for noncompliance, which can be assessed per day or per instance of violation. Jul 18, 2023
$38K

Last updated: Jan 2026

Quality of care over time

These measures show how residents usually do over time at this home, based on health outcomes and preventive care.

High-risk clinical events score Info A composite score based on pressure ulcers, falls with injury, weight loss, walking ability decline, and activities of daily living decline. 6.5
30% better than State average

State average: 9.3

Functional decline score Info A composite score based on activities of daily living decline, walking ability decline, and incontinence. 15.8
21% better than State average

State average: 20.1

Long-stay resident measures
Need for Help with Daily Activities Increased Info Percent of long-stay residents whose need for help with daily activities has increased 10.2%
35% better than State average

State average: 15.7%

Walking Ability Worsened Info Percent of long-stay residents whose ability to move independently worsened 16.6%
22% better than State average

State average: 21.3%

Low Risk Residents with Bowel/Bladder Incontinence Info Percent of low risk long-stay residents who lose control of their bowels or bladder 20.5%
11% better than State average

State average: 23.1%

Falls with Major Injury Info Percent of long-stay residents experiencing one or more falls with major injury 0.0%
100% better than State average

State average: 2.6%

High Risk Residents with Pressure Ulcers Info Percent of long-stay high risk residents with pressure ulcers 4.4%
5% worse than State average

State average: 4.2%

Urinary Tract Infection Info Percent of long-stay residents with a urinary tract infection 0.4%
80% better than State average

State average: 2.1%

Lost Too Much Weight Info Percent of long-stay residents who lose too much weight 1.3%
67% better than State average

State average: 4.1%

Depressive Symptoms Info Percent of long-stay residents who have depressive symptoms 7.5%
55% better than State average

State average: 16.5%

Antipsychotic Use Info Percent of long-stay residents who received an antipsychotic medication 4.5%
67% better than State average

State average: 13.5%

Pneumococcal Vaccine Info Percent of long-stay residents assessed and appropriately given the pneumococcal vaccine 93.4%
In line with State average

State average: 97.1%

Influenza Vaccine Info Percent of long-stay residents assessed and appropriately given the seasonal influenza vaccine 100.0%
In line with State average

State average: 98.0%

Short-stay resident measures
Pneumococcal Vaccine Info Percent of short-stay residents assessed and appropriately given the pneumococcal vaccine 96.2%
In line with State average

State average: 92.9%

Antipsychotic medication increase Info Percent of short-stay residents who newly received an antipsychotic medication 1.0%
8% better than State average

State average: 1.1%

Influenza Vaccine Info Percent of short-stay residents assessed and appropriately given the seasonal influenza vaccine 95.4%
5% better than State average

State average: 91.0%

Breakdown by payment type

Medicare

10% of new residents, usually for short-term rehab.

Typical stay 29 days

Private pay

81% of new residents, often for short stays.

Typical stay 26 days

Medicaid

9% of new residents, often for long-term daily care.

Typical stay 2 years

Facility Characteristics

Source: CMS Long-Term Care Facility Characteristics (Data as of Jan 2026)

Total residents 74
Medicare
15
20.3% of residents
Medicaid
52
70.3% of residents
Private pay or other
7
9.5% of residents
Programs & Services
Residents Group

Residents meet regularly to discuss policies, care quality, and activities

Active Resident Council

Organized group of residents that meets regularly to discuss facility policies, quality of life, and activities.

Finances and operations

Based on CMS SNF Cost Report for fiscal year ending in 06/2024.

For-profit
Corporation
Net patient revenue Info Net patient revenue — what the home actually collects for resident care, after contractual allowances, bad debt and discounts are subtracted from its gross charges (CMS cost report, Worksheet G-3). It covers resident care only; money the home earns from other sources is shown separately as "Other income."
$10.2M
Net patient income Info Net patient income: net patient revenue minus the home's total operating expenses. A positive figure means it earns more from resident care than it spends to deliver it; a negative figure means the opposite. It excludes non-operating "other income."
$954.1K
For-profit Corporation
Net patient revenue Info Net patient revenue — what the home actually collects for resident care, after contractual allowances, bad debt and discounts are subtracted from its gross charges (CMS cost report, Worksheet G-3). It covers resident care only; money the home earns from other sources is shown separately as "Other income."
$10.2M Rank #30 / 77Revenue — State benchmarkedThis home is ranked 30th out of 77 homes in Utah. Shows this facility's annual revenue compared to the Utah average. Higher revenue generally means more resources for staffing and capital — read alongside Payroll %.Rankings are based only on facilities in Utah that report data for that category. Facilities without available data are excluded from the ranking.Click the rank badge to see the full State ranking.Click here to see the full State ranking.
Net patient income Info Net patient income: net patient revenue minus the home's total operating expenses. A positive figure means it earns more from resident care than it spends to deliver it; a negative figure means the opposite. It excludes non-operating "other income."
$954.1K
Other income Info Money the home earns outside of resident care — such as investments, grants, rentals and other non-operating sources (CMS cost report, Worksheet G-3). It is tracked separately from net patient revenue: it is not part of that figure, and it is not included in net patient income.
$2.7K
Payroll costs Info Staff salaries plus wage-related costs — benefits such as payroll taxes, health insurance and retirement — from the home's own accounting records (CMS cost report, Worksheet A). Contract or agency labor is counted separately, under other operating costs. Rank #24 / 77Payroll — State benchmarkedThis home is ranked 24th out of 77 homes in Utah. Shows total annual staff payroll benchmarked to the Utah average. Higher payroll investment relative to peers often signals better staffing and less reliance on cheaper contract labor.Rankings are based only on facilities in Utah that report data for that category. Facilities without available data are excluded from the ranking.Click the rank badge to see the full State ranking.Click here to see the full State ranking.
$6.0M 58.7% of net patient revenue Info Payroll as a share of revenue: staff salaries and wage-related benefits divided by net patient revenue. A higher figure means more of each revenue dollar goes to staff pay. Rank #16 / 77Payroll % — State benchmarkedThis home is ranked 16th out of 77 homes in Utah. Shows payroll as a percentage of revenue versus the Utah average. Well-run Utah facilities typically land around 52–58% — the top third Statewide. Below 25% may signal understaffing or heavy agency use — read with Staffing ratings.Rankings are based only on facilities in Utah that report data for that category. Facilities without available data are excluded from the ranking.Click the rank badge to see the full State ranking.Click here to see the full State ranking.
Other operating costs Info Everything it costs to run the home apart from payroll — food, utilities, supplies, maintenance, contract labor and administration. Calculated as total operating expense minus payroll (staff salaries and wage-related benefits).
$3.3M
Total costs Info The home's total operating expense for the year — all the costs of running it, salaries included (CMS cost report, Worksheet G-3).
$9.3M

Who this home usually serves

TYPE OF STAY

Primarily short stays

Residents typically stay for brief periods, with frequent admissions and discharges throughout the year.

Most new residents arrive under private pay (81% of admissions), and a typical private pay stay runs around 26 days.

Admissions
326 total

Coverage residents most often arrive under.

Medicare 10%
Private pay 81%
Medicaid 9%
Discharges
320 total

Coverage residents most often leave under.

Medicare 8%
Private pay 82%
Medicaid 10%

Places of interest near Elevate Home Health & Hospice, LLC

Address 0.2 miles from city center Info Estimated distance in miles from Price's city center to Elevate Home Health & Hospice, LLC's address, calculated via Google Maps.

Calculate Travel Distance to Elevate Home Health & Hospice, LLC

Add your location

Address

Compare Nursing Homes around the area

Elevate Home Health & Hospice, LLC
NH
HC
Price -120 - 70 -
Rocky Mountain Care – Hunter Hollow
NH
HC
NC
West Valley City (Pioneer Parkway) -124 - 67 Private Rooms / Semi-Private Rooms
Sunshine Terrace Skilled Nursing
NH
AL
HC
MC
NC
RC
Logan -172 - 85 -
Rocky Mountain Care – Clearfield
NH
AL
HC
PC
Clearfield -168 - 57 -

Frequently Asked Questions about Elevate Home Health & Hospice, LLC

What neighborhood is Elevate Home Health & Hospice, LLC in?

Elevate Home Health & Hospice, LLC is in the Price neighborhood.

Is Elevate Home Health & Hospice, LLC in a walkable area?

Elevate Home Health & Hospice, LLC has a walk score of 70. Very walkable. Most errands can be accomplished on foot, and many essentials are within a short walk.

What is the occupancy rate at Elevate Home Health & Hospice, LLC?

Elevate Home Health & Hospice, LLC's occupancy is 63.8%.

Does Elevate Home Health & Hospice, LLC operate as a for-profit or non-profit?

Elevate Home Health & Hospice, LLC is registered as a for-profit.

Are there photos of Elevate Home Health & Hospice, LLC?

Yes — there are 5 photos of Elevate Home Health & Hospice, LLC in the photo gallery on this page.

What is the address of Elevate Home Health & Hospice, LLC?

Elevate Home Health & Hospice, LLC is located at 88 East 100 South, Price, UT 84501.

What is the phone number of Elevate Home Health & Hospice, LLC?

(435) 637-1250 will put you in contact with the team at Elevate Home Health & Hospice, LLC.

Guides for Better Senior Living

Care Cost Calculator: See Prices in Your Area

Nursing Home Data Explorer

Don’t Wait Too Long: 7 Red Flag Signs Your Parent Needs Assisted Living Now

The True Cost of Assisted Living in 2025 – And How Families Are Paying For It

Understanding Senior Living Costs: Pricing Models, Discounts & Financial Assistance