


Fernbrook Manor
Fernbrook Manor
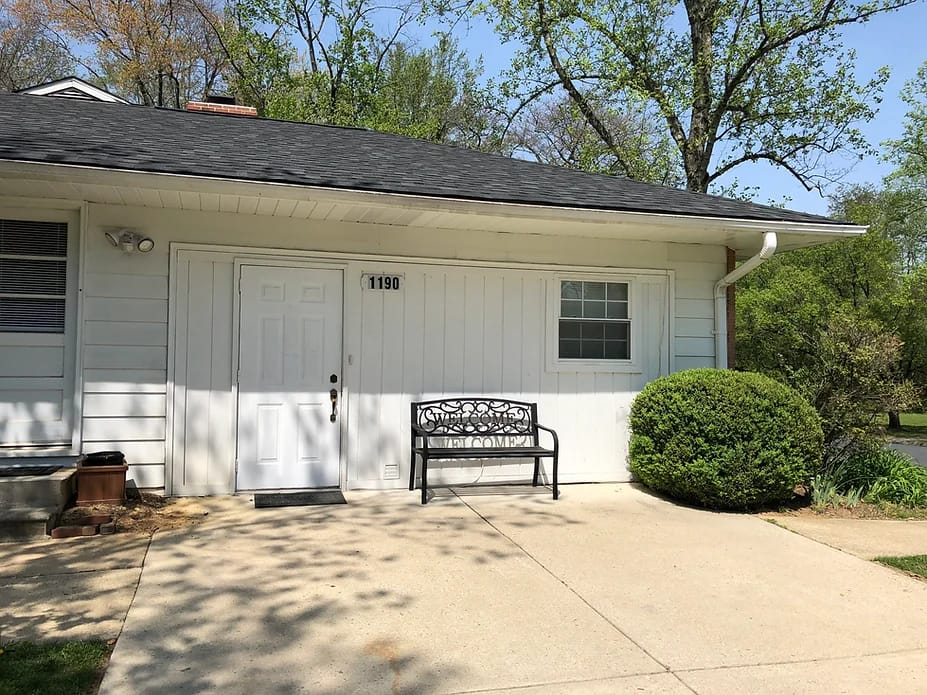
Fernbrook Manor is a tightly-knit elder care home that provides healthcare services. The center boasts a modest, warm, and welcoming atmosphere for its residents. The home-like atmosphere creates a comfortable and well-managed resident-focused senior assisted living environment.
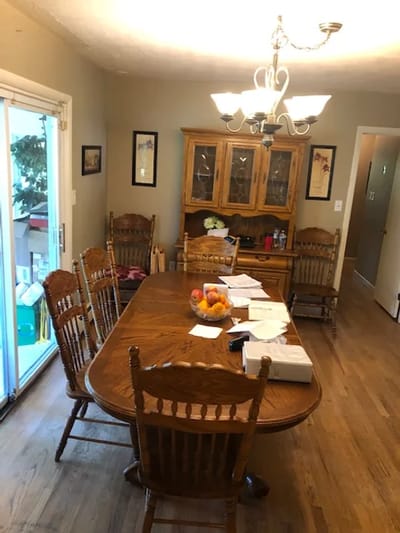
Fernbrook Manor provides comprehensive services that have a proportionate staff-to-resident ratio, with an activity director on-site, physician visits, a podiatrist, and a hairdresser available. Essential amenities include housekeeping, laundry, medication management, nutritional meals served daily, transportation services, and stimulating assisted living activities planned.
14-bed community Rank #297 / 697Bed count — State benchmarkedThis home is ranked 297th out of 697 homes in Maryland for bed count. Shows this facility's certified or reported bed count compared to other Maryland SNFs. Larger communities may offer more amenities, programs, and on-site services for residents and families.Click the rank badge to see the full State ranking.Click here to see the full State ranking.
A smaller, more intimate setting that may offer a quieter environment and closer staff-resident interactions.
39 years in operation Rank #12 / 208Years in operation — State benchmarkedThis home is ranked 12th out of 208 homes in Maryland for years in operation. Shows how long this facility has been in operation compared to other Maryland SNFs. Longer operating histories may benefit residents, families, and staff.Click the rank badge to see the full State ranking.Click here to see the full State ranking.
A longer operating history, which may indicate experience navigating regulations and delivering ongoing care.
Walk Score: 45 / 100 Rank #475 / 985Walk Score — State benchmarkedThis home is ranked 475th out of 985 homes in Maryland for walk score. Shows how walkable this facility's neighborhood is compared to the average Walk Score across Maryland SNFs. Higher scores benefit residents, families, and staff.Click the rank badge to see the full State ranking.Click here to see the full State ranking.
Somewhat walkable. A few nearby services may be reachable on foot, but most trips require transportation.
About this community
Facility TypeSole Proprietorship
CountyAnne Arundel
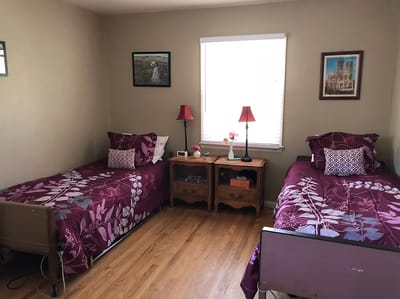
Semi-Private Room
$70 - $75 per day
Hospice Affiliations
Staffing
Key information about the people who lead and staff this community.
No CNA training program
Mild Alzheimer's Level
Moderate Alzheimer's Level
Severe Alzheimer's Level
Demographics
Resident demographic information for this facility.
Gender
- Female 40%
- Male 60%
Age Distribution
- 65-74 60%
- 75-84 20%
- 85-94 10%
- ≤64 10%
Ethnicity
- White 90%
- Hispanic 10%
Infection Prevention & Vaccination
How this facility protects residents through staff vaccination policies and immunization practices.
Influenza Gold Star
Awarded by the Maryland Health Care Commission (MHCC) to healthcare facilities that achieve a high influenza vaccination rate.
Mandatory Vaccination Policy
The facility requires certain vaccinations for staff as part of its infection prevention measures.
Mandatory COVID Policy
The facility requires COVID-19 vaccination for staff.
What does this home offer?
Pets Allowed
Building Type: Single-story
Transportation Services
Fitness and Recreation
Places of interest near Fernbrook Manor
![]() 1.2 miles from city center
1.2 miles from city center
![]() Estimated distance in miles from Odenton's city center to Fernbrook Manor's address, calculated via Google Maps.
— 10.13 miles to nearest hospital (Fresenius Medical Care at Anne Arundel Medical Center)
Estimated distance in miles from Odenton's city center to Fernbrook Manor's address, calculated via Google Maps.
— 10.13 miles to nearest hospital (Fresenius Medical Care at Anne Arundel Medical Center)
Calculate Travel Distance to Fernbrook Manor
Add your location
Financial Assistance for
Assisted Living in Maryland
Fernbrook Manor is located in Odenton, Maryland.
Here are the financial assistance programs available to residents in Maryland.
Compare Assisted Living around Odenton
The information below is reported by the Maryland Department of Health, Office of Health Care Quality.
Filter by care type
| Homestead Manor Assisted Living |
NH Nursing Home Licensed facility providing 24/7 skilled nursing care for residents with complex, ongoing medical needs. Staffed by RNs, LPNs, and CNAs. Inspected and star-rated annually by CMS. Accepts Medicare (short-term rehab) and Medicaid (long-term care).
AL Assisted Living A licensed, long-term care setting for seniors or individuals with disabilities who need help with daily activities — like bathing, dressing, and medication management — but not 24-hour skilled nursing. Offers housing, meals, and around-the-clock support while aiming to maximize resident independence. | Denton (Colonial Drive) | 100
Facility
100
MD AVG
44
Rank
#120 / 697 | Yes |
4
Facility
4
MD AVG
43
Rank
#916 / 985 | - | - | - | - | - | - | - | - | - | - |
| Heart Homes at Piney Orchard |
AL Assisted Living A licensed, long-term care setting for seniors or individuals with disabilities who need help with daily activities — like bathing, dressing, and medication management — but not 24-hour skilled nursing. Offers housing, meals, and around-the-clock support while aiming to maximize resident independence.
MC Memory Care Secured, specialized care for people living with Alzheimer's or dementia. Staff trained in cognitive impairment, with higher staff-to-resident ratios and an environment designed to reduce confusion and wandering risk. | Odenton (The Vineyards At Piney Orchard) | 16
Facility
16
MD AVG
44
Rank
#260 / 697 | Yes |
66
Facility
66
MD AVG
43
Rank
#240 / 985 | - | 29
Facility
29
MD AVG
21
Rank
#48 / 208 |
23% Male Residents — State Benchmarked 23% of residents are male, compared to the Maryland average of 31%. This facility caters to a majority female resident pool (77% female), consistent with the broader assisted living trend where women significantly outnumber men. |
77% Female Residents — State Benchmarked 77% of residents are female, compared to the Maryland average of 69%. Women comprise the large majority, consistent with national assisted living demographics where women live longer and enter care facilities at higher rates. |
100% White Residents — State Benchmarked 100% of residents are reported as White, compared to the Maryland average of 81%. A higher White share than is typical for assisted living in Maryland in this dataset — compare with peer facilities for local context. |
0% Other Ethnicity Residents — State Benchmarked 0% of residents fall into categories other than White or African American (combined), compared to the Maryland average of 6%. This column aggregates Hispanic, Asian, multiracial, and any other labeled groups that are not classified as White or African American. |
15% Residents Age 65–74 — State Benchmarked 15% of residents are 65–74, compared to the Maryland average of 13%. In line with the statewide profile for this youngest senior bracket in assisted living. |
15% Residents Age 75–84 — State Benchmarked 15% of residents are 75–84, compared to the Maryland average of 31%. Below the state norm — the resident mix may skew either younger or older than this typical middle bracket. |
62% Residents Age 85–94 — State Benchmarked 62% of residents are 85–94, compared to the Maryland average of 44%. A high concentration of very elderly residents signals a higher-acuity facility with experience caring for advanced age-related needs. |
8% Residents Age 95+ — State Benchmarked 8% of residents are 95 or older, compared to the Maryland average of 16%. Most residents here have not yet reached the oldest-old bracket, suggesting a younger overall community. |
| Arcadia of Denton II |
AL Assisted Living A licensed, long-term care setting for seniors or individuals with disabilities who need help with daily activities — like bathing, dressing, and medication management — but not 24-hour skilled nursing. Offers housing, meals, and around-the-clock support while aiming to maximize resident independence. | Denton | 16
Facility
16
MD AVG
44
Rank
#260 / 697 | Yes |
49
Facility
49
MD AVG
43
Rank
#431 / 985 | - | 5
Facility
5
MD AVG
21
Rank
#182 / 208 |
38% Male Residents — State Benchmarked 38% of residents are male, compared to the Maryland average of 31%. This facility caters to a majority female resident pool (62% female), consistent with the broader assisted living trend where women significantly outnumber men. |
62% Female Residents — State Benchmarked 62% of residents are female, compared to the Maryland average of 69%. Closer to an even gender split than most assisted living facilities, which typically have 65–75% female residents. |
100% White Residents — State Benchmarked 100% of residents are reported as White, compared to the Maryland average of 81%. A higher White share than is typical for assisted living in Maryland in this dataset — compare with peer facilities for local context. |
0% Other Ethnicity Residents — State Benchmarked 0% of residents fall into categories other than White or African American (combined), compared to the Maryland average of 6%. This column aggregates Hispanic, Asian, multiracial, and any other labeled groups that are not classified as White or African American. |
8% Residents Age 65–74 — State Benchmarked 8% of residents are 65–74, compared to the Maryland average of 13%. Fewer younger seniors suggests the resident population skews older, likely requiring higher acuity care and more hands-on support. |
62% Residents Age 75–84 — State Benchmarked 62% of residents are 75–84, compared to the Maryland average of 31%. A high concentration in this mid-range bracket, where residents typically need moderate support with daily activities. |
15% Residents Age 85–94 — State Benchmarked 15% of residents are 85–94, compared to the Maryland average of 44%. The population here skews younger than the statewide norm, which may indicate a more active, lower-acuity community. |
15% Residents Age 95+ — State Benchmarked 15% of residents are 95 or older, compared to the Maryland average of 16%. In line with the statewide profile for the oldest resident bracket. |
| Fernbrook Manor |
AL Assisted Living A licensed, long-term care setting for seniors or individuals with disabilities who need help with daily activities — like bathing, dressing, and medication management — but not 24-hour skilled nursing. Offers housing, meals, and around-the-clock support while aiming to maximize resident independence. | Odenton (Maple Ridge) | 14
Facility
14
MD AVG
44
Rank
#297 / 697 | Yes |
45
Facility
45
MD AVG
43
Rank
#475 / 985 | - | 39
Facility
39
MD AVG
21
Rank
#12 / 208 |
60% Male Residents — State Benchmarked 60% of residents are male, compared to the Maryland average of 31%. An unusually high male share for assisted living, where most facilities skew heavily female. |
40% Female Residents — State Benchmarked 40% of residents are female, compared to the Maryland average of 69%. An unusually low female share — most assisted living facilities have 65–75% female residents. |
90% White Residents — State Benchmarked 90% of residents are reported as White, compared to the Maryland average of 81%. A higher White share than is typical for assisted living in Maryland in this dataset — compare with peer facilities for local context. |
10% Other Ethnicity Residents — State Benchmarked 10% of residents fall into categories other than White or African American (combined), compared to the Maryland average of 6%. This column aggregates Hispanic, Asian, multiracial, and any other labeled groups that are not classified as White or African American. Reported subgroups in this total: Hispanic (10%). |
60% Residents Age 65–74 — State Benchmarked 60% of residents are 65–74, compared to the Maryland average of 13%. A higher share of younger seniors often signals a more independent, active resident community with lower acuity care needs. |
20% Residents Age 75–84 — State Benchmarked 20% of residents are 75–84, compared to the Maryland average of 31%. Below the state norm — the resident mix may skew either younger or older than this typical middle bracket. |
10% Residents Age 85–94 — State Benchmarked 10% of residents are 85–94, compared to the Maryland average of 44%. The population here skews younger than the statewide norm, which may indicate a more active, lower-acuity community. | - |
| Royal Assisted Living Inc |
AL Assisted Living A licensed, long-term care setting for seniors or individuals with disabilities who need help with daily activities — like bathing, dressing, and medication management — but not 24-hour skilled nursing. Offers housing, meals, and around-the-clock support while aiming to maximize resident independence. | Odenton (Bonaventure) | 5
Facility
5
MD AVG
44
Rank
#436 / 697 | No |
62
Facility
62
MD AVG
43
Rank
#286 / 985 | - | - |
0% Male Residents — State Benchmarked 0% of residents are male, compared to the Maryland average of 31%. This facility caters to a majority female resident pool (100% female), consistent with the broader assisted living trend where women significantly outnumber men. |
0% Female Residents — State Benchmarked 0% of residents are female, compared to the Maryland average of 69%. An unusually low female share — most assisted living facilities have 65–75% female residents. | - | - | - | - | - | - |
Frequently Asked Questions about Fernbrook Manor
What neighborhood is Fernbrook Manor in?
Fernbrook Manor is in the Maple Ridge neighborhood of MD 21113.
Is Fernbrook Manor in a walkable area?
Fernbrook Manor has a walk score of 45. Somewhat walkable. A few nearby services may be reachable on foot, but most trips require transportation.
How many beds does Fernbrook Manor have?
Fernbrook Manor has 14 beds.
Are there photos of Fernbrook Manor?
Yes — there are 4 photos of Fernbrook Manor in the photo gallery on this page.
What is the phone number of Fernbrook Manor?
(443) 413-4146 will put you in contact with the team at Fernbrook Manor.
What county is Fernbrook Manor located in?
Fernbrook Manor is in Anne Arundel County.
Is Fernbrook Manor Medicare or Medicaid certified?
Fernbrook Manor is not currently listed as a CMS-certified provider of Medicare or Medicaid.
Guides for Better Senior Living
Care Cost Calculator: See Prices in Your Area
Nursing Home Data Explorer
Don’t Wait Too Long: 7 Red Flag Signs Your Parent Needs Assisted Living Now
The True Cost of Assisted Living in 2025 – And How Families Are Paying For It
Understanding Senior Living Costs: Pricing Models, Discounts & Financial Assistance
Contact Us

Published on
Updated on
Feedback
Write a review for Fernbrook Manor
Rate your overall experience with this community
Explore Open Rooms
1
Contact details
2
What type of senior care service are you looking for?
3
What budget do you have in mind for senior care?
4
How soon do you need to find care?
5
Additional details
Thank you for your interest!
Our team will be in touch shortly to help with next steps.
Need Help?
Let us help you or a loved one find the perfect senior home.
