

Total health inspections
3
Connecticut average 5.7
Last Health inspection on Aug 2024

We arrange tours, appointments, and even moving support so you don’t have to
Filosa Nursing Home and Rehabilitation Center in Danbury is where a vibrant lifestyle surrounds its residents. The upscale community creates an open space for seniors to live on their terms and where dedicated professionals are more than willing to follow through with the resident’s needs– whatever they may be. Filosa maintains an active lifestyle where endless possibilities await exploring.
Specializing in short-term rehabilitation long-term care, the nursing home services are centered on meeting the holistic wellness of each resident. Seniors can immerse themselves in comprehensive services that help with recovery and relaxation– specialized programs, social activities, and professional rehabilitative services for short-term respite stays.
 Official CMS rating based on health inspections, staffing and quality measures.
Official CMS rating based on deficiencies found during state health inspections.
Official CMS rating based on nurse staffing hours per resident per day.
Official CMS rating based on clinical outcomes for residents.
Average daily nursing hours per resident (adjusted for acuity). Higher values indicate more nursing time per resident.
Hours of care per resident per day, broken down by staff type. Data from CMS Medicare.
Registered nurse hours per resident per day.
Nurse aide hours per resident per day.
Total number of nurse staff hours per resident per day on weekends.
Physical therapist staff hours per resident per day.
Registered nurse hours per resident per day on weekends.
Official CMS rating based on health inspections, staffing and quality measures.
Official CMS rating based on deficiencies found during state health inspections.
Official CMS rating based on nurse staffing hours per resident per day.
Official CMS rating based on clinical outcomes for residents.
Average daily nursing hours per resident (adjusted for acuity). Higher values indicate more nursing time per resident.
Hours of care per resident per day, broken down by staff type. Data from CMS Medicare.
Registered nurse hours per resident per day.
Nurse aide hours per resident per day.
Total number of nurse staff hours per resident per day on weekends.
Physical therapist staff hours per resident per day.
Registered nurse hours per resident per day on weekends.
May offer a more intimate, personalized care environment.
Occupancy is moderate, suggesting balanced demand.
Most residents typically stay for a few weeks or months before returning home or moving on.
91% of new residents, usually for short-term rehab.
6% of new residents, often for short stays.
3% of new residents, often for long-term daily care.
The portion of the home's budget spent on staff, including nurses, caregivers, and other employees who support care and operations.
All remaining costs needed to run the home, such as food, utilities, building maintenance, supplies and administrative expenses.
In Connecticut, the Department of Public Health, Facility Licensing and Investigations Section conducts mandatory inspections and unannounced surveys to monitor the quality of care in long-term facilities.
Connecticut average: 13 visits/inspections
Connecticut average 5.7
Last Health inspection on Aug 2024
Health citations are formal notices following inspections when they fail to comply with safety and care standards.
All 16 citations resulted from standard inspections.
Connecticut average: 0.3
Connecticut average: 0.7
Data sourced from CMS Health Deficiencies reports. Citation severity codes range from A (least serious) to L (most serious). Immediate Jeopardy (J-L) citations indicate situations where the facility's noncompliance has placed residents at risk of death or serious harm.
Assisted Living For seniors needing help with daily tasks but not full-time nursing.
Independent Living For self-sufficient seniors seeking community and minimal assistance.
Memory Care Specialized care for those with Memory Loss, Alzheimer's, or dementia, ensuring safety and support.
Nursing Homes 24/7 care needed
Nursing Home 24/7 care needed
Assisted Living For seniors needing help with daily tasks but not full-time nursing.
Nursing Home 24/7 care needed
Assisted Living For seniors needing help with daily tasks but not full-time nursing.
Nursing Home 24/7 care needed
Assisted Living For seniors needing help with daily tasks but not full-time nursing.
Nursing Home 24/7 care needed
Assisted Living For seniors needing help with daily tasks but not full-time nursing.
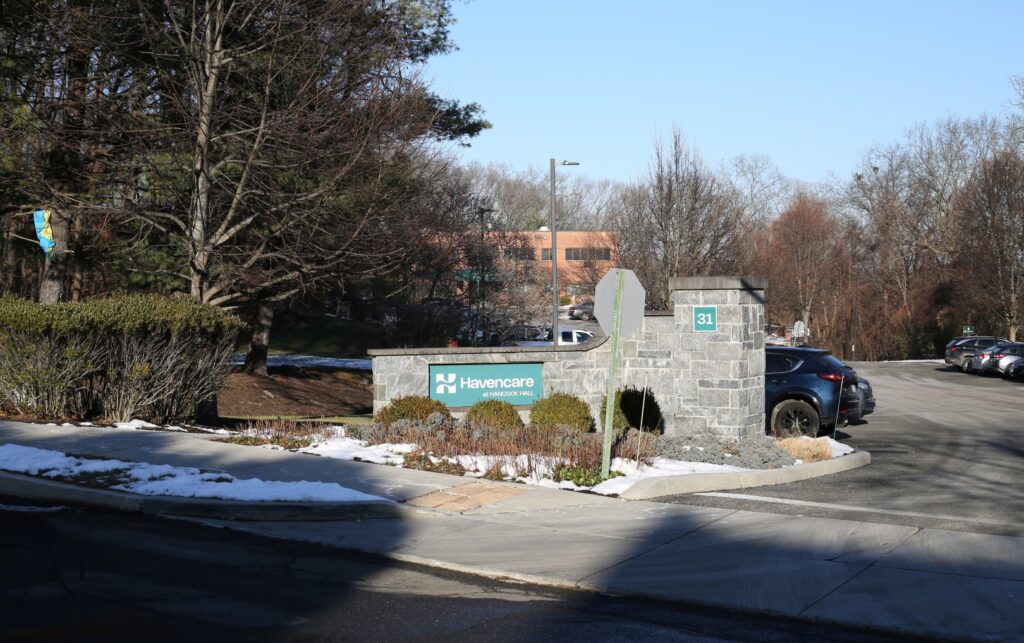 Hancock Hall
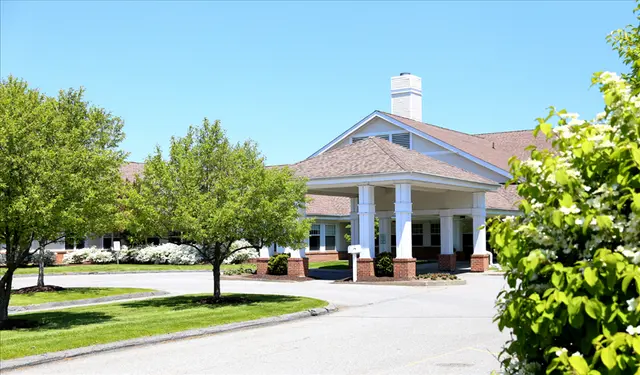
Filosa Nursing Home and Rehabilitation Center
Hancock Hall
Filosa Nursing Home and Rehabilitation Center 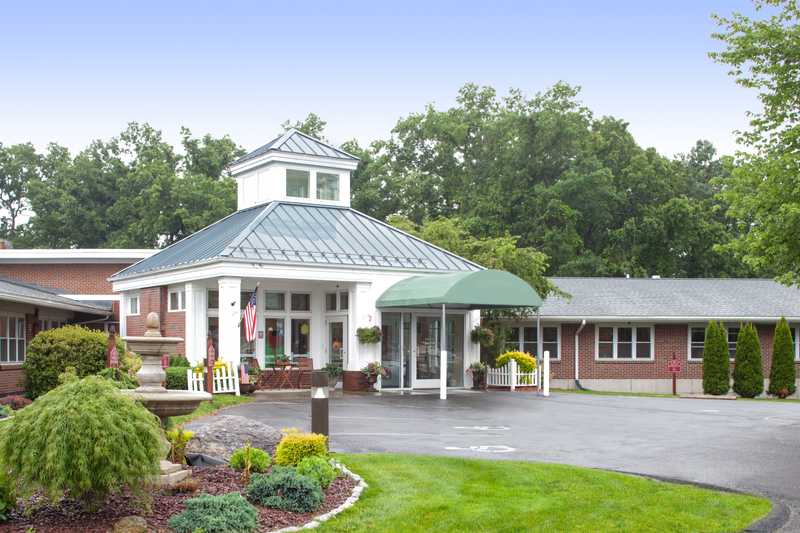 Glen Hill Center
 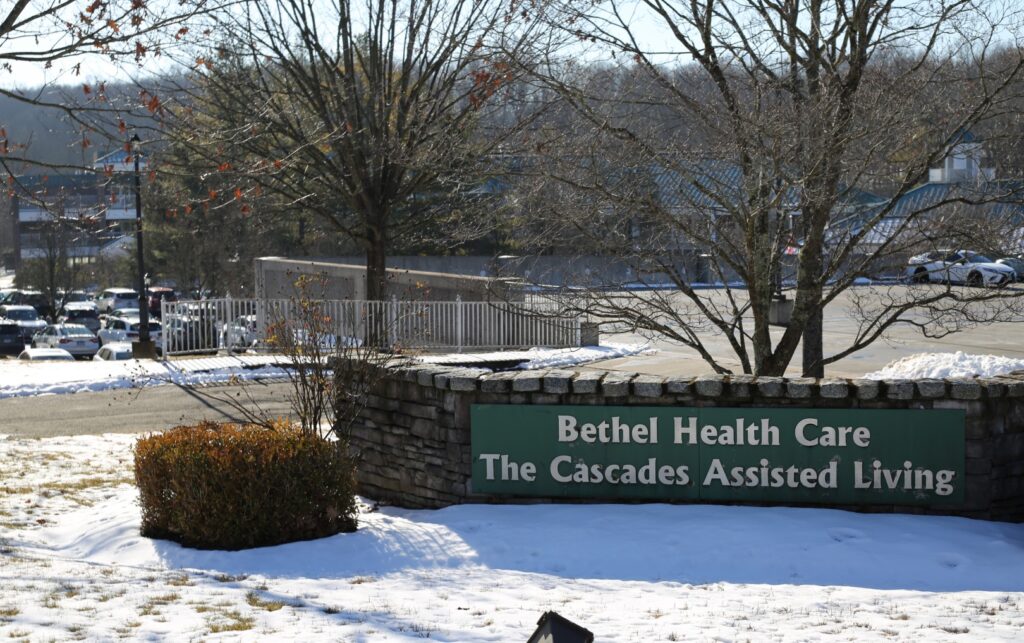 Bethel Health Care Center
  Civita Care Center at Danbury
![]() 1.4 miles from city center — 9.86 miles to nearest hospital (Hospital Plaza)
1.4 miles from city center — 9.86 miles to nearest hospital (Hospital Plaza)
![]() 13 Hakim St, Danbury, CT 06810
13 Hakim St, Danbury, CT 06810
Add your location
Source: CMS Payroll-Based Journal (Q2 2025)
| Role ⓘ | Count ⓘ | Avg Shift (hrs) ⓘ | Uses Contractors? ⓘ |
|---|---|---|---|
| Registered Nurse | 15 | 7 | Yes |
| Licensed Practical Nurse | 25 | 8.3 | Yes |
| Certified Nursing Assistant | 57 | 7.9 | Yes |
| Role ⓘ | Employees ⓘ | Contractors ⓘ | Total Staff ⓘ | Total Hours ⓘ | Days Worked ⓘ | % of Days ⓘ | Avg Shift (hrs) ⓘ |
|---|---|---|---|---|---|---|---|
| Certified Nursing Assistant | 45 | 12 | 57 | 11,666 | 91 | 100% | 7.9 |
| Licensed Practical Nurse | 13 | 12 | 25 | 4,685 | 91 | 100% | 8.3 |
| Registered Nurse | 14 | 1 | 15 | 3,114 | 91 | 100% | 7 |
| Clinical Nurse Specialist | 3 | 0 | 3 | 1,206 | 66 | 73% | 8 |
| Other Social Services Staff | 6 | 0 | 6 | 1,099 | 90 | 99% | 8 |
| Speech Language Pathologist | 0 | 3 | 3 | 525 | 59 | 65% | 6.3 |
| Physical Therapy Aide | 0 | 3 | 3 | 488 | 62 | 68% | 7.7 |
| Nurse Practitioner | 1 | 0 | 1 | 455 | 57 | 63% | 8 |
| Administrator | 1 | 0 | 1 | 439 | 55 | 60% | 8 |
| Mental Health Service Worker | 1 | 0 | 1 | 414 | 52 | 57% | 8 |
| Respiratory Therapy Technician | 0 | 4 | 4 | 318 | 50 | 55% | 6.2 |
| Physical Therapy Assistant | 0 | 6 | 6 | 294 | 53 | 58% | 5.4 |
| Qualified Social Worker | 0 | 2 | 2 | 204 | 54 | 59% | 3.8 |
Source: CMS Long-Term Care Facility Characteristics (Data as of Jan 2026)
Residents meet regularly to discuss policies, care quality, and activities
Organized group of residents that meets regularly to discuss facility policies, quality of life, and activities.
Data sourced from CMS Long-Term Care Facility Characteristics quarterly report. Payer mix reflects the current resident census by primary payment source.
These measures show how residents usually do over time at this home, based on health outcomes and preventive care.
Connecticut average: 10.4
Connecticut average: 21.1
Connecticut average: 18.9%
Connecticut average: 19.2%
Connecticut average: 24.9%
Connecticut average: 3.5%
Connecticut average: 4.6%
Connecticut average: 1.7%
Connecticut average: 6.3%
Connecticut average: 15.2%
Connecticut average: 17.2%
Connecticut average: 87.5%
Connecticut average: 93.5%
Connecticut average: 2.10
Connecticut average: 1.53
Connecticut average: 70.1%
Connecticut average: 1.5%
Connecticut average: 69.8%
Connecticut average: 25.0%
Connecticut average: 11.1%
Connecticut average: 0.8%
Connecticut average: 53.7%
Connecticut average: 50.6%
Quality measures are calculated from Minimum Data Set (MDS) assessments. For most measures, lower percentages indicate better care quality.
Historical financial and operational data for Filosa Nursing Home and Rehabilitation Center based on CMS SNF Cost Reports.
Loading trend charts...
Care Cost Calculator: See Prices in Your Area
Nursing Home Data Explorer
Don’t Wait Too Long: 7 Red Flag Signs Your Parent Needs Assisted Living Now
The True Cost of Assisted Living in 2025 – And How Families Are Paying For It
Understanding Senior Living Costs: Pricing Models, Discounts & Financial Assistance

Touring a community? Use this expert-backed checklist to stay organized, ask the right questions, and find the perfect fit.
We'll send you a PDF version of the touring checklist.


