Fountain View Health and Rehabilitation

Nursing Home in Colorado Springs

CMS overall rating Info The Overall CMS Rating combines results from health inspections, staffing levels and quality measures. Health inspections carry the most weight. Staffing and quality scores can increase or decrease the final rating based on performance compared to state and national standards.

Overview of Fountain View Health and Rehabilitation

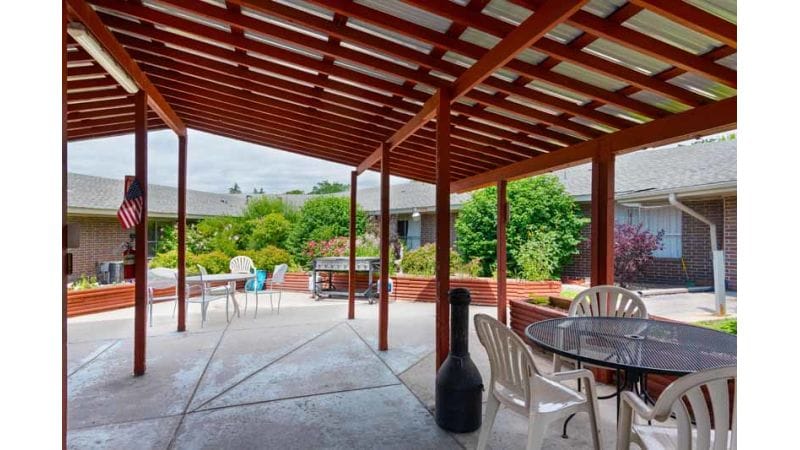
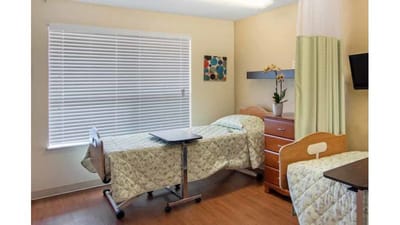
Find the care you need at Fountain View Health & Rehabilitation, an exceptional community in Colorado Springs, CO, offering skilled nursing and rehabilitation. Residents can keep their peace of mind with a kind and highly trained team providing high-quality care for their unique needs around the clock. With purposely built and secure accommodations, older adults are guaranteed the utmost comfort and safety.

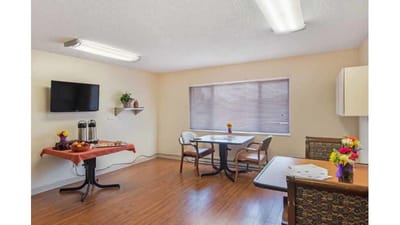
Recreational activities and enriching programs are conducted to keep residents active and improve their emotional well-being. Mealtimes are also something to look forward to, with delicious and healthy dining options that cater to their dietary needs and preferences. Physical, occupational, and speech therapy are also conducted to enhance residents’ living experiences. The community’s comprehensive care and state-of-the-art amenities create the ideal setting for residents to thrive in their golden years.

(719) 473-8000

Quality ratings

Measured by Centers for Medicare & Medicaid Services (CMS)

Overall rating Info The Overall CMS Rating combines results from health inspections, staffing levels and quality measures. Health inspections carry the most weight. Staffing and quality scores can increase or decrease the final rating based on performance compared to state and national standards.
3/5 ▼ 0.1 Colorado average: 3.1/5
Health Inspection Info Based on the results of the facility's three most recent standard inspections and any complaint investigations. CMS reviews the number, scope, and severity of deficiencies, with more recent findings weighted more heavily.
3/5 ▲ 0.2 Colorado average: 2.8/5
Staffing Info Measures average nursing staff hours per resident per day, including Registered Nurses (RNs) and total nursing staff. Ratings are adjusted based on the level of care residents require and are compared to state and national benchmarks.
1/5 ▼ 2.0 Colorado average: 3.0/5
Quality Measures Info Based on clinical and physical health indicators reported to CMS, such as hospital readmissions, falls, pressure ulcers, and improvements in mobility. These measures reflect how well residents' health needs are being managed.
5/5 ▲ 0.9 Colorado average: 4.1/5

Staffing hours breakdown

Info Daily nursing hours per resident by staff type, reported to CMS. Higher is generally better — compare this facility to state and national averages to see where staffing stands.

Hours per resident per day — compared to Colorado state averages

Total nursing care / resident Info Total adjusted nursing hours per resident per day, combining RN, LPN, and aide time. CMS adjusts this for case-mix so facilities can be fairly compared.
2h 41m per day
This facility Colorado avg (3h 52m per day)
vs Colorado avg
-31%

3 of 5 metrics below state avg

Standout metric RN (Weekend) is +11% above state avg
Staff typeHours / dayvs state avg
Registered Nurse (RN) Info RNs hold the highest nursing license and can assess residents, interpret test results, and direct care plans. More RN hours per day often signals stronger clinical oversight and faster response to health changes. 51m per day ■ Avg State avg: 50m per day · National avg: 41m per day
Nurse Aide Info Certified Nurse Aides (CNAs) provide the most direct day-to-day assistance: bathing, dressing, feeding, and mobility. Nurse aide hours are typically the largest staffing category and directly affect residents' quality of life. 1h 51m per day ▼ 17% State avg: 2h 13m per day · National avg: 2h 21m per day
Total Nursing (Weekend) Info Combined nursing hours (RN + LPN + Nurse Aide) per resident per day on weekends. Staffing often drops on weekends — this figure reveals whether the facility maintains adequate coverage outside of weekday hours. 2h 42m per day ▼ 18% State avg: 3h 17m per day · National avg: 3h 26m per day
Physical Therapist Info Hours per resident per day provided by licensed Physical Therapists (PTs) or PT Assistants. PT services help residents recover mobility after injury or illness and are especially important for post-acute (short-stay) rehabilitation. 3m per day ▼ 40% State avg: 5m per day · National avg: 4m per day
RN (Weekend) Info Registered nurse hours specifically on weekends. Facilities sometimes reduce RN presence on Saturdays and Sundays — a low weekend RN figure compared to weekday hours can indicate reduced clinical oversight when most administrative staff are absent. 40m per day ▲ 11% State avg: 36m per day · National avg: 29m per day

Capacity and availability

Medium-capacity home

Offers a balance of services and community atmosphere.

Total beds 118

This home usually has limited availability

Occupancy is moderate, suggesting balanced demand.

Similar demand to the Colorado average: 76.5%
Occupancy rate 91.5%
Avg. Length of Stay 266 days
Occupancy rate
91.5%
Avg. Length of Stay
266 days

Who this home usually serves

TYPE OF STAY

Primarily long-term care, limited rehab

Most residents stay long-term, while a smaller portion are admitted for short-term rehab.

Might be optimal for
Long-term residence Daily assistance Occasional rehab needs

Breakdown by payment type

Medicare

12% of new residents, usually for short-term rehab.

Typical stay 2 - 3 months

Private pay

71% of new residents, often for short stays.

Typical stay 1 - 2 months

Medicaid

17% of new residents, often for long-term daily care.

Typical stay 4 years

Finances and operations

Privately-owned community
Home revenue
$12.3M
Profit
$381.7K
Privately-owned community
Home revenue
$12.3M
Profit
$381.7K
Payroll costs Info The portion of the home's budget spent on staff, including nurses, caregivers, and other employees who support care and operations.
$4.4M
36% of revenue
Other operating costs Info All remaining costs needed to run the home, such as food, utilities, building maintenance, supplies and administrative expenses.
$7.5M
Total costs $11.9M
Walk Score
Walk Score: 58 / 100
Moderately walkable. Some errands can be accomplished on foot, with a mix of nearby amenities.

What does this home offer?

Accepts Medicaid icon

Accept Medicaid: Yes

Housing options icon

Housing Options: Private / Semi-Private Rooms

Building type icon
Building type icon

Building Type: Single-story

Dining services icon

Dining Services

On-site medical care and health services icon

On-site Medical Care and Health Services

Types of Care at Fountain View Health and Rehabilitation

Nursing Home

Contact Fountain View Health and Rehabilitation

Health Inspection History

Inspections
Total health inspections 3

Colorado average 4.8


Last Health inspection on Sep 2024

Total health citations 17

Colorado average 24.8

Citations per inspection
5.67

Colorado average 5.2


Health citations are formal notices following inspections when they fail to comply with safety and care standards.

15 of 17 citations resulted from standard inspections; and 2 of 17 resulted from complaint investigations.

Breakdown of citation severity (last 3 years)
Critical Health citations More info 0
100% better than Colorado average

Colorado average: 0.4


Serious Health citations More info 1
52% better than Colorado average

Colorado average: 2.1

0 critical citations More info Colorado average: 0.4

1 serious citation More info Colorado average: 2.1

16 moderate citations More info Colorado average: 22.2

0 minor citations More info Colorado average: 0.2
Citations history (last 3 years)
Nutrition moderate citation Info Issues related to food quality, meal service, and resident's nutritional needs. Sep 19, 2024
Corrected

Nutrition moderate citation Info Issues related to food quality, meal service, and resident's nutritional needs. Sep 19, 2024
Corrected

Nutrition moderate citation Info Issues related to food quality, meal service, and resident's nutritional needs. Sep 19, 2024
Corrected

Pharmacy moderate citation Info Issues related to medication management, including how drugs are stored, administered, and monitored. Sep 19, 2024
Corrected

Compare Nursing Homes around Colorado Springs The information below is reported by the Colorado Department of Public Health and Environment, Health Facilities Division.

4 facilities compared · CMS & CO Dept. of Health data · Updated Apr 2026

Filter by care type
Liberty Heights
AL

Assisted Living A licensed, long-term care setting for seniors or individuals with disabilities who need help with daily activities — like bathing, dressing, and medication management — but not 24-hour skilled nursing. Offers housing, meals, and around-the-clock support while aiming to maximize resident independence.

IL

Independent Living Lifestyle-focused communities for older adults offering dining, activities, and transportation with minimal personal care. Best for active, independent seniors who want community without medical support.

MC

Memory Care Secured, specialized care for people living with Alzheimer's or dementia. Staff trained in cognitive impairment, with higher staff-to-resident ratios and an environment designed to reduce confusion and wandering risk.

NH

Nursing Home Licensed facility providing 24/7 skilled nursing care for residents with complex, ongoing medical needs. Staffed by RNs, LPNs, and CNAs. Inspected and star-rated annually by CMS. Accepts Medicare (short-term rehab) and Medicaid (long-term care).

IL

Independent Living Lifestyle-focused communities for older adults offering dining, activities, and transportation with minimal personal care. Best for active, independent seniors who want community without medical support.

Colorado Springs (Northgate)92 95.2% +24%4.51 +11%+17%0134.3038- 40 Ccrc Ops Mb1-T Llc$18.8M$7.5M39.8%65305
Fountain View Health and Rehabilitation
NH

Nursing Home Licensed facility providing 24/7 skilled nursing care for residents with complex, ongoing medical needs. Staffed by RNs, LPNs, and CNAs. Inspected and star-rated annually by CMS. Accepts Medicare (short-term rehab) and Medicaid (long-term care).

Colorado Springs (Southeast Colorado Springs)90 91.5% +20%2.68 +32%-31%1175.7186- 58 -$12.2M$4.4M36.2%65172
Falcon Heights Health and Rehabilitation
NH

Nursing Home Licensed facility providing 24/7 skilled nursing care for residents with complex, ongoing medical needs. Staffed by RNs, LPNs, and CNAs. Inspected and star-rated annually by CMS. Accepts Medicare (short-term rehab) and Medicaid (long-term care).

Colorado Springs (Southeast Colorado Springs)107 73.1% -4%2.65 +22%-31%1357.0484- 49 Tafkar Llc$11.9M$3.9M32.5%65168
Springs Village Care Center Skilled Nursing & Rehab -
NH

Nursing Home Licensed facility providing 24/7 skilled nursing care for residents with complex, ongoing medical needs. Staffed by RNs, LPNs, and CNAs. Inspected and star-rated annually by CMS. Accepts Medicare (short-term rehab) and Medicaid (long-term care).

Colorado Springs (East Colorado Springs)---------000.00-- 66 -----

Financial Assistance for
Nursing Home in Colorado

Get Financial aid guidance

Elderly, Blind, and Disabled Waiver

Colorado Medicaid EBD Waiver

Age 65+ or disabled
General Colorado resident, Medicaid- eligible, nursing home-level care need.
Income Limits (2025) ~$2,829/month 300% FBR, individual
Asset Limits $2,000 (individual), $3,000 (couple).
CO

Requires level-of-care assessment by case manager.

Benefits
Personal care (5-7 hours/day) Respite care (up to 240 hours/year) Adult day care ($65/day) Home modifications ($1,500 avg.)

Old Age Pension (OAP) Health Care Program

Colorado OAP

Age 60+
General Colorado resident.
Income Limits ~$1,215/month individual
Asset Limits $2,000 individual
CO

Supplements SSI; limited medical coverage.

Benefits
Cash (~$100-$800/month) Limited in-home care (2-3 hours/week) Medical assistance

Program of All-Inclusive Care for the Elderly (PACE)

Colorado Medicaid PACE

Age 55+
General Colorado resident, nursing home-level care need, safe with PACE support.
Income Limits (2025) ~$2,829/month 300% FBR
Asset Limits $2,000 (individual), $3,000 (couple).
CO

Limited to specific regions (e.g., Denver, Pueblo).

Benefits
All-inclusive care—personal care (5-7 hours/day) Meals Transportation Therapy Medical visits

Home Care Allowance (HCA)

Colorado Home Care Allowance (HCA)

Age
General Seniors typically 65+, Age 5+ with disability, Colorado resident, financial/functional need.
Income Limits (2025) ~$1,004/month individual, stricter than waivers
Asset Limits $2,000 (individual), $3,000 (couple).
CO

Must need help with ADLs; not Medicaid-waiver eligible.

Benefits
Personal care (~4-6 hours/day, paid to provider) E.g. Bathing Dressing

Senior Community Service Employment Program (SCSEP)

Colorado SCSEP (federally funded, state-administered)

Age 55+
General unemployed, low-income, Colorado resident.
Income Limits (2025) ~$1,983/month 125% FPL, individual
Asset Limits Not specified; income-focused.
CO

Priority for veterans, rural residents.

Benefits
Paid training (~20 hours/week at ~$7.25/hour) Job placement

Places of interest near Fountain View Health and Rehabilitation

Address 2.9 miles from city center Info Estimated distance in miles from Colorado Springs's city center to Fountain View Health and Rehabilitation's address, calculated via Google Maps.

Calculate Travel Distance to Fountain View Health and Rehabilitation

Add your location

Address

Staffing Data (Q2 2025)

This data corresponds to Q2 2025 and is based on CMS Payroll-Based Journal.

Total staff 112
Employees 87
Contractors 25
Staff to resident ratio 1.27:1
33% worse than Colorado average

Colorado average ratio: 1.91:1

Avg staff/day 40
Average shift 8 hours
0% compared with Colorado average

Colorado average: 8.3 hours

Total staff hours (quarter) 28,967
Nursing staff breakdown
Registered Nurse

Manages medical care and health needs.

Total count 20
Average shift length Info Average shift length. Calculated as total hours divided by days worked and average staff per day. 9.9 hours

No contractors work on this role.

Licensed Practical Nurse

Assists with medical care and medications.

Total count 10
Average shift length Info Average shift length. Calculated as total hours divided by days worked and average staff per day. 9.1 hours

No contractors work on this role.

Certified Nursing Assistant

Helps with daily care and mobility.

Total count 45
Average shift length Info Average shift length. Calculated as total hours divided by days worked and average staff per day. 7.7 hours

No contractors work on this role.

Contractor staffing

Total hours from contractors

8.8%

2,547 contractor hours this quarter

Speech Language Pathologist: 7 Physical Therapy Assistant: 5 Respiratory Therapy Technician: 3 Physical Therapy Aide: 3 Mental Health Service Worker: 2 Occupational Therapy Aide: 1 Qualified Social Worker: 1 Occupational Therapy Assistant: 1 Medical Director: 1 Dietitian: 1
Staff by category
Certified Nursing Assistant4504513,37591100%7.7
Registered Nurse200205,74091100%9.9
Licensed Practical Nurse100102,89691100%9.1
Clinical Nurse Specialist2021,0407380%7.7
Administrator2029366976%7.8
Speech Language Pathologist0779037279%7.1
Other Dietary Services Staff3037037886%7
Mental Health Service Worker1235467077%7.3
Nurse Practitioner1015206774%7.8
RN Director of Nursing1015206875%7.6
Physical Therapy Assistant0554696571%5.6
Respiratory Therapy Technician0334356774%5.9
Qualified Social Worker0113855965%6.5
Physical Therapy Aide0331962831%6.3
Dental Services Staff2021713134%5.5
Occupational Therapy Aide0111122527%4.5
Medical Director0111233%3.8
Dietitian011833%2.7
Occupational Therapy Assistant011333%1
45 Certified Nursing Assistant
% of Days 100%
20 Registered Nurse
% of Days 100%
10 Licensed Practical Nurse
% of Days 100%
2 Clinical Nurse Specialist
% of Days 80%
2 Administrator
% of Days 76%
7 Speech Language Pathologist
% of Days 79%
3 Other Dietary Services Staff
% of Days 86%
3 Mental Health Service Worker
% of Days 77%
1 Nurse Practitioner
% of Days 74%
1 RN Director of Nursing
% of Days 75%
5 Physical Therapy Assistant
% of Days 71%
3 Respiratory Therapy Technician
% of Days 74%
1 Qualified Social Worker
% of Days 65%
3 Physical Therapy Aide
% of Days 31%
2 Dental Services Staff
% of Days 34%
1 Occupational Therapy Aide
% of Days 27%
1 Medical Director
% of Days 3%
1 Dietitian
% of Days 3%
1 Occupational Therapy Assistant
% of Days 3%

Facility Characteristics

Source: CMS Long-Term Care Facility Characteristics (Data as of Jan 2026)

Total residents 88
Medicare
5
5.7% of residents
Medicaid
60
68.2% of residents
Private pay or other
23
26.1% of residents
Programs & Services
Residents Group

Residents meet regularly to discuss policies, care quality, and activities

Active Resident Council

Organized group of residents that meets regularly to discuss facility policies, quality of life, and activities.

Quality of care over time

These measures show how residents usually do over time at this home, based on health outcomes and preventive care.

High-risk clinical events score Info A composite score based on pressure ulcers, falls with injury, weight loss, walking ability decline, and activities of daily living decline. 10.1
12% worse than Colorado average

Colorado average: 9.0

Functional decline score Info A composite score based on activities of daily living decline, walking ability decline, and incontinence. 20.6
10% worse than Colorado average

Colorado average: 18.8

Long-stay resident measures
Above average Colorado avg: 3.8 Info CMS star rating based on long-stay quality measure performance. 5 stars = significantly above average, 1 star = significantly below average.
Need for Help with Daily Activities Increased Info Percent of long-stay residents whose need for help with daily activities has increased 16.1%
In line with Colorado average

Colorado average: 16.0%

Walking Ability Worsened Info Percent of long-stay residents whose ability to move independently worsened 26.3%
55% worse than Colorado average

Colorado average: 17.0%

Low Risk Residents with Bowel/Bladder Incontinence Info Percent of low risk long-stay residents who lose control of their bowels or bladder 19.3%
17% better than Colorado average

Colorado average: 23.2%

Falls with Major Injury Info Percent of long-stay residents experiencing one or more falls with major injury 2.7%
20% better than Colorado average

Colorado average: 3.3%

High Risk Residents with Pressure Ulcers Info Percent of long-stay high risk residents with pressure ulcers 4.2%
8% worse than Colorado average

Colorado average: 3.9%

Urinary Tract Infection Info Percent of long-stay residents with a urinary tract infection 0.3%
76% better than Colorado average

Colorado average: 1.4%

Lost Too Much Weight Info Percent of long-stay residents who lose too much weight 1.2%
77% better than Colorado average

Colorado average: 5.2%

Depressive Symptoms Info Percent of long-stay residents who have depressive symptoms 7.6%
6% worse than Colorado average

Colorado average: 7.2%

Antipsychotic Use Info Percent of long-stay residents who received an antipsychotic medication 17.5%
7% better than Colorado average

Colorado average: 18.8%

Pneumococcal Vaccine Info Percent of long-stay residents assessed and appropriately given the pneumococcal vaccine 98.7%
6% better than Colorado average

Colorado average: 93.3%

Influenza Vaccine Info Percent of long-stay residents assessed and appropriately given the seasonal influenza vaccine 88.9%
6% worse than Colorado average

Colorado average: 94.7%

Hospitalizations per 1,000 days Info Number of hospitalizations per 1,000 long-stay resident days. 1.76
35% worse than Colorado average

Colorado average: 1.30

ED visits per 1,000 days Info Number of outpatient emergency department visits per 1,000 long-stay resident days. 1.25
25% better than Colorado average

Colorado average: 1.67

Short-stay resident measures
Below average Colorado avg: 2.9 Info CMS star rating based on short-stay quality measure performance. 5 stars = much above average, 1 star = much below average.
Pneumococcal Vaccine Info Percent of short-stay residents assessed and appropriately given the pneumococcal vaccine 84.9%
11% better than Colorado average

Colorado average: 76.6%

Antipsychotic medication increase Info Percent of short-stay residents who newly received an antipsychotic medication 1.0%
28% better than Colorado average

Colorado average: 1.4%

Influenza Vaccine Info Percent of short-stay residents assessed and appropriately given the seasonal influenza vaccine 80.0%
6% better than Colorado average

Colorado average: 75.6%

Re-hospitalized after SNF stay Info Percentage of short-stay residents who were re-hospitalized after their nursing home admission. 16.8%
17% better than Colorado average

Colorado average: 20.3%

Emergency department visits Info Percentage of short-stay residents who had an outpatient emergency department visit. 12.3%
In line with Colorado average

Colorado average: 12.8%

Falls with major injury Info Percentage of SNF residents who experience falls with major injury during their stay. 0.0%
100% better than Colorado average

Colorado average: 0.8%

Ability to care for self at discharge Info Percentage of residents at or above expected ability to care for themselves at discharge. 46.4%
14% worse than Colorado average

Colorado average: 53.7%

Penalties and fines

Federal penalties imposed by CMS for regulatory violations, including civil money penalties (fines) and denials of payment for new Medicare/Medicaid admissions.

Source: CMS Penalties Database (Data as of Jan 2026)

Total fines amount $13K
67% lower than Colorado average

Colorado average: $40K

Number of fines 1
55% fewer fines than Colorado average

Colorado average: 2.2

Payment Denials Info Serious action where Medicare and/or Medicaid temporarily stops payments for new residents until issues are fixed. 0
100% fewer payment denials than Colorado average

Colorado average: 0.3

Fines amount comparison
This facility $13K
Colorado average $40K
Penalty History

Penalties are imposed by CMS for violations of federal nursing home regulations.

Civil Money Penalty Info Fines imposed for noncompliance, which can be assessed per day or per instance of violation. May 9, 2023
$13K

Last updated: Jan 2026

Guides for Better Senior Living

Care Cost Calculator: See Prices in Your Area

Nursing Home Data Explorer

Don’t Wait Too Long: 7 Red Flag Signs Your Parent Needs Assisted Living Now

The True Cost of Assisted Living in 2025 – And How Families Are Paying For It

Understanding Senior Living Costs: Pricing Models, Discounts & Financial Assistance

Explore Open Rooms
1 Contact details
2 What type of senior care service are you looking for?
3 What budget do you have in mind for senior care?
4 How soon do you need to find care?
5 Additional details

Thank you for your interest!

Our team will be in touch shortly to help with next steps.