


Occupancy rate
100%
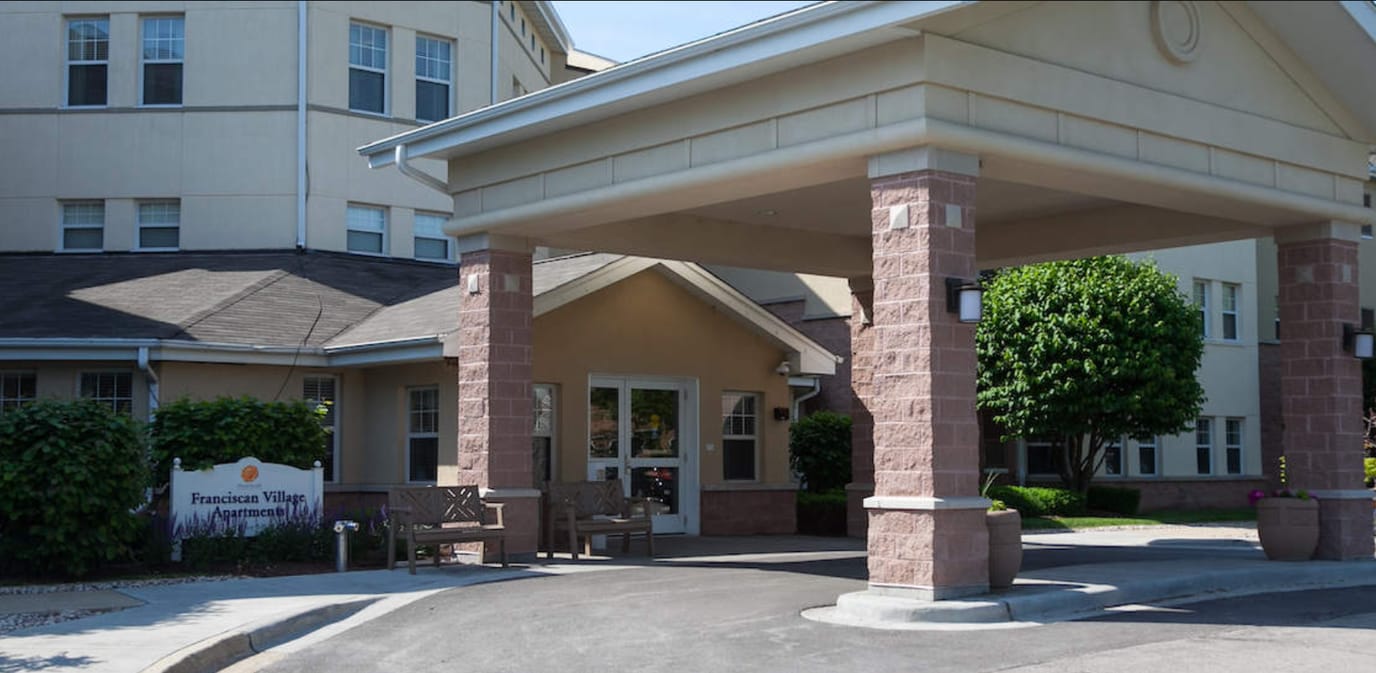
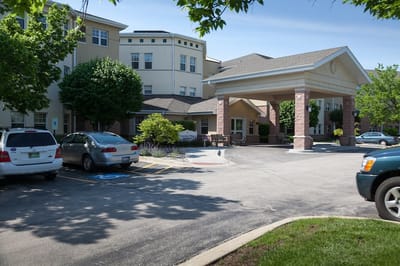
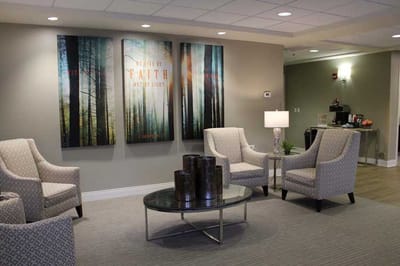

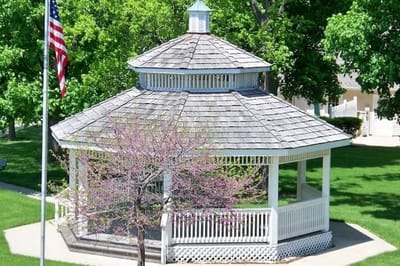

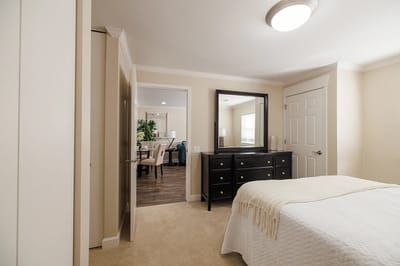
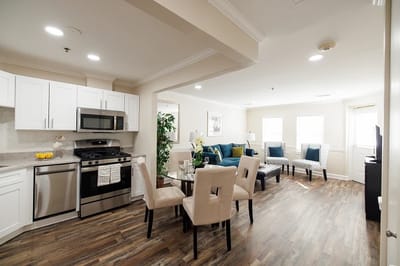


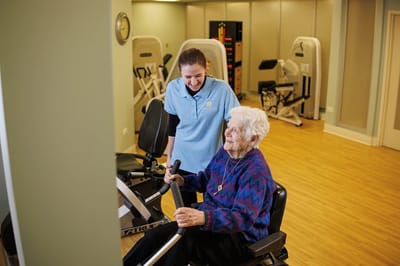


Franciscan Village of Lemont is a 47-bed nursing home in the Chicago suburb of Lemont, Illinois, about 15 miles southwest of Naperville. It is owned by Gregory Belback, runs under the Franciscan Care Solutions umbrella, and operates at full capacity. They take Medicare, Medicaid, and private pay, and since stays average about 72 days, most people are there for short-term rehabilitation after a hospital stay or intermediate recovery.
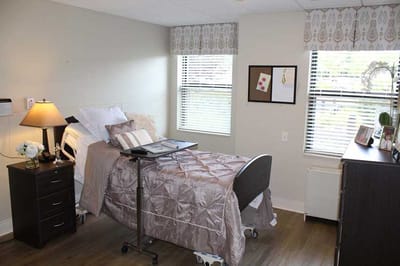
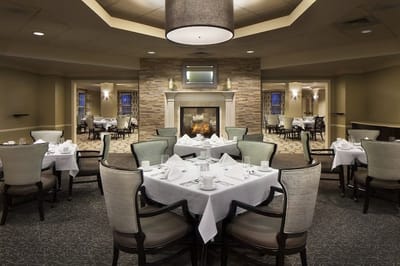
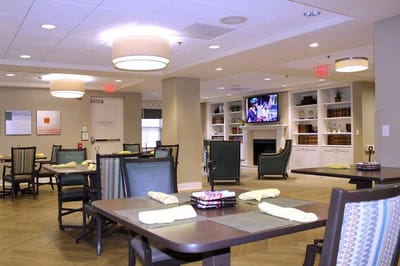
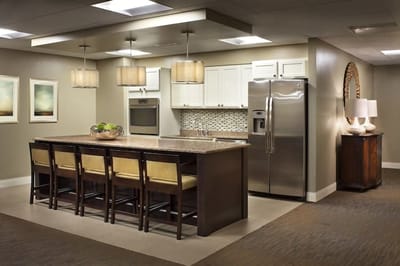
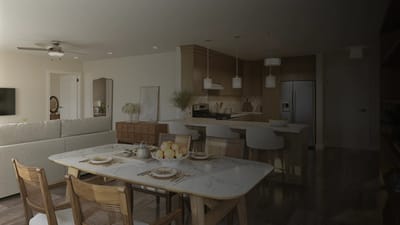
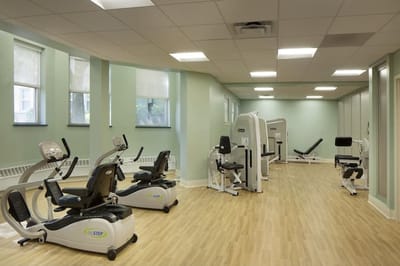
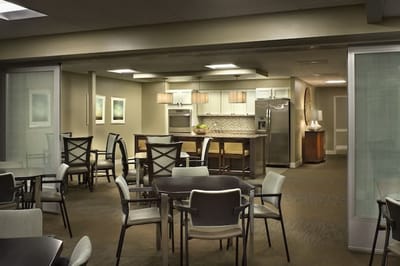
The nurses and aides spend about 3 hours and 48 minutes a day working directly with each resident, with registered nurses covering 1 hour and 21 minutes of that time and nurse aides providing 2 hours and 17 minutes. Because a team is on the floor 24/7, they manage therapies, post-surgery recovery, and short-term respite care. Inside, the faith-based community offers chef-prepared meals in a central dining room. The local neighborhood scores a 4 out of 100 for walkability, so visitors will need a car to get around, though the low score keeps the campus quiet and free of heavy traffic.
State inspectors found the facility to be in full compliance during its most recent review. Earlier findings regarding elopement risk management prompted the facility to update its staff training and conduct service plan audits, which have since been put into practice.
Prospective representatives can call the admissions desk to find out how the waiting list works, ask about the daily therapy options, or schedule a walkthrough of the campus.
| Staff type | Hours / Day / Resident | vs state avg |
|---|---|---|
|
Registered Nurse (RN)
| 1h 21m per day | ▲ 83% State avg: 44m per day · National avg: 41m per day |
|
LPN / LVN
| 34m per day | ▼ 11% State avg: 38m per day · National avg: 52m per day |
|
Nurse Aide
| 2h 17m per day | ▲ 7% State avg: 2h 8m per day · National avg: 2h 20m per day |
|
Weekend Total Nursing
| 3h 46m per day | ▲ 22% State avg: 3h 5m per day · National avg: 3h 26m per day |
|
Physical Therapist
| 3m per day | ■ Avg State avg: 3m per day · National avg: 4m per day |
|
Weekend RN
| 54m per day | ▲ 59% State avg: 34m per day · National avg: 28m per day |
Key information about the people who lead and staff this community.
In Illinois, the Department of Public Health, Office of Health Care Regulation conducts annual unannounced surveys to assess compliance with state and federal healthcare facility standards.
Deficiencies
| This Facility | IL Average | vs. IL Avg |
|---|---|---|---|
|
Total deficiencies
| 33 | 7 | This facility has 371% more total deficiencies than a typical Illinois nursing home (33 vs. IL avg 7).↑ 371% worse |
|
Deficiencies per inspection
| 11 | 0.8 | This facility has 1275% more deficiencies per inspection than a typical Illinois nursing home (11 vs. IL avg 0.8).↑ 1275% worse |
Inspections
| This Facility | IL Average | vs. IL Avg |
|---|---|---|---|
|
Total inspections
| 3 | 9 | This facility has had 67% fewer total inspections than the Illinois average (3 vs. IL avg 9). More inspections can mean more regulatory scrutiny rather than worse care.↓ 67% fewer |
State average 10.4
Last Health inspection on Aug 2025
State average 36.8
State average 3.68
Health citations are formal notices following inspections when they fail to comply with safety and care standards.
24 of 25 citations resulted from standard inspections; and 1 of 25 resulted from complaint investigations.
State average: 0.7
State average: 3.6
Reporting period: October 1 – December 31, 2025 (Q4 2025). Source: CMS Payroll-Based Journal report.
Manages medical care and health needs.
Assists with medical care and medications.
Helps with daily care and mobility.
Total hours from contractors
4,746 contractor hours this quarter
| Certified Nursing Assistant | 77 | 0 | 77 | 20,079 | 92 | 100% | 7.3 |
| Registered Nurse | 24 | 1 | 25 | 7,657 | 92 | 100% | 7.6 |
| Licensed Practical Nurse | 18 | 0 | 18 | 4,954 | 92 | 100% | 7.6 |
| Clinical Nurse Specialist | 9 | 0 | 9 | 3,643 | 92 | 100% | 7.8 |
| Other Dietary Services Staff | 9 | 0 | 9 | 2,762 | 92 | 100% | 7.8 |
| Speech Language Pathologist | 0 | 8 | 8 | 1,129 | 83 | 90% | 7.5 |
| Physical Therapy Assistant | 0 | 4 | 4 | 1,004 | 78 | 85% | 6.4 |
| Dental Services Staff | 2 | 1 | 3 | 928 | 64 | 70% | 7.9 |
| Physical Therapy Aide | 0 | 6 | 6 | 602 | 76 | 83% | 5.8 |
| Administrator | 2 | 0 | 2 | 490 | 61 | 66% | 7.9 |
| Qualified Social Worker | 0 | 3 | 3 | 490 | 64 | 70% | 7.4 |
| Nurse Practitioner | 1 | 0 | 1 | 480 | 60 | 65% | 8 |
| Respiratory Therapy Technician | 0 | 3 | 3 | 440 | 74 | 80% | 5.7 |
| Dietitian | 1 | 0 | 1 | 432 | 54 | 59% | 8 |
| Occupational Therapy Aide | 0 | 1 | 1 | 337 | 54 | 59% | 6.2 |
| Qualified Activities Professional | 0 | 4 | 4 | 203 | 80 | 87% | 2.5 |
| Medical Director | 0 | 1 | 1 | 75 | 18 | 20% | 4.2 |
| Occupational Therapy Assistant | 0 | 1 | 1 | 41 | 6 | 7% | 6.8 |
| Mental Health Service Worker | 0 | 2 | 2 | 7 | 2 | 2% | 3.5 |
Includes penalties issued in 2024
Federal penalties imposed by CMS for regulatory violations, including civil money penalties (fines) and denials of payment for new Medicare/Medicaid admissions.
Source: CMS Penalties Database (Data as of Jan 2026)
Illinois average: $143K
Illinois average: 3.0
Illinois average: 1.1
Penalties are imposed by CMS for violations of federal nursing home regulations.
1 penalty in the past 3 years
Aug 9, 2024 · 20 days
Last updated: Jan 2026
These measures show how residents usually do over time at this home, based on health outcomes and preventive care.
Illinois average: 9.7
Illinois average: 18.6
Illinois average: 15.5%
Illinois average: 21.6%
Illinois average: 3.4%
Illinois average: 5.3%
Illinois average: 1.8%
Illinois average: 6.5%
Illinois average: 48.1%
Illinois average: 20.2%
Illinois average: 89.2%
Illinois average: 91.6%
Illinois average: 2.04
Illinois average: 2.25
Illinois average: 68.3%
Illinois average: 2.3%
Illinois average: 63.0%
Illinois average: 26.2%
Illinois average: 14.0%
Illinois average: 0.8%
Illinois average: 53.7%
Illinois average: 50.6%
Quality measures are calculated from Minimum Data Set (MDS) assessments. For most measures, lower percentages indicate better care quality.
59% of new residents, usually for short-term rehab.
40% of new residents, often for short stays.
1% of new residents, often for long-term daily care.
Source: CMS Long-Term Care Facility Characteristics (Data as of Jan 2026)
Residents meet regularly to discuss policies, care quality, and activities
Part of a Continuing Care Retirement Community offering multiple care levels
Organized group of residents that meets regularly to discuss facility policies, quality of life, and activities.
Data sourced from CMS Long-Term Care Facility Characteristics quarterly report. Payer mix reflects the current resident census by primary payment source.
Historical financial and operational data for Franciscan Village of Lemont from 2012–2024, based on CMS SNF Cost Reports.
Key figures below are for fiscal year ending in 06/2024.
Based on CMS SNF Cost Report for fiscal year ending in 06/2024.
Most residents typically stay for a few weeks or months before returning home or moving on.
Most new residents arrive under Medicare (59% of admissions), and a typical Medicare stay runs around 23 days.
Coverage residents most often arrive under.
Coverage residents most often leave under.
![]() 2.0 miles from city center
2.0 miles from city center
![]() Estimated distance in miles from Lemont's city center to Franciscan Village of Lemont's address, calculated via Google Maps.
Estimated distance in miles from Lemont's city center to Franciscan Village of Lemont's address, calculated via Google Maps.
Add your location
Info below is compiled from CMS reports & the IL Dept. of Public Health (IDPH), senior community websites & trusted data sources such as Walk Score & BBB.
Communities are listed from highest to lowest based on our ranking methodology.
| Vi at The Glen | NH AL IL MC | Glenview | 36
Facility
36
IL AVG
85
Rank
#365 / 419 | - | - | 6.15
Facility
6.15
IL AVG
3.10
Rank
#3 / 155 | +48% | +98% | $0
Facility
$0
IL AVG
$151.3k
Rank
#1 / 155 | 6
Facility
6
IL AVG
36.8
Rank
#4 / 155 | 3.0
Facility
3.0
IL AVG
3.7
Rank
#40 / 155 | - | 42 | A+ |
52
Facility
52
IL AVG
51
Rank
#310 / 648 | Pamela Lamb | $6.7MFiscal year ending 12/2023
Facility
$6.7MFiscal year ending 12/2023
IL AVG
$12.2M
Rank
#6 / 154 | $7.6MFiscal year ending 12/2023
Facility
$7.6MFiscal year ending 12/2023
IL AVG
$4.8M
Rank
#64 / 154 | 112.7%Fiscal year ending 12/2023
Facility
112.7%Fiscal year ending 12/2023
IL AVG
44.3%
Rank
#153 / 154 | 146107 | ||||
| Avantara Long Grove | NH HOS MC PC SNF | Long Grove (Edgebrook Downs) | 195
Facility
195
IL AVG
85
Rank
#30 / 419 |
83.6%
Facility
83.6%
IL AVG
73
Rank
#57 / 157 | +15% | 2.60
Facility
2.60
IL AVG
3.10
Rank
#109 / 155 | +33% | -16% | $0
Facility
$0
IL AVG
$151.3k
Rank
#1 / 155 | 27
Facility
27
IL AVG
36.8
Rank
#61 / 155 | 3.4
Facility
3.4
IL AVG
3.7
Rank
#67 / 155 | - | 163 | - |
34
Facility
34
IL AVG
51
Rank
#465 / 648 | Lily Osei | $19.9MFiscal year ending 12/2023
Facility
$19.9MFiscal year ending 12/2023
IL AVG
$12.2M
Rank
#18 / 154 | $9.0MFiscal year ending 12/2023
Facility
$9.0MFiscal year ending 12/2023
IL AVG
$4.8M
Rank
#33 / 154 | 45.2%Fiscal year ending 12/2023
Facility
45.2%Fiscal year ending 12/2023
IL AVG
44.3%
Rank
#134 / 154 | 145868 | ||||
| Bella Terra Streamwood | NH MC PC SNF | Streamwood | 214
Facility
214
IL AVG
85
Rank
#20 / 419 |
61.5%
Facility
61.5%
IL AVG
73
Rank
#127 / 157 | -16% | 2.62
Facility
2.62
IL AVG
3.10
Rank
#109 / 155 | +144% | -16% | $0
Facility
$0
IL AVG
$151.3k
Rank
#1 / 155 | 14
Facility
14
IL AVG
36.8
Rank
#21 / 155 | 2.3
Facility
2.3
IL AVG
3.7
Rank
#14 / 155 | - | 132 | - |
74
Facility
74
IL AVG
51
Rank
#135 / 648 | Forbright Bank | $15.3MFiscal year ending 12/2023
Facility
$15.3MFiscal year ending 12/2023
IL AVG
$12.2M
Rank
#45 / 154 | $5.7MFiscal year ending 12/2023
Facility
$5.7MFiscal year ending 12/2023
IL AVG
$4.8M
Rank
#53 / 154 | 37.4%Fiscal year ending 12/2023
Facility
37.4%Fiscal year ending 12/2023
IL AVG
44.3%
Rank
#113 / 154 | 145701 | ||||
| GreenFields of Geneva | NH AL IL MC SNF | Geneva | 77
Facility
77
IL AVG
85
Rank
#188 / 419 |
54.5%
Facility
54.5%
IL AVG
73
Rank
#139 / 157 | -25% | 4.58
Facility
4.58
IL AVG
3.10
Rank
#24 / 155 | +61% | +48% | $14.2k
Facility
$14.2k
IL AVG
$151.3k
Rank
#79 / 155 | 19
Facility
19
IL AVG
36.8
Rank
#35 / 155 | 4.8
Facility
4.8
IL AVG
3.7
Rank
#128 / 155 | 3 | 42 | A+ |
6
Facility
6
IL AVG
51
Rank
#610 / 648 | Brian Robbins | $20.4MFiscal year ending 03/2024
Facility
$20.4MFiscal year ending 03/2024
IL AVG
$12.2M
Rank
#24 / 154 | $8.9MFiscal year ending 03/2024
Facility
$8.9MFiscal year ending 03/2024
IL AVG
$4.8M
Rank
#41 / 154 | 43.5%Fiscal year ending 03/2024
Facility
43.5%Fiscal year ending 03/2024
IL AVG
44.3%
Rank
#132 / 154 | 146166 | ||||
| Franciscan Village of Lemont | NH AL IL MC SNF | Lemont | 47
Facility
47
IL AVG
85
Rank
#303 / 419 | - | - | 3.81
Facility
3.81
IL AVG
3.10
Rank
#46 / 155 | -1% | +23% | $22.3k
Facility
$22.3k
IL AVG
$151.3k
Rank
#82 / 155 | 25
Facility
25
IL AVG
36.8
Rank
#56 / 155 | 6.3
Facility
6.3
IL AVG
3.7
Rank
#150 / 155 | 2 | 97 | A+ |
4
Facility
4
IL AVG
51
Rank
#619 / 648 | Gregory Belback | $29.4MFiscal year ending 06/2024
Facility
$29.4MFiscal year ending 06/2024
IL AVG
$12.2M
Rank
#4 / 154 | $12.2MFiscal year ending 06/2024
Facility
$12.2MFiscal year ending 06/2024
IL AVG
$4.8M
Rank
#17 / 154 | 41.3%Fiscal year ending 06/2024
Facility
41.3%Fiscal year ending 06/2024
IL AVG
44.3%
Rank
#152 / 154 | 146029 |
Franciscan Village of Lemont is legally operated by Franciscan Communities, Inc.
Franciscan Village of Lemont has a walk score of 4. Car-dependent. Most errands require a car, with limited nearby walkable options.
According to IL state health department records, Franciscan Village of Lemont's license number is 5100570.
According to IL state health department records, Franciscan Village of Lemont's license expires on December 23, 2026.
Franciscan Village of Lemont's occupancy is 100%.
Franciscan Village of Lemont has been operating for approximately 29 years, based on available licensing and registration records.
No, Franciscan Village of Lemont has a no-pet policy.
Care Cost Calculator: See Prices in Your Area
Nursing Home Data Explorer
Don’t Wait Too Long: 7 Red Flag Signs Your Parent Needs Assisted Living Now
The True Cost of Assisted Living in 2025 – And How Families Are Paying For It
Understanding Senior Living Costs: Pricing Models, Discounts & Financial Assistance


