Horizon Health & Subacute Center
CMS overall rating Info CMS (the Centers for Medicare & Medicaid Services) is the federal agency that rates nursing home quality. Its Overall Rating runs from 1 to 5 stars, combining health inspections, staffing, and quality measures, with inspections weighted most heavily.

Horizon Health & Subacute Center

CMS overall rating Info CMS (the Centers for Medicare & Medicaid Services) is the federal agency that rates nursing home quality. Its Overall Rating runs from 1 to 5 stars, combining health inspections, staffing, and quality measures, with inspections weighted most heavily.
Calculator: See prices in your area
Horizon Health & Subacute Center accepts Medicare, Medicaid, and private pay.

Overview of Horizon Health & Subacute Center

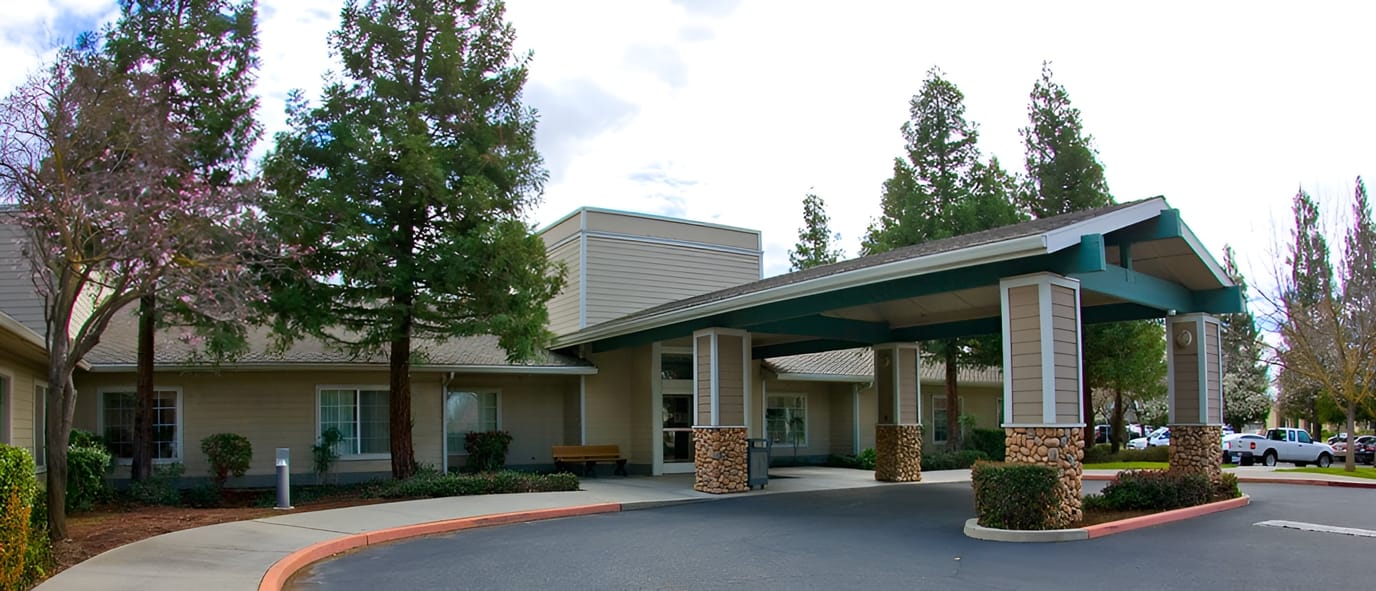
Ideally situated in the peaceful residential area of Herndon Avenue, Fresno, CA, Horizon Health & Subacute Center is a distinct community that offers skilled nursing, rehabilitation, memory care, assisted living, and behavioral health. Dedicated to improving residents’ well-being, the community provides top-notch care tailored to their special needs and preferences 24/7. Residents ease their worries knowing a trusted community helps with their daily living activities and household responsibilities.

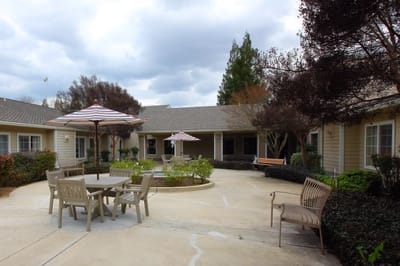
A full calendar of fun activities and engaging events is conducted so residents can live actively and remain socially engaged. The community also prioritizes residents’ mental wellness, providing mental health programs for recovery. With a wide range of comprehensive care options, residents can rest assured of finding the care they need for their ever-changing needs.

(559) 321-0883

Quality ratings

Measured by Centers for Medicare & Medicaid Services (CMS)

Overall rating Info The Overall CMS Rating combines results from health inspections, staffing levels and quality measures. Health inspections carry the most weight. Staffing and quality scores can increase or decrease the final rating based on performance compared to state and national standards.
▼ 44.4% Below CA avg. ▼ 44.4% Below CA avg.Click the badge to see the full State ranking.Click here to see the full State ranking.
Health Inspection Info Based on the results of the facility's three most recent standard inspections and any complaint investigations. CMS reviews the number, scope, and severity of deficiencies, with more recent findings weighted more heavily.
▼ 36.5% Below CA avg. ▼ 36.5% Below CA avg.Click the badge to see the full State ranking.Click here to see the full State ranking.
Staffing Info Measures average nursing staff hours per resident per day, including Registered Nurses (RNs) and total nursing staff. Ratings are adjusted based on the level of care residents require and are compared to state and national benchmarks.
▲ 15.9% Above CA avg. ▲ 15.9% Above CA avg.Click the badge to see the full State ranking.Click here to see the full State ranking.
Quality Measures Info Based on clinical and physical health indicators reported to CMS, such as hospital readmissions, falls, pressure ulcers, and improvements in mobility. These measures reflect how well residents' health needs are being managed.
▼ 6.1% Below CA avg. ▼ 6.1% Below CA avg.Click the badge to see the full State ranking.Click here to see the full State ranking.

Staffing hours breakdown

Info Daily nursing hours per resident by staff type, reported to CMS. Higher is generally better — compare this facility to state and national averages to see where staffing stands.

Hours per resident per day — compared to California state averages

Total nursing care / resident Info This home is ranked 68th out of 345 homes in California for nurse hours. Total adjusted nursing hours per resident per day, combining RN, LPN, and aide time. CMS adjusts this for case-mix so facilities can be fairly compared.
4h 44m per day
Rank #68 / 345Nurse hours — State benchmarkedThis home is ranked 68th out of 345 homes in California. Shows adjusted nurse hours per resident per day benchmarked to the California average, with a ranking across 345 California facilities. More hours mean more direct care. The national average is about 3.5 hrs; below 3.0 is a red flag.Click the rank badge to see the full State ranking.Click here to see the full State ranking.
This facility California avg (4h 23m per day)
vs California avg
+8%

3 of 6 metrics below state avg

Standout metric LPN / LVN is +20% above state avg
Staff typeHours / Day / Residentvs state avg
Registered Nurse (RN) Info RNs hold the highest nursing license and can assess residents, interpret test results, and direct care plans. More RN hours per day often signals stronger clinical oversight and faster response to health changes. 32m per day ▼ 17% State avg: 39m per day · National avg: 41m per day
LPN / LVN Info Licensed Practical Nurses (LPNs) or Licensed Vocational Nurses (LVNs) deliver routine hands-on care — medication administration, wound dressing, and monitoring vital signs. They work under RN supervision and make up a large share of daily bedside care. 1h 27m per day ▲ 20% State avg: 1h 13m per day · National avg: 52m per day
Nurse Aide Info Certified Nurse Aides (CNAs) provide the most direct day-to-day assistance: bathing, dressing, feeding, and mobility. Nurse aide hours are typically the largest staffing category and directly affect residents' quality of life. 2h 34m per day ■ Avg State avg: 2h 38m per day · National avg: 2h 20m per day
Weekend Total Nursing Info Combined nursing hours (RN + LPN + Nurse Aide) per resident per day on weekends. Staffing often drops on weekends — this figure reveals whether the facility maintains adequate coverage outside of weekday hours. 4h 9m per day ■ Avg State avg: 4h 5m per day · National avg: 3h 26m per day
Physical Therapist Info Hours per resident per day provided by licensed Physical Therapists (PTs) or PT Assistants. PT services help residents recover mobility after injury or illness and are especially important for post-acute (short-stay) rehabilitation. 4m per day ▼ 25% State avg: 5m per day · National avg: 4m per day
Weekend RN Info Registered nurse hours specifically on weekends. Facilities sometimes reduce RN presence on Saturdays and Sundays — a low weekend RN figure compared to weekday hours can indicate reduced clinical oversight when most administrative staff are absent. 25m per day ▼ 16% State avg: 30m per day · National avg: 28m per day

Capacity and availability

This home usually has availability

Lower occupancy than the California average: 84.7%
Occupancy rate
70.2% Rank #944 / 1530Occupancy rate — State benchmarkedThis home is ranked 944th out of 1530 homes in California. Shows this facility's occupancy rate versus the California average, with its Statewide rank out of 1530. Higher occupancy signals strong local demand and financial stability.Click the rank badge to see the full State ranking.Click here to see the full State ranking.
Avg. Length of Stay
115 days
Walk Score
Walk Score: 58 / 100 Rank #1128 / 2092Walk Score — State benchmarkedThis home is ranked 1128th out of 2092 homes in California. Shows how walkable this facility's neighborhood is compared to the average Walk Score across California facilities. Higher scores benefit residents, families, and staff.Click the rank badge to see the full State ranking.Click here to see the full State ranking.
Moderately walkable. Some errands can be accomplished on foot, with a mix of nearby amenities.

About this community

License Details

CMS Certification Number55199

Staffing

Key information about the people who lead and staff this community.

Leadership

ContactTeresa Ewing, Administrator

Contact Horizon Health & Subacute Center

Inspection History

In California, the Department of Social Services (for assisted living facilities) and the Department of Public Health (for nursing homes) conduct inspections to ensure resident safety and regulatory compliance.

Since 2019 · 7 years of data 39 citations 12 total visits 8 complaint visits
Inspection Score Info A composite 0–100 score combining this facility's inspections, citations, complaints, and enforcement actions relative to the California state average. The score below shows how many points this facility sits above or below the typical California nursing home score (the benchmark); higher is better.

7 points below the California average for nursing homes (81/100)

Rank #998 / 1401 in California Inspection Score — State benchmarked This home is ranked 998th out of 1401 homes in California. Shows this facility's inspection score compared to the California average among 1401 comparable communities in the ranking pool. Inspection score: 74 out of 100. Letter grade C. 7 points below the California average for nursing homes (81/100)

Inspection Scorecard Info This scorecard compares key inspection, citation, and complaint metrics at this facility against the California state average. Metrics rated ≥15% worse than average are highlighted in red; those ≥15% better are highlighted in green.

Since 2019 vs. California state average
Overall vs. CA average 2 Worse Metrics worse than California average:
• Total citations (290% above)
• Citations per year (300% above)
1 At Avg Metrics at California average:
• Citations per inspection (at CA avg)
3 Better Metrics better than California average:
• Total visits (50% below)
• Complaint visits (38% below)
• Other visits (100% below)
Latest Inspection March 26, 2025 Routine

Citations Info Citations are formal regulatory issues recorded during state inspections.

This FacilityCA Averagevs. CA Avg
Total citations Info Formal regulatory issues recorded by inspectors across all inspection types. 3910 This facility has 290% more total citations than a typical California nursing home (39 vs. CA avg 10).↑ 290% worse
Citations per year Info Average citations per year since 2019. 5.61.4 This facility has 300% more citations per year than a typical California nursing home (5.6 vs. CA avg 1.4).↑ 300% worse
Citations per inspection Info Average citations per inspection. 3.33.3 This facility has citations per inspection in line with the California average (3.3 vs. CA avg 3.3).— At avg

Inspections & Visits Info State inspections evaluate whether the facility meets health and safety standards.

This FacilityCA Averagevs. CA Avg
Total visits Info Combined count of complaint visits, other regulatory visits, and official scheduled inspections. 816 This facility has 50% fewer total visits than a typical California nursing home (8 vs. CA avg 16).↓ 50% better
Complaint visits Info On-site visits triggered by formal complaints filed by residents, families, or staff. 813 This facility has 38% fewer complaint visits than a typical California nursing home (8 vs. CA avg 13).↓ 38% better
Other visits Info Regulatory visits that are neither routine inspections nor complaint investigations — administrative check-ins, follow-up reviews, licensing-related visits. 07 This facility has 100% fewer other visits than a typical California nursing home (0 vs. CA avg 7).↓ 100% better

Health Inspection History

Inspections since 2019
Total health inspections 14

California average 12.5


Last Health inspection on Mar 2025

Total health citations
43 Rank #185 / 352Health citations — State benchmarkedThis home is ranked 185th out of 352 homes in California. Shows this facility's total health deficiency citations benchmarked to the California State average, with a ranking across all 352 CA facilities. Lower citation counts earn a better rank.Click the rank badge to see the full State ranking.Click here to see the full State ranking.

California average 50.2

Citations per inspection
3.07 Rank #72 / 352Citations per inspection — State benchmarkedThis home is ranked 72nd out of 352 homes in California. Shows average deficiency citations per CMS inspection for this facility versus the California mean across 352 facilities with citation data. Lower is better.Click the rank badge to see the full State ranking.Click here to see the full State ranking.

California average 4.65


Health citations are formal notices following inspections when they fail to comply with safety and care standards.

29 of 43 citations resulted from standard inspections; and 14 of 43 resulted from complaint investigations.

Breakdown of citation severity (last 7 years)
Critical health citations
1
150% worse than California average

California average: 0.4


Serious health citations
1
In line with California average

California average: 1

1 critical citation California average: 0.4

1 serious citation California average: 1

40 moderate citations California average: 47.2

1 minor citation California average: 1.5
Citations history (last 7 years)
Care Planning moderate citation Mar 26, 2025
Corrected

Resident Rights moderate citation Mar 26, 2025
Corrected

Environmental moderate citation Mar 07, 2025
Corrected

Infection Control moderate citation Mar 07, 2025
Corrected

Staffing Data

Reporting period: October 1 – December 31, 2025 (Q4 2025). Source: CMS Payroll-Based Journal report.

Total staff 271
Employees 271
Contractors 0
Staff to resident ratio 1.75 : 1
0% compared with California average
California average ratio: 1.81 : 1 California average ratio: 1.81 : 1See full California ranking
Avg staff/day 106
Average shift 8.1 hours
5% better than California average
California average: 7.7 hours California average shift: 7.7 hoursSee full California ranking
Total staff hours (quarter) 78,717

Nursing staff breakdown

Q4 2025 · Oct 1 – Dec 31 More info This data comes from the CMS Payroll-Based Journal report covering October 1 – December 31, 2025.
Registered Nurse

Manages medical care and health needs.

RN Staff Info All 17 RN Staff are full-time employees. No contractors work on this role. 17
Average shift length Info Average shift length. Calculated as total hours divided by days worked and average staff per day. 8.1 hours
Licensed Practical Nurse

Assists with medical care and medications.

LPN Staff Info All 78 LPN Staff are full-time employees. No contractors work on this role. 78
Average shift length Info Average shift length. Calculated as total hours divided by days worked and average staff per day. 8.2 hours
Certified Nursing Assistant

Helps with daily care and mobility.

CNA Staff Info All 110 CNA Staff are full-time employees. No contractors work on this role. 110
Average shift length Info Average shift length. Calculated as total hours divided by days worked and average staff per day. 8.4 hours

Contractor staffing

Q4 2025 · Oct 1 – Dec 31 More info This data comes from the CMS Payroll-Based Journal report covering October 1 – December 31, 2025.
Total hours from contractors 0% — all staff are direct employees this quarter

Staff by category

Q4 2025 · Oct 1 – Dec 31 More info This data comes from the CMS Payroll-Based Journal report covering October 1 – December 31, 2025.
Certified Nursing Assistant110011036,29192100%8.4
Licensed Practical Nurse7807819,10892100%8.2
Registered Nurse170176,15992100%8.1
Diagnostic X-ray Services Staff110112,98792100%8
Other Dietary Services Staff5052,02992100%7.7
Qualified Activities Professional8081,91392100%10
Speech Language Pathologist8081,5096874%7.7
RN Director of Nursing6061,4057177%8
Physical Therapy Assistant7071,1908289%5
Clinical Nurse Specialist2021,0086470%8
Dental Services Staff2029536672%8.1
Respiratory Therapy Technician4048847885%7.1
Physical Therapy Aide6067866773%6
Occupational Therapy Aide1015126470%8
Mental Health Service Worker1015046368%8
Administrator1014645863%8
Nurse Practitioner1014405560%8
Dietitian1014145964%7
Qualified Social Worker2021593639%4.4
110 Certified Nursing Assistant
% of Days 100%
78 Licensed Practical Nurse
% of Days 100%
17 Registered Nurse
% of Days 100%
11 Diagnostic X-ray Services Staff
% of Days 100%
5 Other Dietary Services Staff
% of Days 100%
8 Qualified Activities Professional
% of Days 100%
8 Speech Language Pathologist
% of Days 74%
6 RN Director of Nursing
% of Days 77%
7 Physical Therapy Assistant
% of Days 89%
2 Clinical Nurse Specialist
% of Days 70%
2 Dental Services Staff
% of Days 72%
4 Respiratory Therapy Technician
% of Days 85%
6 Physical Therapy Aide
% of Days 73%
1 Occupational Therapy Aide
% of Days 70%
1 Mental Health Service Worker
% of Days 68%
1 Administrator
% of Days 63%
1 Nurse Practitioner
% of Days 60%
1 Dietitian
% of Days 64%
2 Qualified Social Worker
% of Days 39%

Penalties and fines

Includes penalties issued in 2024

Federal penalties imposed by CMS for regulatory violations, including civil money penalties (fines) and denials of payment for new Medicare/Medicaid admissions.

Source: CMS Penalties Database (Data as of Jan 2026)

Total fines amount $23K Rank #262 / 352Federal fines — State benchmarkedThis home is ranked 262nd out of 352 homes in California. Shows this facility's cumulative CMS federal fine dollars versus the California average among facilities with fines, and where it ranks among 352 facilities in the pool. Lower total dollars mean a better rank.Click the rank badge to see the full State ranking.Click here to see the full State ranking.
58% lower than California average

California average: $55K

Number of fines 1
58% fewer fines than California average

California average: 2.4

Payment Denials Info Serious action where Medicare and/or Medicaid temporarily stops payments for new residents until issues are fixed. 0
100% fewer payment denials than California average

California average: 0.5

Fines amount comparison
This facility $23K
California average $55K
Penalty History

Penalties are imposed by CMS for violations of federal nursing home regulations.

1 penalty in the past 3 years

Mar 1, 2024 · $23K

Civil Money Penalty Info Fines imposed for noncompliance, which can be assessed per day or per instance of violation. Mar 1, 2024
$23K

Last updated: Jan 2026

Quality of care over time

These measures show how residents usually do over time at this home, based on health outcomes and preventive care.

High-risk clinical events score Info A composite score based on pressure ulcers, falls with injury, weight loss, walking ability decline, and activities of daily living decline. 5.9
11% better than California average

California average: 6.6

Functional decline score Info A composite score based on activities of daily living decline, walking ability decline, and incontinence. 9.9
12% better than California average

California average: 11.3

Long-stay resident measures
Significantly above average California avg: 4.2 Info CMS star rating based on long-stay quality measure performance. 5 stars = significantly above average, 1 star = significantly below average.
Need for Help with Daily Activities Increased Info Percent of long-stay residents whose need for help with daily activities has increased 6.3%
43% better than California average

California average: 11.1%

Walking Ability Worsened Info Percent of long-stay residents whose ability to move independently worsened 10.2%
15% better than California average

California average: 12.0%

Low Risk Residents with Bowel/Bladder Incontinence Info Percent of low risk long-stay residents who lose control of their bowels or bladder 13.3%
18% worse than California average

California average: 11.3%

Falls with Major Injury Info Percent of long-stay residents experiencing one or more falls with major injury 1.5%
9% better than California average

California average: 1.7%

High Risk Residents with Pressure Ulcers Info Percent of long-stay high risk residents with pressure ulcers 5.4%
9% worse than California average

California average: 5.0%

Urinary Tract Infection Info Percent of long-stay residents with a urinary tract infection 0.4%
69% better than California average

California average: 1.2%

Lost Too Much Weight Info Percent of long-stay residents who lose too much weight 6.1%
45% worse than California average

California average: 4.2%

Depressive Symptoms Info Percent of long-stay residents who have depressive symptoms 1.2%
83% better than California average

California average: 6.7%

Antipsychotic Use Info Percent of long-stay residents who received an antipsychotic medication 6.2%
39% better than California average

California average: 10.1%

Pneumococcal Vaccine Info Percent of long-stay residents assessed and appropriately given the pneumococcal vaccine 100.0%
In line with California average

California average: 98.5%

Influenza Vaccine Info Percent of long-stay residents assessed and appropriately given the seasonal influenza vaccine 100.0%
In line with California average

California average: 98.2%

Hospitalizations per 1,000 days Info Number of hospitalizations per 1,000 long-stay resident days. 2.84
26% worse than California average

California average: 2.25

ED visits per 1,000 days Info Number of outpatient emergency department visits per 1,000 long-stay resident days. 3.56
124% worse than California average

California average: 1.59

Short-stay resident measures
Average California avg: 3.5 Info CMS star rating based on short-stay quality measure performance. 5 stars = much above average, 1 star = much below average.
Pneumococcal Vaccine Info Percent of short-stay residents assessed and appropriately given the pneumococcal vaccine 97.5%
In line with California average

California average: 94.0%

Antipsychotic medication increase Info Percent of short-stay residents who newly received an antipsychotic medication 1.3%
8% better than California average

California average: 1.5%

Influenza Vaccine Info Percent of short-stay residents assessed and appropriately given the seasonal influenza vaccine 90.8%
In line with California average

California average: 93.2%

Re-hospitalized after SNF stay Info Percentage of short-stay residents who were re-hospitalized after their nursing home admission. 25.5%
10% worse than California average

California average: 23.2%

Emergency department visits Info Percentage of short-stay residents who had an outpatient emergency department visit. 21.3%
90% worse than California average

California average: 11.2%

Falls with major injury Info Percentage of SNF residents who experience falls with major injury during their stay. 0.7%
9% better than California average

California average: 0.8%

Ability to care for self at discharge Info Percentage of residents at or above expected ability to care for themselves at discharge. 52.3%
In line with California average

California average: 53.7%

Successful return to home or community Info Rate of successful return to home or community from a skilled nursing facility. 50.4%
In line with California average

California average: 50.6%

Breakdown by payment type

Medicare

26% of new residents, usually for short-term rehab.

Typical stay 1 months

Private pay

60% of new residents, often for short stays.

Typical stay 1 - 2 months

Medicaid

14% of new residents, often for long-term daily care.

Typical stay 1 - 2 years

Facility Characteristics

Source: CMS Long-Term Care Facility Characteristics (Data as of Jan 2026)

Total residents 155
Medicare
23
14.8% of residents
Medicaid
122
78.7% of residents
Private pay or other
10
6.5% of residents
Programs & Services
Residents Group

Residents meet regularly to discuss policies, care quality, and activities

Active Resident Council

Organized group of residents that meets regularly to discuss facility policies, quality of life, and activities.

Finances and operations

Privately-owned community
Operated by a single business entity.
Home revenue
$4.8M
Operating loss
-$701.6K
Privately-owned community Operated by a single business entity.
Home revenue
$4.8M Rank #337 / 346Revenue — State benchmarkedThis home is ranked 337th out of 346 homes in California. Shows this facility's annual revenue compared to the California average. Higher revenue generally means more resources for staffing and capital — read alongside Payroll %.Click the rank badge to see the full State ranking.Click here to see the full State ranking.
Operating loss
-$701.6K
Payroll costs Info The portion of the home's budget spent on staff, including nurses, caregivers, and other employees who support care and operations. Rank #322 / 346Payroll — State benchmarkedThis home is ranked 322nd out of 346 homes in California. Shows total annual staff payroll benchmarked to the California average. Higher payroll investment relative to peers often signals better staffing and less reliance on cheaper contract labor.Click the rank badge to see the full State ranking.Click here to see the full State ranking.
$3.6M
74.7% of revenue Rank #16 / 346Payroll % — State benchmarkedThis home is ranked 16th out of 346 homes in California. Shows payroll as a percentage of revenue versus the California average. Well-run California facilities typically land around 56–67% — the top third Statewide. Below 25% may signal understaffing or heavy agency use — read with Staffing ratings.Click the rank badge to see the full State ranking.Click here to see the full State ranking.
Other operating costs Info All remaining costs needed to run the home, such as food, utilities, building maintenance, supplies and administrative expenses.
$1.9M
Total costs $5.5M

What does this home offer?

Housing options icon

Housing Options: Private / Semi-Private Rooms

Building type icon
Building type icon

Building Type: Single-story

Health Programs icon

Health Programs

Recreational activities icon

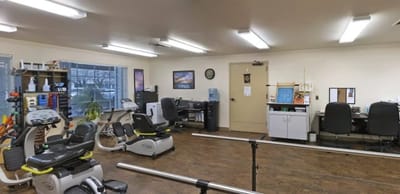
Recreational Activities

Transportation services icon

Transportation Services

Who this home usually serves

TYPE OF STAY

Primarily short stays

Residents typically stay for brief periods, with frequent admissions and discharges throughout the year.

Places of interest near Horizon Health & Subacute Center

Address 9.4 miles from city center Info Estimated distance in miles from Fresno's city center to Horizon Health & Subacute Center's address, calculated via Google Maps.

Calculate Travel Distance to Horizon Health & Subacute Center

Add your location

Address

Financial Assistance for
Nursing Home in California

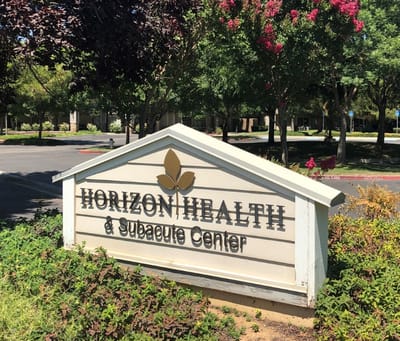
Horizon Health & Subacute Center is located in Fresno, California.
Here are the financial assistance programs available to residents in California.

Get Financial aid guidance

Multipurpose Senior Services Program

MSSP (Medi-Cal Waiver)

Age 65+
General California resident, Medi-Cal eligible, nursing home risk.
Income Limits (2025) ~$2,829/month 300% FBR, individual
Asset Limits $2,000 (individual), $3,000 (couple).
CA

County-managed; waitlists possible.

Benefits
In-home support (4-6 hours/day) Respite care (14 days/year) Meals (~$6/meal) Transportation (8 trips/month) Care management

In-Home Supportive Services (IHSS)

California IHSS

Age 65+
General California resident, Medicaid-eligible or low-income.
Income Limits ~$1,732/month individual, Medi-Cal threshold
Asset Limits $2,000 individual
CA

Can hire family as caregivers.

Benefits
Personal care (up to 283 hours/month) Homemaker services Respite (varies)

Multipurpose Senior Services Program (MSSP)

CA MSSP

Age 65+
General California resident, Medi-Cal-eligible, nursing home-eligible but community-capable.
Income Limits ~$2,829/month 300% FBR, individual
Asset Limits $2,000 individual
CA

Available in 38 counties; waitlists common.

Benefits
Case management Respite care (up to 10 days/year) Minor home mods (avg. $500) Adult day care (~$50/day)

Property Tax Postponement Program (PTP)

CA PTP

Age 62+
General California resident, own and live in home, 40% equity.
Income Limits (2025) ~$51,500/year household, adjusted annually
Asset Limits Equity-based; no strict asset cap.
CA

Deferred taxes accrue interest (5% as of 2024); repaid upon sale/death.

Benefits
Property tax deferral (avg. $1,000-$3,000/year, varies by county)

Assisted Living Waiver (ALW)

CA ALW

Age 65+ or disabled
General California resident, Medi-Cal-eligible, nursing home-eligible.
Income Limits ~$2,829/month 300% FBR, individual
Asset Limits $2,000 individual
CA

Available in 15 counties (e.g., LA, Sacramento); waitlists common.

Benefits
Personal care in ALFs (5-7 hours/day) Medication management Social services

California CARES Program

CA CARES

Age
General Caregivers of California residents 60+ needing help with 3+ daily activities; no caregiver age limit.
Income Limits No strict limit; cost-sharing above ~$2,500/month threshold.
Asset Limits Not applicable; need-based.
CA

High demand in urban areas; complements IHSS respite.

Benefits
Respite care (up to 10 days/year) Counseling (4-6 sessions/year) Training (2-3 workshops/year) Supplies (~$200/year)

Compare Nursing Home around Fresno

The information below is reported by the California Department of Social Services and Department of Public Health.

5 facilities compared · CMS & CA Dept. of Health data

North Pointe Care Center
NH

Nursing Home Licensed facility providing 24/7 skilled nursing care for residents with complex, ongoing medical needs. Staffed by RNs, LPNs, and CNAs. Inspected and star-rated annually by CMS. Accepts Medicare (short-term rehab) and Medicaid (long-term care).

Fresno (East Bullard Avenue)
99
Facility 99
CA AVG 103
Rank #725 / 1657
90.6%
Facility 90.6%
CA AVG 84.7%
Rank #358 / 1530
+7%
3.61
Facility 3.61
CA AVG 4.22
Rank #262 / 345
+19%-14%
$0
Facility $0
CA AVG $56.5k
Rank #1 / 352
-
21
Facility 21
CA AVG 50.2
Rank #46 / 352
4.2
Facility 4.2
CA AVG 4.6
Rank #181 / 352
-158-
80
Facility 80
CA AVG 57
Rank #417 / 2092
North Point Wellness Gp LLC
$13.3M
Facility $13.3M
CA AVG $17.0M
Rank #236 / 346
$5.9M
Facility $5.9M
CA AVG $7.0M
Rank #257 / 346
44.5%
Facility 44.5%
CA AVG 45.2%
Rank #219 / 346
555179
Evergreen Life Care Homes
NH

Nursing Home Licensed facility providing 24/7 skilled nursing care for residents with complex, ongoing medical needs. Staffed by RNs, LPNs, and CNAs. Inspected and star-rated annually by CMS. Accepts Medicare (short-term rehab) and Medicaid (long-term care).

AL

Assisted Living A licensed, long-term care setting for seniors or individuals with disabilities who need help with daily activities — like bathing, dressing, and medication management — but not 24-hour skilled nursing. Offers housing, meals, and around-the-clock support while aiming to maximize resident independence.

Fresno (Roosevelt)
49
Facility 49
CA AVG 103
Rank #1138 / 1657
--
4.36
Facility 4.36
CA AVG 4.22
Rank #104 / 345
-27%+3%
$0
Facility $0
CA AVG $56.5k
Rank #1 / 352
-
33
Facility 33
CA AVG 50.2
Rank #131 / 352
3.0
Facility 3.0
CA AVG 4.6
Rank #60 / 352
246A+
37
Facility 37
CA AVG 57
Rank #1605 / 2092
Evergreen Care Center Holdings LLC
$6.6M
Facility $6.6M
CA AVG $17.0M
Rank #319 / 346
$2.8M
Facility $2.8M
CA AVG $7.0M
Rank #338 / 346
42.3%
Facility 42.3%
CA AVG 45.2%
Rank #244 / 346
555920
Horizon Health & Subacute Center
NH

Nursing Home Licensed facility providing 24/7 skilled nursing care for residents with complex, ongoing medical needs. Staffed by RNs, LPNs, and CNAs. Inspected and star-rated annually by CMS. Accepts Medicare (short-term rehab) and Medicaid (long-term care).

Fresno (East Herndon Avenue)
180
Facility 180
CA AVG 103
Rank #210 / 1657
--
4.73
Facility 4.73
CA AVG 4.22
Rank #68 / 345
-29%+12%
$22.9k
Facility $22.9k
CA AVG $56.5k
Rank #262 / 352
74
Facility 74
CA AVG 81
Rank #998 / 1401
43
Facility 43
CA AVG 50.2
Rank #185 / 352
3.1
Facility 3.1
CA AVG 4.6
Rank #72 / 352
2153-
58
Facility 58
CA AVG 57
Rank #1128 / 2092
Chad Galley
$4.8M
Facility $4.8M
CA AVG $17.0M
Rank #337 / 346
$3.6M
Facility $3.6M
CA AVG $7.0M
Rank #322 / 346
74.7%
Facility 74.7%
CA AVG 45.2%
Rank #16 / 346
55199
Fresno Nursing Center
NH

Nursing Home Licensed facility providing 24/7 skilled nursing care for residents with complex, ongoing medical needs. Staffed by RNs, LPNs, and CNAs. Inspected and star-rated annually by CMS. Accepts Medicare (short-term rehab) and Medicaid (long-term care).

Fresno (Mclane)
65
Facility 65
CA AVG 103
Rank #1044 / 1657
--
3.96
Facility 3.96
CA AVG 4.22
Rank #180 / 345
-39%-6%
$42.8k
Facility $42.8k
CA AVG $56.5k
Rank #332 / 352
-
50
Facility 50
CA AVG 50.2
Rank #220 / 352
4.6
Facility 4.6
CA AVG 4.6
Rank #208 / 352
461-
66
Facility 66
CA AVG 57
Rank #855 / 2092
Fresno Nursing And Rehab Center LLC
$8.3M
Facility $8.3M
CA AVG $17.0M
Rank #296 / 346
$5.7M
Facility $5.7M
CA AVG $7.0M
Rank #264 / 346
68.8%
Facility 68.8%
CA AVG 45.2%
Rank #29 / 346
56266
Twilight Haven -
NH

Nursing Home Licensed facility providing 24/7 skilled nursing care for residents with complex, ongoing medical needs. Staffed by RNs, LPNs, and CNAs. Inspected and star-rated annually by CMS. Accepts Medicare (short-term rehab) and Medicaid (long-term care).

AL

Assisted Living A licensed, long-term care setting for seniors or individuals with disabilities who need help with daily activities — like bathing, dressing, and medication management — but not 24-hour skilled nursing. Offers housing, meals, and around-the-clock support while aiming to maximize resident independence.

Fresno
166
Facility 166
CA AVG 103
Rank #270 / 1657
---------------
2
Facility 2
CA AVG 57
Rank #2044 / 2092
Raymond Goertzen
$6.6M
Facility $6.6M
CA AVG $17.0M
Rank #318 / 346
$5.5M
Facility $5.5M
CA AVG $7.0M
Rank #273 / 346
82.2%
Facility 82.2%
CA AVG 45.2%
Rank #6 / 346
55658

Frequently Asked Questions about Horizon Health & Subacute Center

What neighborhood is Horizon Health & Subacute Center in?

Horizon Health & Subacute Center is in the East Herndon Avenue neighborhood of Fresno.

Is Horizon Health & Subacute Center in a walkable area?

Horizon Health & Subacute Center has a walk score of 58. Moderately walkable. Some errands can be accomplished on foot, with a mix of nearby amenities.

Are there photos of Horizon Health & Subacute Center?

Yes — there are 4 photos of Horizon Health & Subacute Center in the photo gallery on this page.

What is the address of Horizon Health & Subacute Center?

Horizon Health & Subacute Center is located at 3034 Herndon Ave, Fresno, CA 93720.

What is the phone number of Horizon Health & Subacute Center?

(559) 321-0883 will put you in contact with the team at Horizon Health & Subacute Center.

Is Horizon Health & Subacute Center Medicare or Medicaid certified?

Yes — Horizon Health & Subacute Center is a CMS-certified provider of Medicare and Medicaid.

Guides for Better Senior Living

Care Cost Calculator: See Prices in Your Area

Nursing Home Data Explorer

Don’t Wait Too Long: 7 Red Flag Signs Your Parent Needs Assisted Living Now

The True Cost of Assisted Living in 2025 – And How Families Are Paying For It

Understanding Senior Living Costs: Pricing Models, Discounts & Financial Assistance

Explore Open Rooms
1 Contact details
2 What type of senior care service are you looking for?
3 What budget do you have in mind for senior care?
4 How soon do you need to find care?
5 Additional details

Thank you for your interest!

Our team will be in touch shortly to help with next steps.