


Total health inspections
11
California average 12.5
Last Health inspection on Jul 2025
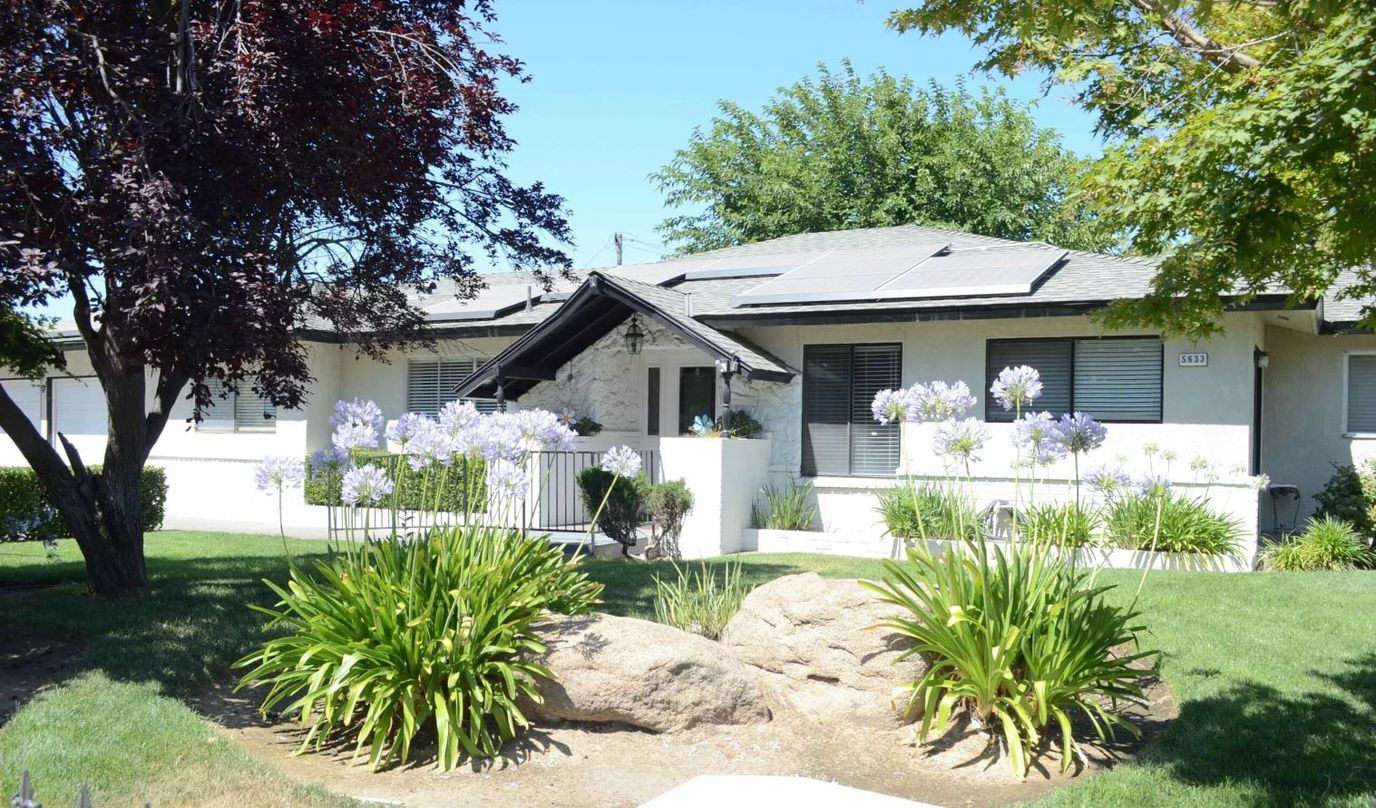
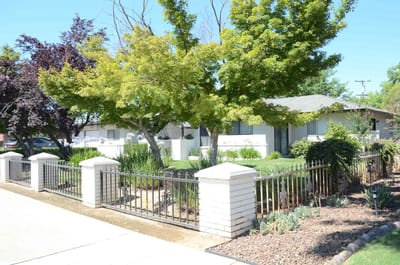
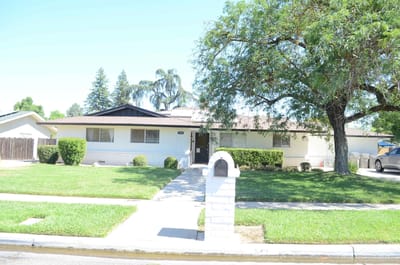
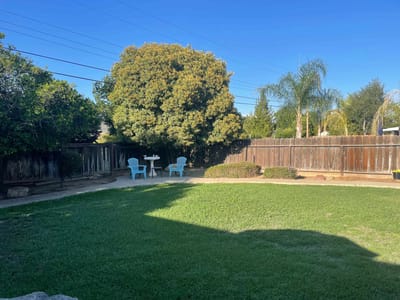
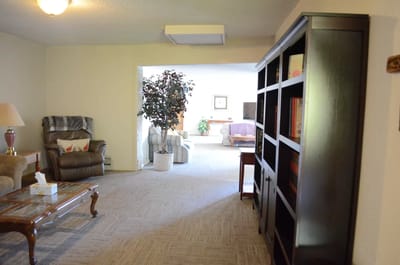
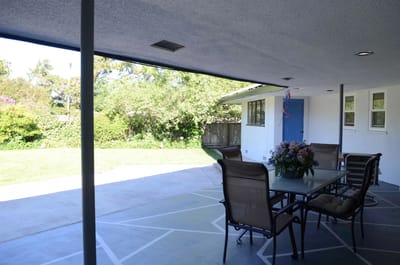
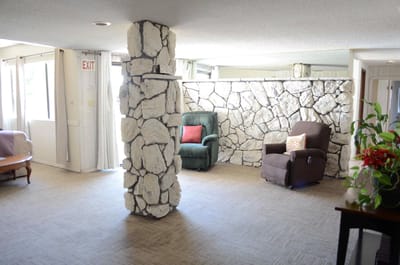
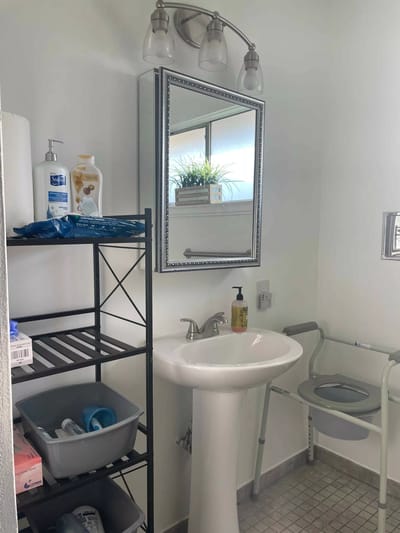
Evergreen Life Care Homes is a highly reliable senior care provider boasting three exceptional residential homes: Northwest Villa, Château Jesadean, and Evergreen Court. Offering a range of services, including assisted living, memory care, palliative care, short-term stays, hospice care, diabetes care, and more, their commitment is to ensure seniors receive top-notch care and attention.
Located in Fresno, California, their residential homes provide not only comprehensive services but also modern amenities, creating a comfortable and vibrant environment. With a hands-on management approach, Evergreen Life Care Homes stands out for its professional team that treats residents like family. The homes offer a smooth transition for residents and their families, fostering a sense of community, warmth, and an ideal and cherished residence to spend the golden years in.
| Staff type | Hours / Day / Resident | vs state avg |
|---|---|---|
|
Registered Nurse (RN)
| 35m per day | ▼ 13% State avg: 40m per day · National avg: 41m per day |
|
LPN / LVN
| 51m per day | ▼ 30% State avg: 1h 12m per day · National avg: 52m per day |
|
Nurse Aide
| 2h 58m per day | ▲ 12% State avg: 2h 39m per day · National avg: 2h 20m per day |
|
Weekend Total Nursing
| 3h 57m per day | ▼ 3% State avg: 4h 5m per day · National avg: 3h 27m per day |
|
Physical Therapist
| 6m per day | ■ Avg State avg: 6m per day · National avg: 4m per day |
|
Weekend RN
| 27m per day | ▼ 13% State avg: 31m per day · National avg: 29m per day |
Key information about the people who lead and staff this community.
California average 12.5
Last Health inspection on Jul 2025
California average 50.2
California average 4.65
Health citations are formal notices following inspections when they fail to comply with safety and care standards.
19 of 33 citations resulted from standard inspections; and 14 of 33 resulted from complaint investigations.
California average: 0.4
California average: 1
Reporting period: October 1 – December 31, 2025 (Q4 2025). Source: CMS Payroll-Based Journal report.
Manages medical care and health needs.
Assists with medical care and medications.
Helps with daily care and mobility.
Total hours from contractors
29 contractor hours this quarter
| Certified Nursing Assistant | 47 | 0 | 47 | 12,631 | 92 | 100% | 7.4 |
| Licensed Practical Nurse | 15 | 0 | 15 | 3,588 | 92 | 100% | 7.8 |
| Registered Nurse | 6 | 1 | 7 | 2,008 | 92 | 100% | 8 |
| Dental Services Staff | 3 | 0 | 3 | 1,440 | 70 | 76% | 7.9 |
| Qualified Activities Professional | 8 | 0 | 8 | 965 | 92 | 100% | 7.1 |
| Physical Therapy Aide | 8 | 0 | 8 | 907 | 86 | 93% | 4.9 |
| Speech Language Pathologist | 3 | 0 | 3 | 777 | 71 | 77% | 5.6 |
| Administrator | 1 | 0 | 1 | 512 | 64 | 70% | 8 |
| Nurse Practitioner | 1 | 0 | 1 | 488 | 61 | 66% | 8 |
| Respiratory Therapy Technician | 3 | 0 | 3 | 423 | 65 | 71% | 3.2 |
| Occupational Therapy Aide | 2 | 0 | 2 | 304 | 45 | 49% | 5 |
| Dietitian | 2 | 0 | 2 | 177 | 46 | 50% | 3.8 |
| Physical Therapy Assistant | 3 | 0 | 3 | 135 | 55 | 60% | 2.2 |
| Medical Director | 1 | 0 | 1 | 45 | 13 | 14% | 3.5 |
| Occupational Therapy Assistant | 1 | 0 | 1 | 37 | 8 | 9% | 4.6 |
| Qualified Social Worker | 2 | 0 | 2 | 32 | 15 | 16% | 2.1 |
| Other Dietary Services Staff | 1 | 0 | 1 | 8 | 1 | 1% | 8 |
Federal penalties imposed by CMS for regulatory violations, including civil money penalties (fines) and denials of payment for new Medicare/Medicaid admissions.
Source: CMS Penalties Database
No penalties in the past 3 years
No civil money penalties or payment denials were reported in the last 3 years.
These measures show how residents usually do over time at this home, based on health outcomes and preventive care.
California average: 6.6
California average: 11.3
California average: 11.1%
California average: 12.0%
California average: 11.3%
California average: 1.7%
California average: 5.0%
California average: 1.2%
California average: 4.2%
California average: 6.7%
California average: 10.1%
California average: 98.5%
California average: 98.2%
California average: 94.0%
California average: 1.5%
California average: 93.2%
Quality measures are calculated from Minimum Data Set (MDS) assessments. For most measures, lower percentages indicate better care quality.
18% of new residents, usually for short-term rehab.
24% of new residents, often for short stays.
58% of new residents, often for long-term daily care.
Source: CMS Long-Term Care Facility Characteristics (Data as of Jan 2026)
Residents meet regularly to discuss policies, care quality, and activities
State-approved Nurse Aide Training and Competency Evaluation Program on-site
Organized group of residents that meets regularly to discuss facility policies, quality of life, and activities.
Data sourced from CMS Long-Term Care Facility Characteristics quarterly report. Payer mix reflects the current resident census by primary payment source.
Historical financial and operational data for Evergreen Life Care Homes from 2020–2023, based on CMS SNF Cost Reports.
Key figures below are for fiscal year ending in 12/2023.
Based on CMS SNF Cost Report for fiscal year ending in 12/2023.
Pets Allowed
Transportation Services
Fitness and Recreation
Most residents stay for extended periods and receive ongoing daily care.
Most new residents arrive under Medicaid (58% of admissions), and a typical Medicaid stay runs around 4 - 5 months.
Coverage residents most often arrive under.
Coverage residents most often leave under.
![]() 4.0 miles from city center
4.0 miles from city center
![]() Estimated distance in miles from Fresno's city center to Evergreen Life Care Homes's address, calculated via Google Maps.
Estimated distance in miles from Fresno's city center to Evergreen Life Care Homes's address, calculated via Google Maps.
Add your location
Info below is compiled from CMS reports & the CA Dept. of Social Services (CDSS), senior community websites & trusted data sources such as Walk Score & BBB.
Communities are listed from highest to lowest based on our ranking methodology.
| The Terraces at San Joaquin Gardens a CCRC | NH AL IL MC SNF | Fresno | 652
Facility
652
CA AVG
104
Rank
#9 / 1644 |
57.2%
Facility
57.2%
CA AVG
73.9
Rank
#1230 / 1492 | -23% | 5.21
Facility
5.21
CA AVG
4.22
Rank
#24 / 293 | +27% | +23% | $0
Facility
$0
CA AVG
$56.5k
Rank
#1 / 298 | 88
Facility
88
CA AVG
81
Rank
#513 / 1400 | 32
Facility
32
CA AVG
50.2
Rank
#107 / 293 | 4.6
Facility
4.6
CA AVG
4.6
Rank
#182 / 293 | 1 | 373 | A+ |
57
Facility
57
CA AVG
57
Rank
#1155 / 2087 | Humangood Fresno | $33.9MFiscal year ending 12/2023
Facility
$33.9MFiscal year ending 12/2023
CA AVG
$17.0M
Rank
#25 / 295 | $13.6MFiscal year ending 12/2023
Facility
$13.6MFiscal year ending 12/2023
CA AVG
$7.0M
Rank
#33 / 295 | 40.2%Fiscal year ending 12/2023
Facility
40.2%Fiscal year ending 12/2023
CA AVG
45.2%
Rank
#240 / 295 | 55846 | ||||
| North Pointe Care Center | NH MC RC SNF | Fresno (East Bullard Avenue) | 99
Facility
99
CA AVG
104
Rank
#724 / 1644 |
92.9%
Facility
92.9%
CA AVG
73.9
Rank
#267 / 1492 | +26% | 3.61
Facility
3.61
CA AVG
4.22
Rank
#222 / 293 | +19% | -14% | $0
Facility
$0
CA AVG
$56.5k
Rank
#1 / 298 | - | 21
Facility
21
CA AVG
50.2
Rank
#38 / 293 | 4.2
Facility
4.2
CA AVG
4.6
Rank
#158 / 293 | - | 92 | - |
80
Facility
80
CA AVG
57
Rank
#416 / 2087 | North Point Wellness Gp LLC | $11.0M*Fiscal year ending 10/2022These figures are from this home's most recent complete cost report — an older period than most facilities report. Compare with that in mind.
Facility
$11.0M*Fiscal year ending 10/2022These figures are from this home's most recent complete cost report — an older period than most facilities report. Compare with that in mind.
CA AVG
$17.0M
Rank
#218 / 295 | $6.5M*Fiscal year ending 10/2022These figures are from this home's most recent complete cost report — an older period than most facilities report. Compare with that in mind.
Facility
$6.5M*Fiscal year ending 10/2022These figures are from this home's most recent complete cost report — an older period than most facilities report. Compare with that in mind.
CA AVG
$7.0M
Rank
#205 / 295 | 58.7%*Fiscal year ending 10/2022These figures are from this home's most recent complete cost report — an older period than most facilities report. Compare with that in mind.
Facility
58.7%*Fiscal year ending 10/2022These figures are from this home's most recent complete cost report — an older period than most facilities report. Compare with that in mind.
CA AVG
45.2%
Rank
#82 / 295 | 555179 | ||||
| Evergreen Life Care Homes | NH HOS MC RC SNF | Fresno (Roosevelt) | 49
Facility
49
CA AVG
104
Rank
#1129 / 1644 |
94.3%
Facility
94.3%
CA AVG
73.9
Rank
#229 / 1492 | +28% | 4.36
Facility
4.36
CA AVG
4.22
Rank
#88 / 293 | -27% | +3% | $0
Facility
$0
CA AVG
$56.5k
Rank
#1 / 298 | - | 33
Facility
33
CA AVG
50.2
Rank
#115 / 293 | 3.0
Facility
3.0
CA AVG
4.6
Rank
#55 / 293 | 2 | 46 | A+ |
37
Facility
37
CA AVG
57
Rank
#1600 / 2087 | Evergreen Care Center Holdings LLC | $8.6MFiscal year ending 12/2023
Facility
$8.6MFiscal year ending 12/2023
CA AVG
$17.0M
Rank
#279 / 295 | $2.8MFiscal year ending 12/2023
Facility
$2.8MFiscal year ending 12/2023
CA AVG
$7.0M
Rank
#294 / 295 | 32.6%Fiscal year ending 12/2023
Facility
32.6%Fiscal year ending 12/2023
CA AVG
45.2%
Rank
#219 / 295 | 555920 | ||||
| Horizon Health & Subacute Center | NH SNF | Fresno (East Herndon Avenue) | 180
Facility
180
CA AVG
104
Rank
#210 / 1644 |
85.2%
Facility
85.2%
CA AVG
73.9
Rank
#453 / 1492 | +15% | 4.73
Facility
4.73
CA AVG
4.22
Rank
#56 / 293 | -29% | +12% | $22.9k
Facility
$22.9k
CA AVG
$56.5k
Rank
#226 / 298 | 74
Facility
74
CA AVG
81
Rank
#998 / 1400 | 43
Facility
43
CA AVG
50.2
Rank
#157 / 293 | 3.1
Facility
3.1
CA AVG
4.6
Rank
#66 / 293 | 2 | 153 | - |
58
Facility
58
CA AVG
57
Rank
#1126 / 2087 | Chad Galley | $17.2M*Fiscal year ending 03/2022These figures are from this home's most recent complete cost report — an older period than most facilities report. Compare with that in mind.
Facility
$17.2M*Fiscal year ending 03/2022These figures are from this home's most recent complete cost report — an older period than most facilities report. Compare with that in mind.
CA AVG
$17.0M
Rank
#137 / 295 | $10.3M*Fiscal year ending 03/2022These figures are from this home's most recent complete cost report — an older period than most facilities report. Compare with that in mind.
Facility
$10.3M*Fiscal year ending 03/2022These figures are from this home's most recent complete cost report — an older period than most facilities report. Compare with that in mind.
CA AVG
$7.0M
Rank
#73 / 295 | 60%*Fiscal year ending 03/2022These figures are from this home's most recent complete cost report — an older period than most facilities report. Compare with that in mind.
Facility
60%*Fiscal year ending 03/2022These figures are from this home's most recent complete cost report — an older period than most facilities report. Compare with that in mind.
CA AVG
45.2%
Rank
#32 / 295 | 55199 | ||||
| Fresno Nursing Center | NH SNF | Fresno (Mclane) | 65
Facility
65
CA AVG
104
Rank
#1037 / 1644 |
93.7%
Facility
93.7%
CA AVG
73.9
Rank
#240 / 1492 | +27% | 3.96
Facility
3.96
CA AVG
4.22
Rank
#154 / 293 | -39% | -6% | $42.8k
Facility
$42.8k
CA AVG
$56.5k
Rank
#247 / 298 | - | 50
Facility
50
CA AVG
50.2
Rank
#183 / 293 | 4.6
Facility
4.6
CA AVG
4.6
Rank
#182 / 293 | 4 | 61 | - |
66
Facility
66
CA AVG
57
Rank
#854 / 2087 | Fresno Nursing And Rehab Center LLC | $8.7MFiscal year ending 12/2023
Facility
$8.7MFiscal year ending 12/2023
CA AVG
$17.0M
Rank
#261 / 295 | $5.1MFiscal year ending 12/2023
Facility
$5.1MFiscal year ending 12/2023
CA AVG
$7.0M
Rank
#239 / 295 | 58.1%Fiscal year ending 12/2023
Facility
58.1%Fiscal year ending 12/2023
CA AVG
45.2%
Rank
#25 / 295 | 56266 |
Evergreen Life Care Homes is located in Fresno, California.
Here are the financial assistance programs available to residents in California.
Evergreen Life Care Homes is in the Roosevelt neighborhood of Fresno.
Evergreen Life Care Homes has a walk score of 37. Somewhat walkable. A few nearby services may be reachable on foot, but most trips require transportation.
Evergreen Life Care Homes's occupancy is 90.9%.
Evergreen Life Care Homes has been operating for approximately 29 years, based on available licensing and registration records.
Yes, Evergreen Life Care Homes allows residents to bring their pets.
Evergreen Life Care Homes is registered as a for-profit in CA.
Yes — there are 9 photos of Evergreen Life Care Homes in the photo gallery on this page.
Care Cost Calculator: See Prices in Your Area
Nursing Home Data Explorer
Don’t Wait Too Long: 7 Red Flag Signs Your Parent Needs Assisted Living Now
The True Cost of Assisted Living in 2025 – And How Families Are Paying For It
Understanding Senior Living Costs: Pricing Models, Discounts & Financial Assistance


