


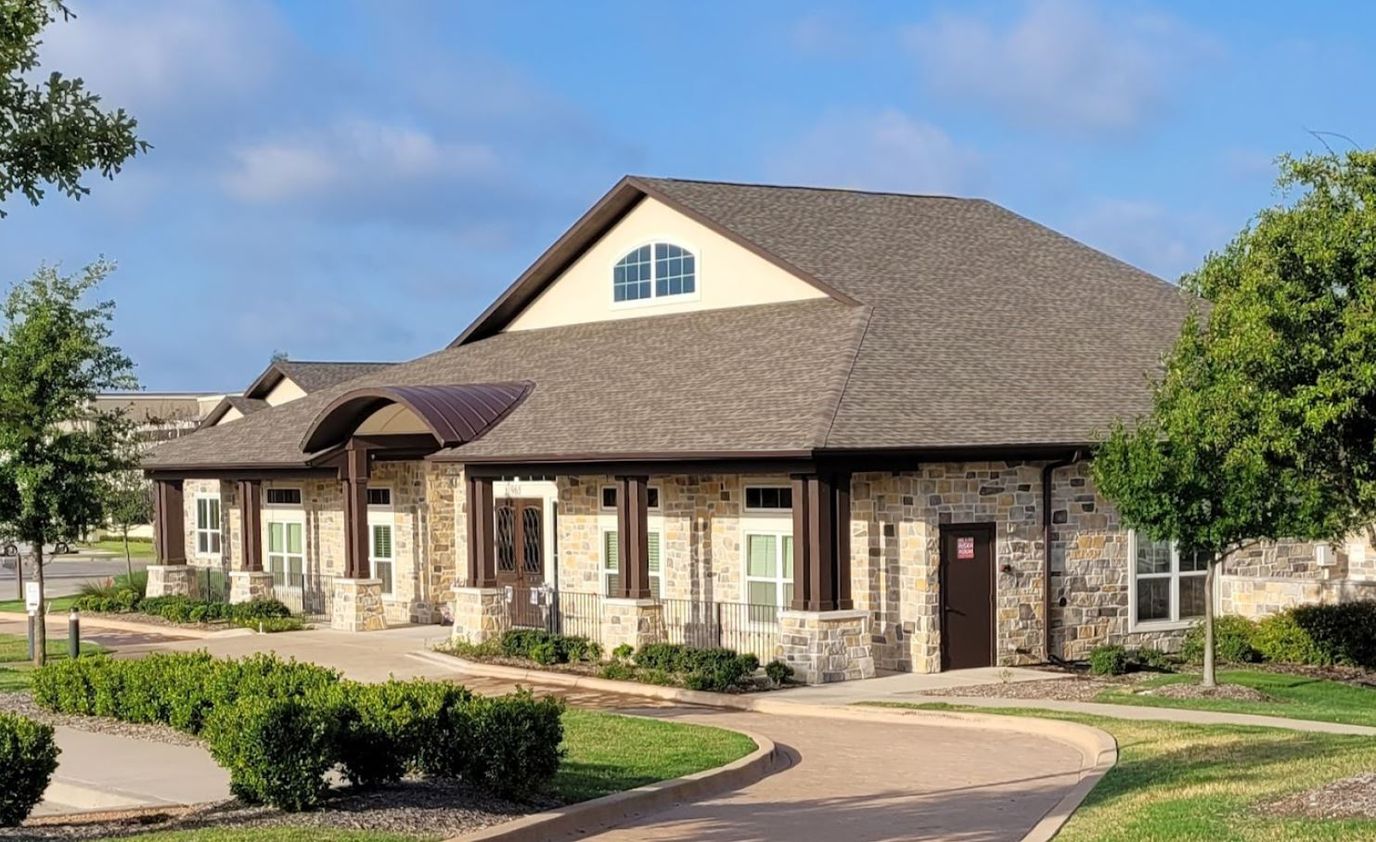
Grand Brook Memory Care of Allen at Twin Creeks
Nursing Home, Assisted Living & Memory Care · Allen, TX


Grand Brook Memory Care of Allen at Twin Creeks
Nursing Home, Assisted Living & Memory Care · Allen, TX
Overview of Grand Brook Memory Care of Allen at Twin Creeks
Grand Brook Memory Care of Allen at Twin Creeks is a renowned destination that has been delivering top-notch quality care for over 35 years. This esteemed assisted living memory care community, accommodating 32 residents, boasts a strategic location near Highway 75 that benefits residents and their families, ensuring easy accessibility for families and visitors.
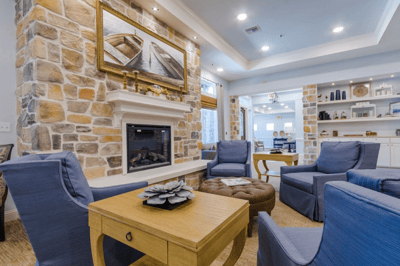
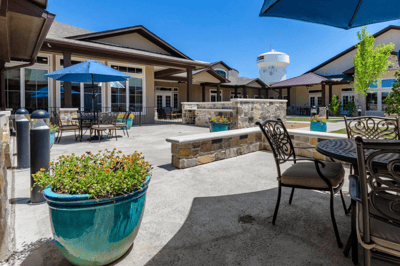
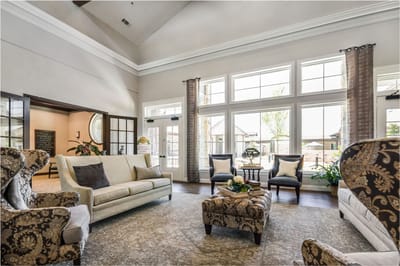
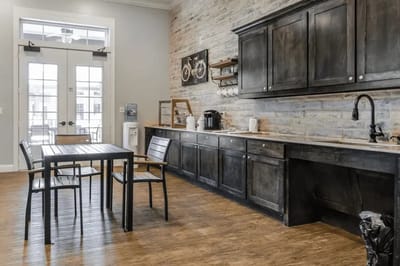
With two distinct residential-style neighborhoods featuring private suites and spacious living spaces, the community offers a comforting and homely environment. Residents can access various amenities, including a cozy café, a serene chapel, and inviting common areas for relaxation and enjoyment. Life engagement is at the core of the community’s values, evidenced by a diverse range of activities such as exercise programs, gardening, and art classes. The outdoor areas are thoughtfully secured, allowing residents to relish nature’s beauty while feeling safe and protected.
36-bed community Rank #740 / 972Bed count — State benchmarkedThis home is ranked 740th out of 972 homes in Texas for bed count. Shows this facility's certified or reported bed count compared to other Texas facilities. Larger communities may offer more amenities, programs, and on-site services for residents and families.Facilities with the same value for a metric share the same rank. Rankings are based only on facilities in Texas that report data for that category. Facilities without available data are excluded from the ranking.Click the rank badge to see the full State ranking.Click here to see the full State ranking.
A moderately sized community that may balance personal attention with shared amenities and social activities.
8 years in operation Rank #463 / 585Years in operation — State benchmarkedThis home is ranked 463rd out of 585 homes in Texas for years in operation. Shows how long this facility has been in operation compared to other Texas facilities. Longer operating histories may benefit residents, families, and staff.Facilities with the same value for a metric share the same rank. Rankings are based only on facilities in Texas that report data for that category. Facilities without available data are excluded from the ranking.Click the rank badge to see the full State ranking.Click here to see the full State ranking.
An established community with some operational experience and growing routines.
Walk Score: 27 / 100 Rank #975 / 1389Walk Score — State benchmarkedThis home is ranked 975th out of 1389 homes in Texas for walk score. Shows how walkable this facility's neighborhood is compared to the average walk score across Texas facilities. Higher scores benefit residents, families, and staff.Facilities with the same value for a metric share the same rank. Rankings are based only on facilities in Texas that report data for that category. Facilities without available data are excluded from the ranking.Click the rank badge to see the full State ranking.Click here to see the full State ranking.
Somewhat walkable. A few nearby services may be reachable on foot, but most trips require transportation.
About this community
Facility TypeType B
ExpirationJune 10, 2027
CountyCollin
License Number148236
Year Opened10/6/2017
Grand Brook Memory Care of Allen at Twin Creeks is legally operated by Allen Memory Care LLC, and administered by Joanna Razowski.
Management CompanyCONSTANT CARE MANAGEMENT COMPANY, LLC
OwnerAllen Memory Care LLC
Ownership TypeLimited Liability Company (LLC)
Alzheimer's Units
36 units
Total beds
36 units
Secured Perimeter
Emergency SystemsEmergency response systems available.
Staffing
Key information about the people who lead and staff this community.
Administrator Emailjlopez@constantcare.com
Respite Care
Nursing Services
24-Hour Staffing
Alzheimer's Certification
Licensed Nursing Available 7 Days A Week
Compassionate Staff On-Site 24 Hours A Day
Thoughtfully Prepared Meals
Individualized Meal Planning
Regular Housekeeping And Personal Laundry Service
Secure Community With Monitoring Systems
Comfortable Common Areas
ActivitiesEngaging group and individual life enrichment activities supporting mind, body, and spirit
Specific ProgramsDay Stay & Respite, Life Engagement Program, Individualized care, Medication management & coordination, Ongoing health monitoring, Engaging group and individual life enrichment activities
Religious Services
Inspection History
In Texas, the Health and Human Services Commission (HHSC) is the primary regulatory body that conducts unannounced inspections and publishes quality reports for all long-term care homes.
Since 2023 · 3 years of data
6 citations
2 inspections
Inspection Scorecard
 This scorecard compares key inspection, citation, and complaint metrics at this facility against the Texas state average. Metrics rated ≥15% worse than average are highlighted in red; those ≥15% better are highlighted in green.
Since 2023 vs. Texas state average
Overall vs. TX average
2 Worse
Metrics worse than Texas average:
• Health citations (50% above)
• Inspections with citations (100% above) 1 At Avg Metrics at Texas average:
• Total citations (at TX avg) 1 Better Metrics better than Texas average:
• Life safety citations (50% below)
• Health citations (50% above)
• Inspections with citations (100% above) 1 At Avg Metrics at Texas average:
• Total citations (at TX avg) 1 Better Metrics better than Texas average:
• Life safety citations (50% below)
Citations
| This Facility | TX Average | vs. TX Avg |
|---|---|---|---|
|
Total citations
| 6 | 6 | This facility has total citations in line with the Texas average (6 vs. TX avg 6).— At avg |
|
Health citations
| 3 | 2 | This facility has 50% more health citations than a typical Texas nursing home (3 vs. TX avg 2).↑ 50% worse |
|
Life safety citations
| 3 | 6 | This facility has 50% fewer life safety citations than a typical Texas nursing home (3 vs. TX avg 6).↓ 50% better |
Inspections
| This Facility | TX Average | vs. TX Avg |
|---|---|---|---|
|
Inspections with citations
| 2 | 1 | This facility has 100% more inspections with citations than a typical Texas nursing home (2 vs. TX avg 1).↑ 100% worse |
Inspection Reports Summary
An editor-reviewed summary of the themes and findings across this facility's recent inspection reports.
- January 2, 2023 inspection found five deficiencies including failure to assess residents, improper food handling, and fire safety training and documentation lapses.
- Fire safety violations included missing annual fire marshal inspection, lack of staff training on fire extinguishers, and failure to maintain smoke compartmentation.
- Deficiencies showed consistent problems in resident care planning, food safety, and fire safety compliance without any complaint investigations reported.
What does this home offer?
No pets allowed
Room Sizes: 304 / 321 / 336 / 375 / 384 - 391 sq. ft
Housing Options: 1 Bed / 2 Bed
Building Type: Single-story
Beauty Services
Transportation Services
Housekeeping Services
Social and Recreational Activities
Exercise Programs
Living Spaces & Floor Plans for Grand Brook Memory Care of Allen at Twin Creeks
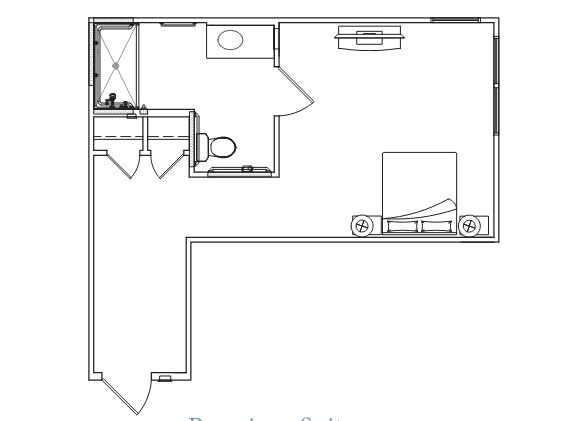
Suite
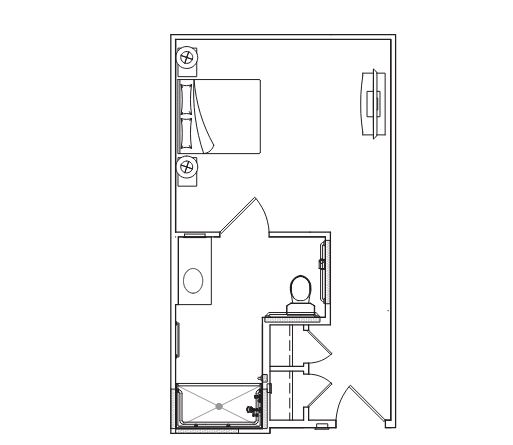
Suite
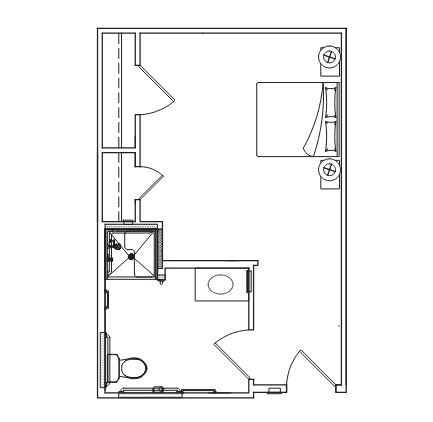
Suite
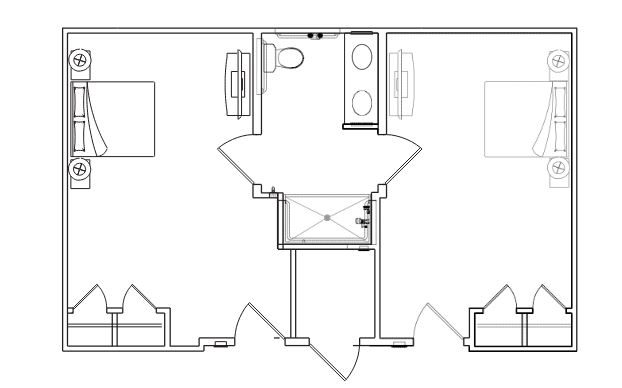
Suite
Places of interest near Grand Brook Memory Care of Allen at Twin Creeks
![]() 1.3 miles from city center
1.3 miles from city center
![]() Estimated distance in miles from Allen's city center to Grand Brook Memory Care of Allen at Twin Creeks's address, calculated via Google Maps.
— 5.31 miles to nearest hospital (Baylor Scott & White Medical Center - Centennial)
Estimated distance in miles from Allen's city center to Grand Brook Memory Care of Allen at Twin Creeks's address, calculated via Google Maps.
— 5.31 miles to nearest hospital (Baylor Scott & White Medical Center - Centennial)
Calculate Travel Distance to Grand Brook Memory Care of Allen at Twin Creeks
Add your location
Compare Nursing Homes around the area
Info below is compiled from CMS reports & the TX Health & Human Services Commission (HHSC), senior community websites & trusted data sources such as Walk Score & BBB.
Communities are listed from highest to lowest based on our ranking methodology.
| Meadow Lake Senior Living – Tyler | NH AL IL MC RC SNF | Tyler | 20
Facility
20
TX AVG
79
Rank
#788 / 972 | - | - | 4.30
Facility
4.30
TX AVG
3.63
Rank
#51 / 239 | +156% | +18% | $0
Facility
$0
TX AVG
$81.8k
Rank
#1 / 244 | 4
Facility
4
TX AVG
25.9
Rank
#2 / 241 | 1.3
Facility
1.3
TX AVG
3.7
Rank
#2 / 241 | - | 27 | A+ |
33
Facility
33
TX AVG
41
Rank
#882 / 1389 | Robbin Bell | $9.8MFiscal year ending 12/2023
Facility
$9.8MFiscal year ending 12/2023
TX AVG
$8.4M
Rank
#117 / 245 | $5.0MFiscal year ending 12/2023
Facility
$5.0MFiscal year ending 12/2023
TX AVG
$3.5M
Rank
#104 / 245 | 51.5%Fiscal year ending 12/2023
Facility
51.5%Fiscal year ending 12/2023
TX AVG
47%
Rank
#91 / 245 | 676286 | ||||
| Windsor Nursing and Rehabilitation Center of Harlingen | NH MC RC SNF | Harlingen | 154
Facility
154
TX AVG
79
Rank
#60 / 972 |
79.7%
Facility
79.7%
TX AVG
67.3
Rank
#61 / 195 | +18% | 2.99
Facility
2.99
TX AVG
3.63
Rank
#207 / 239 | -14% | -18% | $0
Facility
$0
TX AVG
$81.8k
Rank
#1 / 244 | 12
Facility
12
TX AVG
25.9
Rank
#30 / 241 | 3.0
Facility
3.0
TX AVG
3.7
Rank
#100 / 241 | - | 123 | - |
44
Facility
44
TX AVG
41
Rank
#645 / 1389 | Regency Ihs Of Harlingen Manor LLC | $10.4MFiscal year ending 12/2023
Facility
$10.4MFiscal year ending 12/2023
TX AVG
$8.4M
Rank
#110 / 245 | $4.5MFiscal year ending 12/2023
Facility
$4.5MFiscal year ending 12/2023
TX AVG
$3.5M
Rank
#102 / 245 | 43.6%Fiscal year ending 12/2023
Facility
43.6%Fiscal year ending 12/2023
TX AVG
47%
Rank
#102 / 245 | 455822 | ||||
| Parkwood Assisted Living | NH AL HOS MC PC RC SNF | Bedford | 84
Facility
84
TX AVG
79
Rank
#453 / 972 | - | - | 4.87
Facility
4.87
TX AVG
3.63
Rank
#19 / 239 | -36% | +34% | $0
Facility
$0
TX AVG
$81.8k
Rank
#1 / 244 | 15
Facility
15
TX AVG
25.9
Rank
#55 / 241 | 3.8
Facility
3.8
TX AVG
3.7
Rank
#167 / 241 | - | 103 | - |
34
Facility
34
TX AVG
41
Rank
#863 / 1389 | Lcs Phc Operator Mm LLC | $8.2MFiscal year ending 12/2023
Facility
$8.2MFiscal year ending 12/2023
TX AVG
$8.4M
Rank
#128 / 245 | $5.8MFiscal year ending 12/2023
Facility
$5.8MFiscal year ending 12/2023
TX AVG
$3.5M
Rank
#83 / 245 | 70.3%Fiscal year ending 12/2023
Facility
70.3%Fiscal year ending 12/2023
TX AVG
47%
Rank
#47 / 245 | 675565 | ||||
| Mrc the Crossings | NH AL IL MC SNF | League City | 48
Facility
48
TX AVG
79
Rank
#685 / 972 |
88.8%
Facility
88.8%
TX AVG
67.3
Rank
#38 / 195 | +32% | 4.65
Facility
4.65
TX AVG
3.63
Rank
#32 / 239 | -18% | +28% | $0
Facility
$0
TX AVG
$81.8k
Rank
#1 / 244 | 1
Facility
1
TX AVG
25.9
Rank
#1 / 241 | 1.0
Facility
1.0
TX AVG
3.7
Rank
#1 / 241 | - | 43 | - |
21
Facility
21
TX AVG
41
Rank
#1077 / 1389 | Happy Harbor Methodist Home, Inc | $6.2MFiscal year ending 12/2023
Facility
$6.2MFiscal year ending 12/2023
TX AVG
$8.4M
Rank
#42 / 245 | $6.2MFiscal year ending 12/2023
Facility
$6.2MFiscal year ending 12/2023
TX AVG
$3.5M
Rank
#39 / 245 | 99.7%Fiscal year ending 12/2023
Facility
99.7%Fiscal year ending 12/2023
TX AVG
47%
Rank
#108 / 245 | 676400 |
Frequently Asked Questions about Grand Brook Memory Care of Allen at Twin Creeks
Who is the owner of Grand Brook Memory Care of Allen at Twin Creeks?
Grand Brook Memory Care of Allen at Twin Creeks is legally operated by Allen Memory Care LLC, and administered by Joanna Razowski.
Is Grand Brook Memory Care of Allen at Twin Creeks in a walkable area?
Grand Brook Memory Care of Allen at Twin Creeks has a walk score of 27. Somewhat walkable. A few nearby services may be reachable on foot, but most trips require transportation.
What is the license number of Grand Brook Memory Care of Allen at Twin Creeks?
According to TX state health department records, Grand Brook Memory Care of Allen at Twin Creeks's license number is 148236.
When does Grand Brook Memory Care of Allen at Twin Creeks's license expire?
According to TX state health department records, Grand Brook Memory Care of Allen at Twin Creeks's license expires on June 10, 2027.
How long has Grand Brook Memory Care of Allen at Twin Creeks been in business?
Grand Brook Memory Care of Allen at Twin Creeks has been operating for approximately 8 years, based on available licensing and registration records.
Does Grand Brook Memory Care of Allen at Twin Creeks have different floorplan options?
Yes — see the floorplan options available at Grand Brook Memory Care of Allen at Twin Creeks on this page.
Are pets allowed at Grand Brook Memory Care of Allen at Twin Creeks?
No, Grand Brook Memory Care of Allen at Twin Creeks has a no-pet policy.
Guides for Better Senior Living
Care Cost Calculator: See Prices in Your Area
Nursing Home Data Explorer
Don’t Wait Too Long: 7 Red Flag Signs Your Parent Needs Assisted Living Now
The True Cost of Assisted Living in 2025 – And How Families Are Paying For It
Understanding Senior Living Costs: Pricing Models, Discounts & Financial Assistance
Updated on
