


Grand Valley Health & Rehab
Nursing Home, Adult Day Care, Hospice Care, Respite Care & Skilled Nursing · Martinsville, IN

Grand Valley Health & Rehab

Nursing Home, Adult Day Care, Hospice Care, Respite Care & Skilled Nursing · Martinsville, IN

Overview of Grand Valley Health & Rehab

Grand Valley Health & Rehab is a 100-bed skilled nursing facility at 621 Grand Valley Boulevard in Martinsville, Indiana. Operated by the Board of Trustees of the Flavius J. Witham Memorial—a hospital-affiliated nonprofit—the community is led by Administrator Chelsea Frederick and serves Morgan County with a focus on high-acuity long-term care and rehabilitation. The 2026 CMS data identifies this center as a “Much Above Average” 5-star facility across health inspections, staffing, and clinical quality.

This hospital-linked nonprofit framework ensures 24-hour medical supervision for residents requiring complex clinical stabilization. Current 2026 performance metrics show the facility maintains a citations-per-inspection rate of zero based on its most recent recertification survey and multiple complaint investigations. Occupancy is robust at 91%, outperforming the Indiana state average of 68.1%. While the facility remains accessible for Medicare and private-pay residents, the primary payer mix is Medicaid-funded.

Professional care is managed 24/7 with a total nursing allocation of 4 hours and 19 minutes per resident daily—37 minutes more than the Indiana average. Certified Nursing Assistant (CNA) hours are a significant highlight at 3 hours and 39 minutes daily, while Registered Nurse (RN) coverage provides high-level oversight for complex needs. Clinical outcomes are strong, with 96% of short-stay residents meeting or exceeding self-care goals at discharge, a rate approximately 15% better than state norms. Although the facility maintains a successful community-return rate of 60.4%, emergency department utilization for short-stay residents is 22.0%, reflecting a proactive approach to acute medical intervention.

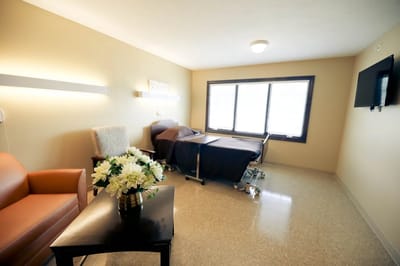
The campus provides private and semi-private floor plans equipped with individual climate controls and 24-hour emergency monitoring. All-inclusive monthly services cover three dietitian-approved meals daily, housekeeping, and personal laundry.

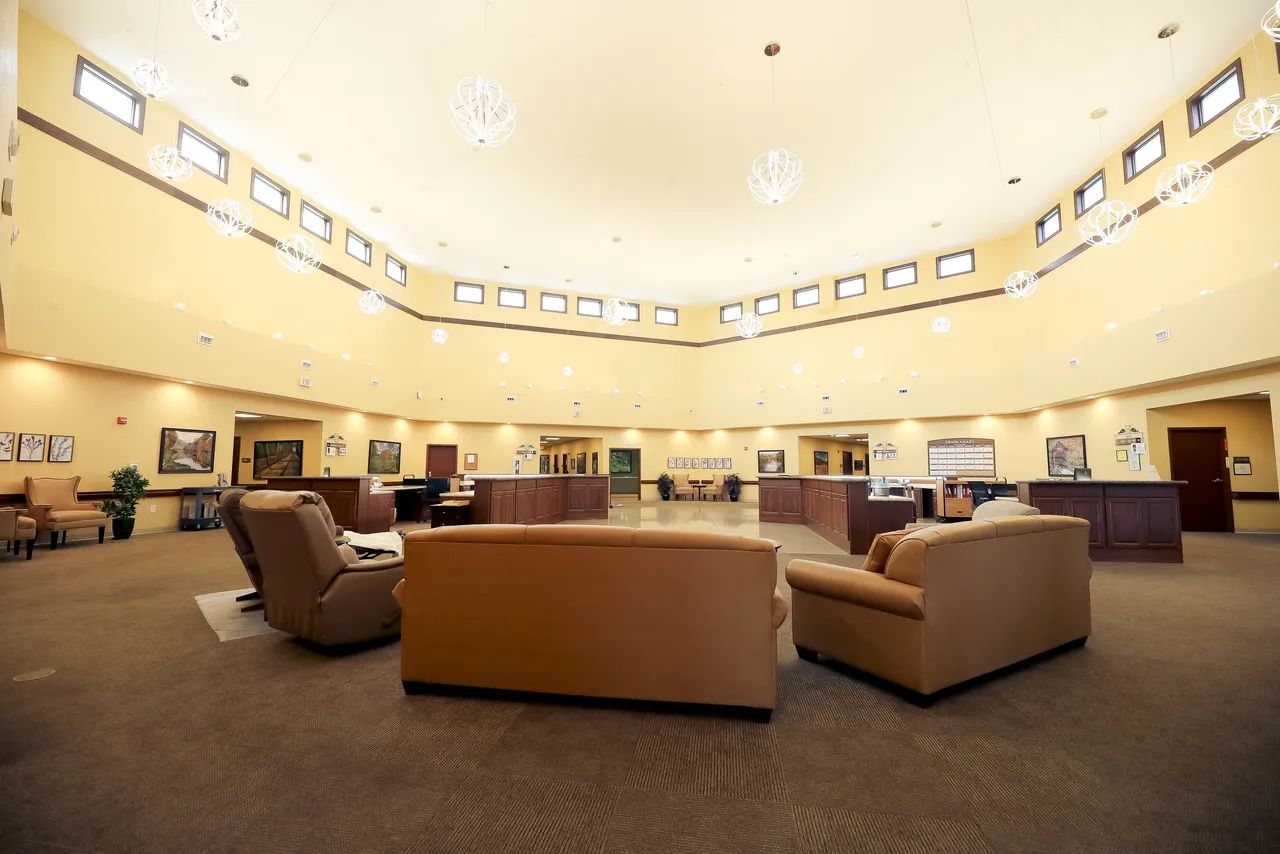
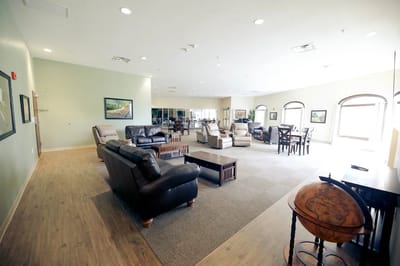
Shared community spaces include social lounges, a media room, and on-site beautician services. The social calendar is managed by an activity director to provide cognitive engagement and wellness programming for both long-term and short-stay residents. With a Walk Score of 72, the facility offers convenient access to central Martinsville, while also providing scheduled transportation for medical appointments.

Older adults requiring medically complex long-stay care or high-performing functional rehabilitation may find this 5-star environment appropriate. To assess current quality firsthand, prospective residents and their representatives should visit the campus directly and request 2026 status reports on specific clinical stabilization protocols.

Staffing hours breakdown

Info Daily nursing hours per resident by staff type, reported to CMS. Higher is generally better — compare this facility to state and national averages to see where staffing stands.

Hours per resident per day — compared to state averages

Staff typeHours / Day / Residentvs state avg
Registered Nurse (RN) Info RNs hold the highest nursing license and can assess residents, interpret test results, and direct care plans. More RN hours per day often signals stronger clinical oversight and faster response to health changes. 29m per day ▼ 28% State avg: 40m per day · National avg: 41m per day
LPN / LVN Info Licensed Practical Nurses (LPNs) or Licensed Vocational Nurses (LVNs) deliver routine hands-on care — medication administration, wound dressing, and monitoring vital signs. They work under RN supervision and make up a large share of daily bedside care. 38m per day ▼ 17% State avg: 46m per day · National avg: 52m per day
Nurse Aide Info Certified Nurse Aides (CNAs) provide the most direct day-to-day assistance: bathing, dressing, feeding, and mobility. Nurse aide hours are typically the largest staffing category and directly affect residents' quality of life. 2h 49m per day ▲ 24% State avg: 2h 16m per day · National avg: 2h 20m per day
Weekend Total Nursing Info Combined nursing hours (RN + LPN + Nurse Aide) per resident per day on weekends. Staffing often drops on weekends — this figure reveals whether the facility maintains adequate coverage outside of weekday hours. 3h 21m per day ▲ 4% State avg: 3h 14m per day · National avg: 3h 26m per day
Physical Therapist Info Hours per resident per day provided by licensed Physical Therapists (PTs) or PT Assistants. PT services help residents recover mobility after injury or illness and are especially important for post-acute (short-stay) rehabilitation. 5m per day ▲ 25% State avg: 4m per day · National avg: 4m per day
Weekend RN Info Registered nurse hours specifically on weekends. Facilities sometimes reduce RN presence on Saturdays and Sundays — a low weekend RN figure compared to weekday hours can indicate reduced clinical oversight when most administrative staff are absent. 18m per day ▼ 33% State avg: 27m per day · National avg: 28m per day
Bed community size
100-bed community
A larger shared setting that may offer more common spaces and organized community services.
Years in operation
1 year in operation
A newer community that may feature more recent facilities and programs.
Walk Score
Walk Score: 72 / 100
Very walkable. Most errands can be accomplished on foot, and many essentials are within a short walk.

About this community

Occupancy

Occupancy rate
91%
Rank #25 / 427Occupancy rate — State benchmarkedThis home is ranked 25th out of 427 homes in Indiana for Occupancy. Shows this facility's occupancy rate versus the Indiana average, with its Statewide rank out of 427. Higher occupancy signals strong local demand and financial stability.Facilities with the same value for a metric share the same rank. Rankings are based only on facilities in Indiana that report data for that category. Facilities without available data are excluded from the ranking.Click the rank badge to see the full State ranking.Click here to see the full State ranking.
Higher than the Indiana average: 68.1%
Occupied beds
91 / 100
Average occupied beds in Indiana homes 70 beds

License Details

Facility TypeNursing Home / Skilled Nursing Facility / Nursing Facility Dually Certified
StatusActive
IssuanceOctober 1, 2024
ExpirationSeptember 30, 2026
License Number24-000400-1

Ownership & Operating Entity

Grand Valley Health & Rehab is legally operated by Board Of Trustees Of The Flavius J Witham Memorial, and administered by Chelsea Frederick.

Profit StatusOther

Type Of Units

SNF/NF (Combined)
100 units
Total beds
100 units

Staffing

Key information about the people who lead and staff this community.

Leadership

Director of NursingJennifer Nail

Therapy & Rehabilitation

1 service
Rehabilitation Services

Contact Information

Fax(765) 349-5773

Amenities & Lifestyle

Specific ProgramsLevel of Care, Employees

Contact Grand Valley Health & Rehab

Inspection History

In Indiana, the Department of Health, Division of Long Term Care is the primary regulatory body that performs onsite inspections and quality of care reviews for all licensed facilities.

Since 2022 · 4 years of data 11 deficiencies 15 inspections
Inspection Score Info A composite 0–100 score combining this facility's inspections, deficiencies, complaints, and enforcement actions relative to the Indiana state average. The score below shows how many points this facility sits above or below the typical Indiana assisted living residence score (the benchmark); higher is better.This is a proprietary Assisted Living Magazine score.

8 points above the Indiana average for assisted living residences (83/100)

Inspection score: 91 out of 100. Letter grade A-. 8 points above the Indiana average for assisted living residences (83/100)

Inspection Scorecard Info This scorecard compares key inspection, deficiency, and complaint metrics at this facility against the Indiana state average. Metrics rated ≥15% worse than average are highlighted in red; those ≥15% better are highlighted in green.

Since 2022 vs. Indiana state average
Overall vs. IN average 0 Worse No metrics in this bucket. 6 Better Metrics better than Indiana average:
• Total deficiencies (69% below)
• Deficiencies per year (69% below)
• Deficiencies per inspection (63% below)
• Inspections with deficiencies (57% below)
• Inspection deficiency rate (46% below)
• Inspections (38% below)
Latest Inspection January 16, 2025 Complaint Investigation

Deficiencies Info Deficiencies are formal regulatory issues recorded during state inspections.

This FacilityIN Averagevs. IN Avg
Total deficiencies Info Formal regulatory issues recorded by inspectors across all inspection types. 1136 This facility has 69% fewer total deficiencies than a typical Indiana assisted living residence (11 vs. IN avg 36).↓ 69% better
Deficiencies per year Info Average deficiencies per year since 2022. 2.89 This facility has 69% fewer deficiencies per year than a typical Indiana assisted living residence (2.8 vs. IN avg 9).↓ 69% better
Deficiencies per inspection Info Average deficiencies per inspection. 0.71.9 This facility has 63% fewer deficiencies per inspection than a typical Indiana assisted living residence (0.7 vs. IN avg 1.9).↓ 63% better

Inspections Info State inspections evaluate whether the facility meets health and safety standards.

This FacilityIN Averagevs. IN Avg
Total visits Info Combined count of all on-site visits — routine inspections, complaint visits, follow-ups, and other focused visits. 1519 This facility has had 21% fewer total visits than the Indiana average (15 vs. IN avg 19). More inspections can mean more regulatory scrutiny rather than worse care.↓ 21% fewer
Inspections with deficiencies Info Inspections that resulted in at least one regulatory deficiency. 37 This facility has 57% fewer inspections with deficiencies than a typical Indiana assisted living residence (3 vs. IN avg 7).↓ 57% better
Inspection deficiency rate Info Percentage of inspections that resulted in at least one deficiency. 20%37% This facility has 17 percentage points lower inspection deficiency rate than a typical Indiana assisted living residence (20% vs. IN avg 37%).↓ 17% better
Inspections Info Routine, scheduled inspections conducted by state regulators. 813 This facility has 38% fewer inspections than a typical Indiana assisted living residence (8 vs. IN avg 13).↓ 38% better

Inspection Reports Summary Info An editor-reviewed summary of the themes and findings across this facility's recent inspection reports.

  • The most recent inspection on January 16, 2025, found no deficiencies related to the complaint investigated and the facility was in compliance with regulations.
  • The June 11, 2024, survey cited seven deficiencies in emergency preparedness and fire safety, including failure to conduct required drills and overdue sprinkler system inspection.
  • The April 28, 2023, survey found three deficiencies involving resident transfer notifications and unlabeled oxygen tubing, but no harm-level citations were issued.

Quality of care over time

These measures show how residents usually do over time at this home, based on health outcomes and preventive care.

Long-stay resident measures
Below average Info CMS star rating based on long-stay quality measure performance. 5 stars = significantly above average, 1 star = significantly below average.
Hospitalizations per 1,000 days Info Number of hospitalizations per 1,000 long-stay resident days. 1.64
In line with State average

State average: 1.60

ED visits per 1,000 days Info Number of outpatient emergency department visits per 1,000 long-stay resident days. 2.93
98% worse than State average

State average: 1.48

Short-stay resident measures
Above average Info CMS star rating based on short-stay quality measure performance. 5 stars = much above average, 1 star = much below average.
Re-hospitalized after SNF stay Info Percentage of short-stay residents who were re-hospitalized after their nursing home admission. 24.2%
8% worse than State average

State average: 22.4%

Emergency department visits Info Percentage of short-stay residents who had an outpatient emergency department visit. 22.0%
110% worse than State average

State average: 10.5%

Falls with major injury Info Percentage of SNF residents who experience falls with major injury during their stay. 0.9%
18% worse than State average

State average: 0.8%

Ability to care for self at discharge Info Percentage of residents at or above expected ability to care for themselves at discharge. 74.0%
38% better than State average

State average: 53.7%

Successful return to home or community Info Rate of successful return to home or community from a skilled nursing facility. 60.4%
19% better than State average

State average: 50.6%

Places of interest near Grand Valley Health & Rehab

Address 0.0 miles from city center Info Estimated distance in miles from Martinsville's city center to Grand Valley Health & Rehab's address, calculated via Google Maps.

Calculate Travel Distance to Grand Valley Health & Rehab

Add your location

Address

Compare Nursing Homes around the area

The information below is reported by the Indiana Department of Health, Division of Long Term Care.

The Barrington of Carmel
NH
AL
IL
MC
SNF
Carmel -154 A+ 39 Studio / 1 Bed / 2 Bed
Westminster Village Muncie
NH
AL
IL
SNF
Muncie -303 A+ 6 Studio / 1 Bed / 2 Bed
Greenwood Village South
NH
AL
IL
MC
SNF
Greenwood -207 A+ 50 Apartment / Cottage
Christian Care Retirement Community
NH
AL
IL
MC
SNF
Bluffton (Toll Gate Heights) -145 - 4 1 Bed / 2 Bed / 3 Bed

Frequently Asked Questions about Grand Valley Health & Rehab

Who is the Director of Nursing at Grand Valley Health & Rehab?

Jennifer Nail is the Director of Nursing at Grand Valley Health & Rehab.

Who is the owner of Grand Valley Health & Rehab?

Grand Valley Health & Rehab is legally operated by Board Of Trustees Of The Flavius J Witham Memorial, and administered by Chelsea Frederick.

Is Grand Valley Health & Rehab in a walkable area?

Grand Valley Health & Rehab has a walk score of 72. Very walkable. Most errands can be accomplished on foot, and many essentials are within a short walk.

What is the license number of Grand Valley Health & Rehab?

According to IN state health department records, Grand Valley Health & Rehab's license number is 24-000400-1.

When does Grand Valley Health & Rehab's license expire?

According to IN state health department records, Grand Valley Health & Rehab's license expires on September 30, 2026.

What is the occupancy rate at Grand Valley Health & Rehab?

Grand Valley Health & Rehab's occupancy is 91%.

Who is the administrator of Grand Valley Health & Rehab?

Chelsea Frederick is the administrator of Grand Valley Health & Rehab.

Guides for Better Senior Living

Care Cost Calculator: See Prices in Your Area

Nursing Home Data Explorer

Don’t Wait Too Long: 7 Red Flag Signs Your Parent Needs Assisted Living Now

The True Cost of Assisted Living in 2025 – And How Families Are Paying For It

Understanding Senior Living Costs: Pricing Models, Discounts & Financial Assistance


