Greenwood Health & Living Community
Nursing Home, Hospice Care & Respite Care · Greenwood, IN
CMS overall rating Info The Overall CMS Rating is scored from 1 to 5 stars and combines results from health inspections, staffing levels, and quality measures. Health inspections carry the most weight. Staffing and quality scores can increase or decrease the final rating based on performance compared to state and national standards.

Greenwood Health & Living Community

Nursing Home, Hospice Care & Respite Care · Greenwood, IN
CMS overall rating Info The Overall CMS Rating is scored from 1 to 5 stars and combines results from health inspections, staffing levels, and quality measures. Health inspections carry the most weight. Staffing and quality scores can increase or decrease the final rating based on performance compared to state and national standards.
Calculator: See prices in your area
Greenwood Health & Living Community accepts Medicare, Medicaid, and private pay.

Overview of Greenwood Health & Living Community

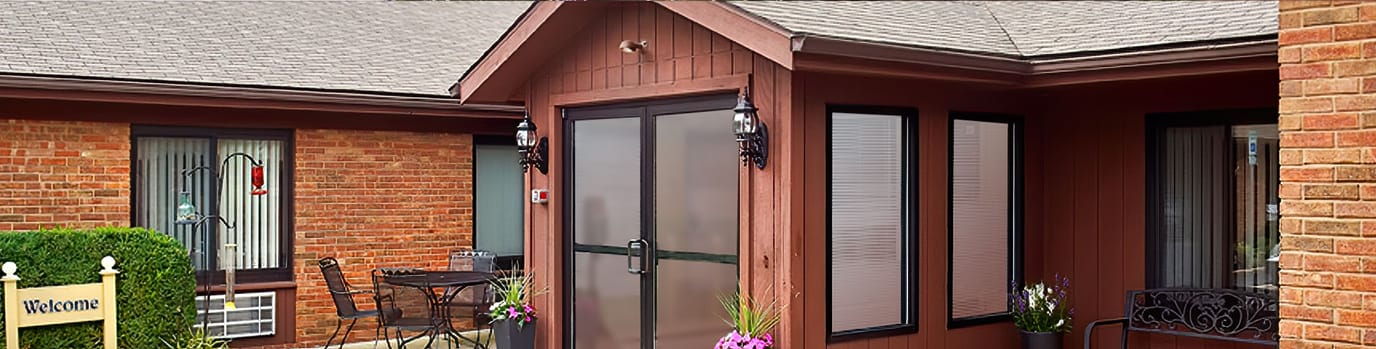
Greenwood Health & Living Community is a nursing home in Greenwood, IN, offering long-term care, hospice care, rehabilitation, and respite care. With its close-knit atmosphere, the community ensures older adults are treated well throughout their stay. Excellent services, including 24-hour care, three well-balanced meals daily, and scheduled transportation, are also provided to enrich residents’ living experiences. The community also works closely with residents and their families to provide care plans tailored to their unique needs and preferences.

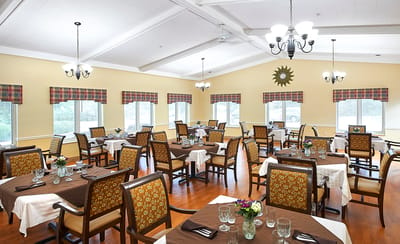
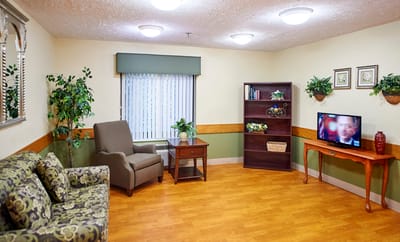
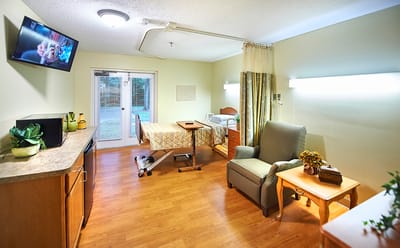
Light exercises, social events, and various recreational opportunities encourage residents to stay active and have fun. With lively gathering areas and spacious rooms, residents can rest and move around comfortably. Residents also experience a laid-back lifestyle, as it is conveniently located in the tree-lined neighborhood of Greenwood. This nursing home is a great choice for senior living in Indiana, especially with its commitment to improving older adults’ well-being.

(317) 881-3535

Quality ratings

Measured by Centers for Medicare & Medicaid Services (CMS)

Overall rating Info The Overall CMS Rating combines results from health inspections, staffing levels and quality measures. Health inspections carry the most weight. Staffing and quality scores can increase or decrease the final rating based on performance compared to state and national standards.
▼ 2.8% Below IN avg.
Health Inspection Info Based on the results of the facility's three most recent standard inspections and any complaint investigations. CMS reviews the number, scope, and severity of deficiencies, with more recent findings weighted more heavily.
▲ 6.8% Above IN avg.
Staffing Info Measures average nursing staff hours per resident per day, including Registered Nurses (RNs) and total nursing staff. Ratings are adjusted based on the level of care residents require and are compared to state and national benchmarks.
▼ 59.3% Below IN avg.
Quality Measures Info Based on clinical and physical health indicators reported to CMS, such as hospital readmissions, falls, pressure ulcers, and improvements in mobility. These measures reflect how well residents' health needs are being managed.
▲ 22.3% Above IN avg.

Staffing hours breakdown

Info Daily nursing hours per resident by staff type, reported to CMS. Higher is generally better — compare this facility to state and national averages to see where staffing stands.

Hours per resident per day — compared to Indiana state averages

Total nursing care / resident Info This home is ranked 209th out of 267 homes in Indiana.

Total adjusted nursing hours per resident per day, combining RN, LPN, and aide time. CMS adjusts this for case-mix so facilities can be fairly compared.
2h 53m per day
Rank #209 / 267Nurse hours — state benchmarkedThis home is ranked 209th out of 267 homes in Indiana.Shows adjusted nurse hours per resident per day benchmarked to the Indiana average, with a ranking across 267 Indiana SNFs. More hours mean more direct care. The national average is about 3.5 hrs; below 3.0 is a red flag.
This facility Indiana avg (3h 26m per day)
vs Indiana avg
-16%
Staff typeHours / dayvs state avg
Total Nursing (Weekend) Info Combined nursing hours (RN + LPN + Nurse Aide) per resident per day on weekends. Staffing often drops on weekends — this figure reveals whether the facility maintains adequate coverage outside of weekday hours. 2h 35m per day

Capacity and availability

This home usually has availability

Occupancy lower than 85% suggests more openings may be available.

Higher occupancy than the Indiana average: 69.4%
Occupancy rate 76.1% Rank #87 / 269Occupancy rate — state benchmarkedThis home is ranked 87th out of 269 homes in Indiana.Shows this facility's occupancy rate versus the Indiana average, with its statewide rank out of 269. Higher occupancy signals strong local demand and financial stability.
Avg. Length of Stay 109 days
Occupancy rate
76.1% Rank #87 / 269Occupancy rate — state benchmarkedThis home is ranked 87th out of 269 homes in Indiana.Shows this facility's occupancy rate versus the Indiana average, with its statewide rank out of 269. Higher occupancy signals strong local demand and financial stability.
Avg. Length of Stay
109 days

Who this home usually serves

TYPE OF STAY

Primarily short stays

Residents typically stay for brief periods, with frequent admissions and discharges throughout the year.

Breakdown by payment type

Medicare

23% of new residents, usually for short-term rehab.

Typical stay 1 - 2 months

Private pay

65% of new residents, often for short stays.

Typical stay 1 - 2 months

Medicaid

12% of new residents, often for long-term daily care.

Typical stay 2 - 3 years

Finances and operations

Governmental community
Operated by county authorities.
Home revenue
$17.0M
Surplus of revenue
$556.9K
Governmental community Operated by county authorities.
Home revenue
$17.0M Rank #39 / 267Revenue — state benchmarkedThis home is ranked 39th out of 267 homes in Indiana.Shows this facility's annual revenue compared to the Indiana SNF average. Higher revenue generally means more resources for staffing and capital — read alongside Payroll %.
Surplus of revenue
$556.9K
Payroll costs Info The portion of the home's budget spent on staff, including nurses, caregivers, and other employees who support care and operations. Rank #100 / 267Payroll — state benchmarkedThis home is ranked 100th out of 267 homes in Indiana.Shows total annual staff payroll benchmarked to the Indiana average. Higher payroll investment relative to peers often signals better staffing and less reliance on cheaper contract labor.
$6.1M
35.7% of revenue Rank #238 / 267Payroll % — state benchmarkedThis home is ranked 238th out of 267 homes in Indiana.Shows payroll as a percentage of revenue versus the Indiana average. Well-run SNFs often land around 55–65%. Below 25% may signal understaffing or heavy agency use — read with Staffing ratings.
Other operating costs Info All remaining costs needed to run the home, such as food, utilities, building maintenance, supplies and administrative expenses.
$10.4M
Total costs $16.5M
Walk Score
Walk Score: 32 / 100
Somewhat walkable. A few nearby services may be reachable on foot, but most trips require transportation.

What does this home offer?

Building type icon
Building type icon

Building Type: Single-story

On-site medical care and health services icon

On-site Medical Care and Health Services

Rehabilitative support icon

Rehabilitative Support

Beauty services icon

Beauty Services

Dining services icon

Dining Services

Social and recreational activities icon

Social and Recreational Activities

Types of Care at Greenwood Health & Living Community

Nursing Home Hospice Care Respite Care

Contact Greenwood Health & Living Community

Health Inspection History

Inspections
Total health inspections 5

Indiana average 6


Last Health inspection on May 2025

Total health citations
13 Rank #51 / 268Health citations — state benchmarkedThis home is ranked 51st out of 268 homes in Indiana.Shows this facility's total health deficiency citations benchmarked to the Indiana state average, with a ranking across all 268 IN SNFs. Lower citation counts earn a better rank.

Indiana average 25

Citations per inspection
2.6 Rank #57 / 268Citations per inspection — state benchmarkedThis home is ranked 57th out of 268 homes in Indiana.Shows average deficiency citations per CMS inspection for this facility versus the Indiana mean across 268 SNFs with citation data. Lower is better.

Indiana average 4.12


Health citations are formal notices following inspections when they fail to comply with safety and care standards.

9 of 13 citations resulted from standard inspections; 3 of 13 resulted from complaint investigations; and 1 of 13 came from combined inspections (standard and complaint).

Breakdown of citation severity (last 3 years)
Critical Health citations More info
0
100% better than Indiana average

Indiana average: 0.2


Serious Health citations More info 0
100% better than Indiana average

Indiana average: 0.6

0 critical citations More info Indiana average: 0.2

0 serious citations More info Indiana average: 0.6

11 moderate citations More info Indiana average: 23.8

2 minor citations More info Indiana average: 0.4
Citations history (last 3 years)
Abuse/Neglect moderate citation Info Issues related to protecting resident's from harm, including abuse, neglect, or mistreatment. May 23, 2025
Corrected

Infection Control moderate citation Info Issues related to preventing and controlling infections, including hygiene practices and safety protocols. May 23, 2025
Corrected

Quality of Care moderate citation Info Issues related to how well residents receive appropriate treatment and support for their medical and daily care needs. May 23, 2025
Corrected

Quality of Care moderate citation Info Issues related to how well residents receive appropriate treatment and support for their medical and daily care needs. May 23, 2025
Corrected

Financial Assistance for
Nursing Home in Indiana

Greenwood Health & Living Community is located in Greenwood, Indiana.
Here are the financial assistance programs available to residents in Indiana.

Get Financial aid guidance

Aged and Disabled Waiver

Indiana Medicaid A&D Waiver

Age 65+ or disabled
General Indiana resident, Medicaid-eligible, nursing home-level care need.
Income Limits (2025) ~$2,829/month 300% FBR, individual
Asset Limits $2,000 (individual), $3,000 (couple).
IN

Requires level-of-care determination.

Benefits
Personal care (5-7 hours/day) Respite (240 hours/year) Adult day care (~$60/day) Home health services

CHOICE Program

Indiana CHOICE

Age 60+
General Indiana resident, at risk of nursing home.
Income Limits ~$2,000/month varies
Asset Limits $10,000 individual
IN

Limited funding; regional variation.

Benefits
In-home care (3-5 hours/week) Respite (up to 10 days/year) Transportation (~5 trips/month)

Residential Care Assistance Program (RCAP)

Indiana Residential Care Assistance Program

Age 65+
General or blind, or disabled, Indiana resident, in approved facility, low-income or SSI recipient.
Income Limits (2025) ~$1,004/month including SSI
Asset Limits $2,000 (individual), $3,000 (couple).
IN

~50 facilities statewide; per diem rate set by FSSA.

Benefits
Room/board Laundry Minimal care coordination (~$20-$50/day subsidy)

Medicare Savings Program (MSP)

Indiana Medicare Savings Program

Age 65+ or disabled
General Indiana resident, Medicare Part A/B.
Income Limits (2025) ~$2,510/month (QMB), ~$3,380/month (SLMB), ~$3,598/month (QI)—individual.
Asset Limits $9,430 (individual), $14,130 (couple).
IN

Three tiers; no waitlist.

Benefits
Covers Part B premiums ($174.70/month) Deductibles ($240/year) Copays (~20%)

National Family Caregiver Support Program (NFCSP) Respite

Indiana NFCSP Respite Care

Age
General Caregivers of 60+ needing care or 55+ caregivers of others; Indiana resident; functional needs (2+ ADLs).
Income Limits (2025) Prioritizes ~$24,980/year (individual); no strict cap.
Asset Limits Not assessed; need-based.
IN

16 AAAs; prioritizes low-income, rural caregivers.

Benefits
Respite (4-6 hours/week or 5 days/year) Adult day care ($60/day) Caregiver training

VA Aid and Attendance (A&A) and Housebound Benefits

Indiana VA Aid and Attendance/Housebound

Age 65+ or disabled veteran/spouse
General Indiana resident, wartime service, need for ADL help (A&A) or homebound.
Income Limits (2025) Net income < ~$1,984/month (veteran with dependent, A&A); pension offsets income.
Asset Limits ~$155,356 net worth limit
IN

High veteran demand statewide.

Benefits
Cash (~$1,433-$2,642/month veteran, ~$951-$1,318 spouse) for care costs (e.g., in-home, assisted living)

Places of interest near Greenwood Health & Living Community

Address 1.9 miles from city center Info Estimated distance in miles from Greenwood's city center to Greenwood Health & Living Community's address, calculated via Google Maps.

Calculate Travel Distance to Greenwood Health & Living Community

Add your location

Address

Staffing Data (Q2 2025)

This data corresponds to Q2 2025 and is based on CMS Payroll-Based Journal.

Total staff 150
Employees 102
Contractors 48
Staff to resident ratio 1.60:1
1595645% better than Indiana average

Indiana average ratio: 0.00:1

Avg staff/day 44
Average shift 8 hours
0% compared with Indiana average

Indiana average: 7.7 hours

Total staff hours (quarter) 32,209

Nursing staff breakdown

Registered Nurse

Manages medical care and health needs.

Total count 11
Average shift length Info Average shift length. Calculated as total hours divided by days worked and average staff per day. 9.5 hours

No contractors work on this role.

Licensed Practical Nurse

Assists with medical care and medications.

Total count 13
Average shift length Info Average shift length. Calculated as total hours divided by days worked and average staff per day. 8.9 hours

No contractors work on this role.

Certified Nursing Assistant

Helps with daily care and mobility.

Total count 46
Average shift length Info Average shift length. Calculated as total hours divided by days worked and average staff per day. 8.3 hours

No contractors work on this role.

Contractor staffing

Total hours from contractors

11.1%

3,582 contractor hours this quarter

Physical Therapy Assistant: 13 Qualified Social Worker: 12 Physical Therapy Aide: 9 Speech Language Pathologist: 7 Respiratory Therapy Technician: 6 Qualified Activities Professional: 1

Staff by category

Certified Nursing Assistant4604614,74891100%8.3
Licensed Practical Nurse130134,12791100%8.9
Medication Aide/Technician160163,19591100%9.1
Registered Nurse110112,54791100%9.5
Physical Therapy Aide0991,2757481%6.9
Dental Services Staff2029916875%7.8
Respiratory Therapy Technician0668568290%5.4
Clinical Nurse Specialist5058136571%8.8
Dietitian1015887582%7.8
Administrator1015206571%8
Nurse Practitioner1014886167%8
Physical Therapy Assistant013134746774%4.8
Speech Language Pathologist0774736774%6.4
Other Dietary Services Staff2024285965%6.9
Qualified Social Worker012123617077%3.9
Qualified Activities Professional0111431415%10.2
Occupational Therapy Aide1011165864%2
RN Director of Nursing30369910%6.2
46 Certified Nursing Assistant
% of Days 100%
13 Licensed Practical Nurse
% of Days 100%
16 Medication Aide/Technician
% of Days 100%
11 Registered Nurse
% of Days 100%
9 Physical Therapy Aide
% of Days 81%
2 Dental Services Staff
% of Days 75%
6 Respiratory Therapy Technician
% of Days 90%
5 Clinical Nurse Specialist
% of Days 71%
1 Dietitian
% of Days 82%
1 Administrator
% of Days 71%
1 Nurse Practitioner
% of Days 67%
13 Physical Therapy Assistant
% of Days 74%
7 Speech Language Pathologist
% of Days 74%
2 Other Dietary Services Staff
% of Days 65%
12 Qualified Social Worker
% of Days 77%
1 Qualified Activities Professional
% of Days 15%
1 Occupational Therapy Aide
% of Days 64%
3 RN Director of Nursing
% of Days 10%

Facility Characteristics

Source: CMS Long-Term Care Facility Characteristics (Data as of Jan 2026)

Total residents 94
Medicare
4
4.3% of residents
Medicaid
74
78.7% of residents
Private pay or other
16
17% of residents
Programs & Services
Residents Group

Residents meet regularly to discuss policies, care quality, and activities

Active Resident Council

Organized group of residents that meets regularly to discuss facility policies, quality of life, and activities.

Quality of care over time

These measures show how residents usually do over time at this home, based on health outcomes and preventive care.

High-risk clinical events score Info A composite score based on pressure ulcers, falls with injury, weight loss, walking ability decline, and activities of daily living decline. 3.8
53% better than Indiana average

Indiana average: 8.0

Functional decline score Info A composite score based on activities of daily living decline, walking ability decline, and incontinence. 7.7
55% better than Indiana average

Indiana average: 17.1

Long-stay resident measures
Need for Help with Daily Activities Increased Info Percent of long-stay residents whose need for help with daily activities has increased 3.0%
75% better than Indiana average

Indiana average: 12.0%

Walking Ability Worsened Info Percent of long-stay residents whose ability to move independently worsened 0.0%
100% better than Indiana average

Indiana average: 14.4%

Low Risk Residents with Bowel/Bladder Incontinence Info Percent of low risk long-stay residents who lose control of their bowels or bladder 20.0%
18% better than Indiana average

Indiana average: 24.6%

Falls with Major Injury Info Percent of long-stay residents experiencing one or more falls with major injury 3.0%
22% better than Indiana average

Indiana average: 3.9%

High Risk Residents with Pressure Ulcers Info Percent of long-stay high risk residents with pressure ulcers 4.4%
In line with Indiana average

Indiana average: 4.4%

Urinary Tract Infection Info Percent of long-stay residents with a urinary tract infection 0.3%
75% better than Indiana average

Indiana average: 1.2%

Lost Too Much Weight Info Percent of long-stay residents who lose too much weight 8.5%
50% worse than Indiana average

Indiana average: 5.7%

Depressive Symptoms Info Percent of long-stay residents who have depressive symptoms 3.1%
87% better than Indiana average

Indiana average: 24.1%

Antipsychotic Use Info Percent of long-stay residents who received an antipsychotic medication 12.7%
In line with Indiana average

Indiana average: 12.4%

Pneumococcal Vaccine Info Percent of long-stay residents assessed and appropriately given the pneumococcal vaccine 94.9%
In line with Indiana average

Indiana average: 93.7%

Influenza Vaccine Info Percent of long-stay residents assessed and appropriately given the seasonal influenza vaccine 92.5%
In line with Indiana average

Indiana average: 95.4%

Short-stay resident measures
Pneumococcal Vaccine Info Percent of short-stay residents assessed and appropriately given the pneumococcal vaccine 74.7%
9% worse than Indiana average

Indiana average: 81.7%

Antipsychotic medication increase Info Percent of short-stay residents who newly received an antipsychotic medication 0.6%
53% better than Indiana average

Indiana average: 1.4%

Influenza Vaccine Info Percent of short-stay residents assessed and appropriately given the seasonal influenza vaccine 69.9%
11% worse than Indiana average

Indiana average: 79.0%

Penalties and fines

Federal penalties imposed by CMS for regulatory violations, including civil money penalties (fines) and denials of payment for new Medicare/Medicaid admissions.

Source: CMS Penalties Database

No penalties in the past 3 years

No civil money penalties or payment denials were reported in the last 3 years.

Compare Nursing Home around Greenwood

The information below is reported by the Indiana Department of Health, Division of Long Term Care.

2 facilities compared · CMS & IN Dept. of Health data · Updated May 2026

Filter by care type
Greenwood Healthcare Center
NH

Nursing Home Licensed facility providing 24/7 skilled nursing care for residents with complex, ongoing medical needs. Staffed by RNs, LPNs, and CNAs. Inspected and star-rated annually by CMS. Accepts Medicare (short-term rehab) and Medicaid (long-term care).

MC

Memory Care Secured, specialized care for people living with Alzheimer's or dementia. Staff trained in cognitive impairment, with higher staff-to-resident ratios and an environment designed to reduce confusion and wandering risk.

Greenwood185 88.9% +28%2.86 -21%-17%0152.51162 23 Westridge Mgt Co LLC$43.4M$10.1M23.4%155193
Greenwood Health & Living Community
NH

Nursing Home Licensed facility providing 24/7 skilled nursing care for residents with complex, ongoing medical needs. Staffed by RNs, LPNs, and CNAs. Inspected and star-rated annually by CMS. Accepts Medicare (short-term rehab) and Medicaid (long-term care).

HC

Home Care Professional care delivered in the person's own home — from companionship and errands to skilled nursing and therapy. Allows seniors to age in place. Medicare covers skilled home health when medically necessary.

RC

Respite Care Short-term temporary care — days to weeks — to give family caregivers a break. Full care provided during the stay. Often used after hospitalization or to trial a facility before a permanent placement decision.

Greenwood121 76.1% +10%2.89 -23%-16%0132.6-96 32 David Hyatt$17.0M$4.8M28%155412

Guides for Better Senior Living

Care Cost Calculator: See Prices in Your Area

Nursing Home Data Explorer

Don’t Wait Too Long: 7 Red Flag Signs Your Parent Needs Assisted Living Now

The True Cost of Assisted Living in 2025 – And How Families Are Paying For It

Understanding Senior Living Costs: Pricing Models, Discounts & Financial Assistance

Frequently Asked Questions about Greenwood Health & Living Community

Is Greenwood Health & Living Community in a walkable area?

Greenwood Health & Living Community has a walk score of 32. Somewhat walkable. A few nearby services may be reachable on foot, but most trips require transportation.

What is the address of Greenwood Health & Living Community?

Greenwood Health & Living Community is located at 937 Fry Rd, Greenwood, IN 46142.

What is the phone number of Greenwood Health & Living Community?

(317) 881-3535 will put you in contact with the team at Greenwood Health & Living Community.

Is Greenwood Health & Living Community Medicare or Medicaid certified?

Yes — Greenwood Health & Living Community is a CMS-certified provider of Medicare and Medicaid.

Explore Open Rooms
1 Contact details
2 What type of senior care service are you looking for?
3 What budget do you have in mind for senior care?
4 How soon do you need to find care?
5 Additional details

Thank you for your interest!

Our team will be in touch shortly to help with next steps.