Greenwood Village South
Nursing Home, Assisted Living, Independent Living & Memory Care · Greenwood, IN
CMS overall rating Info CMS (the Centers for Medicare & Medicaid Services) is the federal agency that rates nursing home quality. Its Overall Rating runs from 1 to 5 stars, combining health inspections, staffing, and quality measures, with inspections weighted most heavily.

Greenwood Village South

Nursing Home, Assisted Living, Independent Living & Memory Care · Greenwood, IN
CMS overall rating Info CMS (the Centers for Medicare & Medicaid Services) is the federal agency that rates nursing home quality. Its Overall Rating runs from 1 to 5 stars, combining health inspections, staffing, and quality measures, with inspections weighted most heavily.
Calculator: See prices in your area
Greenwood Village South accepts Medicare, Medicaid, and private pay.

Overview of Greenwood Village South

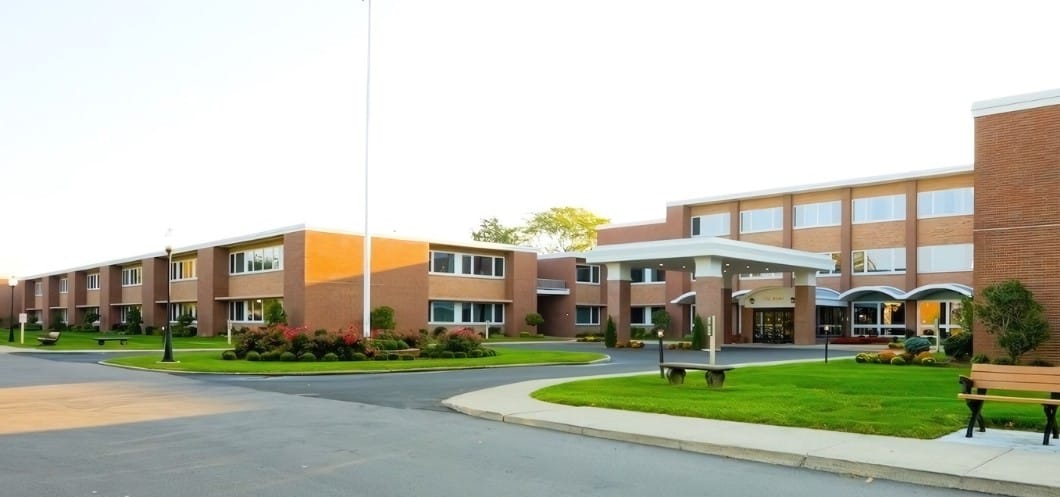
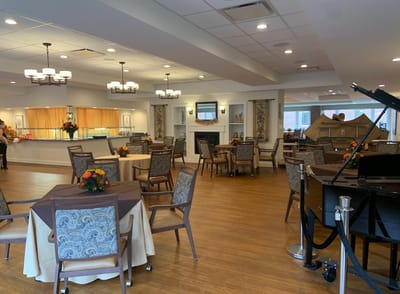
Delivering exceptional services for over 60 years, Greenwood Village South in Greenwood, IN is a well-established senior living community that offers independent living, assisted living, memory care, long-term care, and rehabilitation services. Boasting years of experience and knowledge, the community guarantees exceptional care and supportives services that allows residents to successfully age in place. With its dedication to excellence, the community has been recognized as a Best Continuing Care Retirement Community and Best Assisted Living community by the U.S. News and World Report.

Focused on nurturing residents’ overall physical, social and psychological wellbeing, the community provides a Health and Wellness Team to personally guide residents through the community’s full array of services, amenities and activities. Delicious and healthy culinary delights are served as well for an enjoyable and filling dining experience. At Greenwood Village South, residents live their golden years free of hassles and worries.

Quality ratings

Measured by Centers for Medicare & Medicaid Services (CMS)

Overall rating Info The Overall CMS Rating combines results from health inspections, staffing levels and quality measures. Health inspections carry the most weight. Staffing and quality scores can increase or decrease the final rating based on performance compared to state and national standards.
▲ 62.1% Above IN avg. ▲ 62.1% Above IN avg.IN average: 3.1Click the badge to see the full State ranking.Click here to see the full State ranking.
Health Inspection Info Based on the results of the facility's three most recent standard inspections and any complaint investigations. CMS reviews the number, scope, and severity of deficiencies, with more recent findings weighted more heavily.
▲ 78.1% Above IN avg. ▲ 78.1% Above IN avg.IN average: 2.8Click the badge to see the full State ranking.Click here to see the full State ranking.
Staffing Info Measures average nursing staff hours per resident per day, including Registered Nurses (RNs) and total nursing staff. Ratings are adjusted based on the level of care residents require and are compared to state and national benchmarks.
▲ 62.7% Above IN avg. ▲ 62.7% Above IN avg.IN average: 2.5Click the badge to see the full State ranking.Click here to see the full State ranking.
Quality Measures Info Based on clinical and physical health indicators reported to CMS, such as hospital readmissions, falls, pressure ulcers, and improvements in mobility. These measures reflect how well residents' health needs are being managed.
▲ 22.3% Above IN avg. ▲ 22.3% Above IN avg.IN average: 4.1Click the badge to see the full State ranking.Click here to see the full State ranking.

Staffing hours breakdown

Info Daily nursing hours per resident by staff type, reported to CMS. Higher is generally better — compare this facility to state and national averages to see where staffing stands.

Hours per resident per day — compared to Indiana state averages

Total nursing care / resident Info This home is ranked 39th out of 291 homes in Indiana for nurse hours. Total adjusted nursing hours per resident per day, combining RN, LPN, and aide time. CMS adjusts this for case-mix so facilities can be fairly compared.
4h 10m per day
Rank #39 / 291Nurse hours — State benchmarkedThis home is ranked 39th out of 291 homes in Indiana. Shows adjusted nurse hours per resident per day benchmarked to the Indiana average, with a ranking across 291 Indiana facilities. More hours mean more direct care. The national average is about 3.5 hrs; below 3.0 is a red flag.Rankings are based only on facilities in Indiana that report data for that category. Facilities without available data are excluded from the ranking.Click the rank badge to see the full State ranking.Click here to see the full State ranking.
This facility Indiana avg (3h 26m per day)
vs Indiana avg
+21%

4 of 6 metrics below state avg

Standout metric Nurse Aide is +33% above state avg
Staff typeHours / Day / Residentvs state avg
Registered Nurse (RN) Info RNs hold the highest nursing license and can assess residents, interpret test results, and direct care plans. More RN hours per day often signals stronger clinical oversight and faster response to health changes. 27m per day ▼ 33% State avg: 40m per day · National avg: 41m per day
LPN / LVN Info Licensed Practical Nurses (LPNs) or Licensed Vocational Nurses (LVNs) deliver routine hands-on care — medication administration, wound dressing, and monitoring vital signs. They work under RN supervision and make up a large share of daily bedside care. 44m per day ▼ 4% State avg: 46m per day · National avg: 52m per day
Nurse Aide Info Certified Nurse Aides (CNAs) provide the most direct day-to-day assistance: bathing, dressing, feeding, and mobility. Nurse aide hours are typically the largest staffing category and directly affect residents' quality of life. 3h 1m per day ▲ 33% State avg: 2h 16m per day · National avg: 2h 20m per day
Weekend Total Nursing Info Combined nursing hours (RN + LPN + Nurse Aide) per resident per day on weekends. Staffing often drops on weekends — this figure reveals whether the facility maintains adequate coverage outside of weekday hours. 3h 47m per day ▲ 17% State avg: 3h 14m per day · National avg: 3h 26m per day
Physical Therapist Info Hours per resident per day provided by licensed Physical Therapists (PTs) or PT Assistants. PT services help residents recover mobility after injury or illness and are especially important for post-acute (short-stay) rehabilitation. 2m per day ▼ 40% State avg: 4m per day · National avg: 4m per day
Weekend RN Info Registered nurse hours specifically on weekends. Facilities sometimes reduce RN presence on Saturdays and Sundays — a low weekend RN figure compared to weekday hours can indicate reduced clinical oversight when most administrative staff are absent. 24m per day ▼ 9% State avg: 27m per day · National avg: 28m per day

Capacity and availability

Avg. Length of Stay
117 days
Bed community size
207-bed community Rank #27 / 437Bed count — State benchmarkedThis home is ranked 27th out of 437 homes in Indiana. Shows this facility's certified or reported bed count compared to other Indiana facilities. Larger communities may offer more amenities, programs, and on-site services for residents and families.Rankings are based only on facilities in Indiana that report data for that category. Facilities without available data are excluded from the ranking.Click the rank badge to see the full State ranking.Click here to see the full State ranking.
A large-scale community that may provide a wide range of amenities, services, and structured programs.
Years in operation
45 years in operation Rank #14 / 378Years in operation — State benchmarkedThis home is ranked 14th out of 378 homes in Indiana. Shows how long this facility has been in operation compared to other Indiana facilities. Longer operating histories may benefit residents, families, and staff.Rankings are based only on facilities in Indiana that report data for that category. Facilities without available data are excluded from the ranking.Click the rank badge to see the full State ranking.Click here to see the full State ranking.
A longer operating history, which may indicate experience navigating regulations and delivering ongoing care.
Walk Score
Walk Score: 50 / 100 Rank #205 / 587Walk Score — State benchmarkedThis home is ranked 205th out of 587 homes in Indiana. Shows how walkable this facility's neighborhood is compared to the average Walk Score across Indiana facilities. Higher scores benefit residents, families, and staff.Rankings are based only on facilities in Indiana that report data for that category. Facilities without available data are excluded from the ranking.Click the rank badge to see the full State ranking.Click here to see the full State ranking.
Moderately walkable. Some errands can be accomplished on foot, with a mix of nearby amenities.
BBB Rating
BBB Rating: A+ (Not Accredited)
An independent rating from the Better Business Bureau based on factors such as complaint history, transparency, and business practices.
How BBB ratings work

About this community

License Details

Facility TypeNursing Home / Skilled Nursing Facility / Nursing Facility Dually Certified
StatusActive
IssuanceNovember 1, 2024
ExpirationOctober 31, 2026
License Number24-000010-1
CMS Certification Number155026

Ownership & Operating Entity

Greenwood Village South is legally operated by Johnson Memorial Hospital, and administered by Pamela Seegers.

Profit StatusNonprofit

Type Of Units

SNF/NF (Combined)
137 units
Residential
70 units
Total beds
207 units

Staffing

Key information about the people who lead and staff this community.

Leadership

Director of NursingAlexa Ulrey
ContactJordan Harlow

Therapy & Rehabilitation

3 services
Rehabilitation Services
Respite Care
Short-Term Rehab

Additional Services

1 service
Skilled Nursing Care

Contact Information

Fax(317) 859-4423

Amenities & Lifestyle

Specific ProgramsHealth & Wellness

Contact Greenwood Village South

Inspection History

In Indiana, the Department of Health, Division of Long Term Care is the primary regulatory body that performs onsite inspections and quality of care reviews for all licensed facilities.

Since 2022 · 4 years of data 38 deficiencies 2 complaints 21 inspections
Inspection Score Info A composite 0–100 score combining this facility's inspections, deficiencies, complaints, and enforcement actions relative to the Indiana state average. The score below shows how many points this facility sits above or below the typical Indiana nursing home score (the benchmark); higher is better.

At the Indiana average for nursing homes (83/100)

Rank #151 / 384 in Indiana Inspection Score — State benchmarked This home is ranked 151st out of 384 homes in Indiana. Shows this facility's inspection score compared to the Indiana average among 384 comparable communities in the ranking pool. Rankings are based only on facilities in Indiana that report data for that category. Facilities without available data are excluded from the ranking. Inspection score: 83 out of 100. Letter grade B. At the Indiana average for nursing homes (83/100)

Inspection Scorecard Info This scorecard compares key inspection, deficiency, and complaint metrics at this facility against the Indiana state average. Metrics rated ≥15% worse than average are highlighted in red; those ≥15% better are highlighted in green.

Since 2022 vs. Indiana state average
Overall vs. IN average 4 Worse Metrics worse than Indiana average:
• Total deficiencies (6% above)
• Deficiencies per year (6% above)
• Total visits (11% above)
• Complaint visits (38% above)
1 At Avg Metrics at Indiana average:
• Inspections with deficiencies (at IN avg)
5 Better Metrics better than Indiana average:
• Deficiencies per inspection (5% below)
• Inspection deficiency rate (11% below)
• Inspections (15% below)
• Total complaints (60% below)
• Complaints per year (62% below)
Latest Inspection July 29, 2025 Annual Inspection

Deficiencies Info Deficiencies are formal regulatory issues recorded during state inspections.

This FacilityIN Averagevs. IN Avg
Total deficiencies Info Formal regulatory issues recorded by inspectors across all inspection types. 3836 This facility has 6% more total deficiencies than a typical Indiana nursing home (38 vs. IN avg 36).↑ 6% worse Rank #192 / 386 Total deficiencies — State benchmarked This home is ranked 192nd out of 386 homes in Indiana. Shows this facility's deficiencies compared to the Indiana average among 386 comparable communities in the ranking pool. Rankings are based only on facilities in Indiana that report data for that category. Facilities without available data are excluded from the ranking.
Deficiencies per year Info Average deficiencies per year since 2022. 9.59 This facility has 6% more deficiencies per year than a typical Indiana nursing home (9.5 vs. IN avg 9).↑ 6% worse
Deficiencies per inspection Info Average deficiencies per inspection. 1.81.9 This facility has 5% fewer deficiencies per inspection than a typical Indiana nursing home (1.8 vs. IN avg 1.9).↓ 5% better Rank #121 / 386 Deficiencies per inspection — State benchmarked This home is ranked 121st out of 386 homes in Indiana. Shows this facility's deficiencies per inspection compared to the Indiana average among 386 comparable communities in the ranking pool. Rankings are based only on facilities in Indiana that report data for that category. Facilities without available data are excluded from the ranking.

Inspections Info State inspections evaluate whether the facility meets health and safety standards.

This FacilityIN Averagevs. IN Avg
Total visits Info Combined count of all on-site visits — routine inspections, complaint visits, follow-ups, and other focused visits. 2119 This facility has 11% more total visits than a typical Indiana nursing home (21 vs. IN avg 19).↑ 11% worse
Inspections with deficiencies Info Inspections that resulted in at least one regulatory deficiency. 77 This facility has inspections with deficiencies in line with the Indiana average (7 vs. IN avg 7).— At avg
Inspection deficiency rate Info Percentage of inspections that resulted in at least one deficiency. 33%37% This facility has 4 percentage points lower inspection deficiency rate than a typical Indiana nursing home (33% vs. IN avg 37%).↓ 4% better
Inspections Info Routine, scheduled inspections conducted by state regulators. 1113 This facility has 15% fewer inspections than a typical Indiana nursing home (11 vs. IN avg 13).↓ 15% better

Complaints & Investigations Info Complaints are formal concerns filed by residents, families, or staff. Investigations are on-site follow-ups.

This FacilityIN Averagevs. IN Avg
Total complaints Info Formal expressions of concern made by residents, families, or staff. 25 This facility has 60% fewer total complaints than a typical Indiana nursing home (2 vs. IN avg 5).↓ 60% better Rank #50 / 352 Total complaints — State benchmarked This home is ranked 50th out of 352 homes in Indiana. Shows this facility's total complaints compared to the Indiana average among 352 comparable communities in the ranking pool. Rankings are based only on facilities in Indiana that report data for that category. Facilities without available data are excluded from the ranking.
Complaints per year Info Average complaints per year since 2022. 0.51.3 This facility has 62% fewer complaints per year than a typical Indiana nursing home (0.5 vs. IN avg 1.3).↓ 62% better
Complaint visits Info On-site visits triggered by formal complaints. Formal complaints can result in multiple visits. 118 This facility has 38% more complaint visits than a typical Indiana nursing home (11 vs. IN avg 8).↑ 38% worse

Inspection Reports Summary Info An editor-reviewed summary of the themes and findings across this facility's recent inspection reports.

  • The March 21, 2025 complaint investigation substantiated neglect for a cognitively impaired resident who eloped due to wanderguard failure and an outdated service plan.
  • The August 20, 2024 Life Safety Code survey found four deficiencies including fire door malfunction, blocked electrical panel access, missing extinguisher signage, and improper power strip use.
  • The August 13, 2024 recertification cited four deficiencies including missing bathroom call light pull cords, incomplete employee reference checks, uncovered kitchen staff hair, and undocumented medication disposition.

Health Inspection History

Inspections since 2023
Total health inspections 2

Indiana average 6


Last Health inspection on Aug 2024

Total health citations
6 Rank #17 / 292Health citations — State benchmarkedThis home is ranked 17th out of 292 homes in Indiana. Shows this facility's total health deficiency citations benchmarked to the Indiana State average, with a ranking across all 292 IN facilities. Lower citation counts earn a better rank.Rankings are based only on facilities in Indiana that report data for that category. Facilities without available data are excluded from the ranking.Click the rank badge to see the full State ranking.Click here to see the full State ranking.

Indiana average 25

Citations per inspection
3 Rank #82 / 292Citations per inspection — State benchmarkedThis home is ranked 82nd out of 292 homes in Indiana. Shows average deficiency citations per CMS inspection for this facility versus the Indiana mean across 292 facilities with citation data. Lower is better.Rankings are based only on facilities in Indiana that report data for that category. Facilities without available data are excluded from the ranking.Click the rank badge to see the full State ranking.Click here to see the full State ranking.

Indiana average 4.12


Health citations are formal notices following inspections when they fail to comply with safety and care standards.

All 6 citations resulted from standard inspections.

Breakdown of citation severity (last 3 years)
Critical health citations
0
100% better than Indiana average

Indiana average: 0.2


Serious health citations
0
100% better than Indiana average

Indiana average: 0.6

0 critical citations Indiana average: 0.2

0 serious citations Indiana average: 0.6

5 moderate citations Indiana average: 23.8

1 minor citation Indiana average: 0.4
Citations history (last 3 years)
Resident Rights moderate citation Aug 13, 2024
Corrected

Nursing Services minor citation Aug 15, 2023
Corrected

Quality of Care moderate citation Aug 15, 2023
Corrected

Care Planning moderate citation Aug 15, 2023
Corrected

Staffing Data

Reporting period: October 1 – December 31, 2025 (Q4 2025). Source: CMS Payroll-Based Journal report.

Total staff 308
Employees 152
Contractors 156
Staff to resident ratio 2.55 : 1
2545355% more staff per resident than Indiana average
Indiana average ratio: 0.00 : 1 Indiana average ratio: 0.00 : 1See full Indiana ranking
Avg staff/day 84
Average shift 7.4 hours
0% compared with Indiana average
Indiana average: 7.7 hours Indiana average shift: 7.7 hoursSee full Indiana ranking
Total staff hours (quarter) 57,140

Nursing staff breakdown

Q4 2025 · Oct 1 – Dec 31 More info This data comes from the CMS Payroll-Based Journal report covering October 1 – December 31, 2025.
Registered Nurse

Manages medical care and health needs.

RN Staff Info 15 total: 14 full-time employees and 1 contractor. 15
Average shift length Info Average shift length. Calculated as total hours divided by days worked and average staff per day. 8.5 hours
Licensed Practical Nurse

Assists with medical care and medications.

LPN Staff Info 34 total: 18 full-time employees and 16 contractors. 34
Average shift length Info Average shift length. Calculated as total hours divided by days worked and average staff per day. 7.9 hours
Certified Nursing Assistant

Helps with daily care and mobility.

CNA Staff Info 155 total: 76 full-time employees and 79 contractors. 155
Average shift length Info Average shift length. Calculated as total hours divided by days worked and average staff per day. 7.4 hours

Contractor staffing

Q4 2025 · Oct 1 – Dec 31 More info This data comes from the CMS Payroll-Based Journal report covering October 1 – December 31, 2025.

Total hours from contractors

18.5%

10,556 contractor hours this quarter

Certified Nursing Assistant: 79 Medication Aide/Technician: 35 Licensed Practical Nurse: 16 Speech Language Pathologist: 7 Respiratory Therapy Technician: 4 Physical Therapy Aide: 4 Physical Therapy Assistant: 4 Qualified Social Worker: 2 Registered Nurse: 1 Occupational Therapy Assistant: 1 Feeding Assistant: 1 Medical Director: 1 Other Physician: 1

Staff by category

Q4 2025 · Oct 1 – Dec 31 More info This data comes from the CMS Payroll-Based Journal report covering October 1 – December 31, 2025.
Certified Nursing Assistant767915524,75392100%7.4
Medication Aide/Technician2035558,78692100%8.3
Licensed Practical Nurse1816345,50092100%7.9
Registered Nurse141154,12492100%8.5
RN Director of Nursing6062,6817784%8.1
Other Dietary Services Staff100102,40292100%6.7
Speech Language Pathologist0772,0048997%6
Physical Therapy Aide0441,6807683%6.7
Physical Therapy Assistant0448307480%6.3
Dental Services Staff2026656368%7.4
Qualified Social Worker0225637683%5.6
Dietitian1014506065%7.5
Administrator1014485661%8
Respiratory Therapy Technician0444437885%4.7
Nurse Practitioner1014205661%7.5
Clinical Nurse Specialist1014205661%7.5
Mental Health Service Worker1014205661%7.5
Occupational Therapy Aide1013415155%6.7
Feeding Assistant0111092830%3.9
Medical Director011492224%2.2
Occupational Therapy Assistant011471213%3.9
Other Physician011444%1
155 Certified Nursing Assistant
% of Days 100%
55 Medication Aide/Technician
% of Days 100%
34 Licensed Practical Nurse
% of Days 100%
15 Registered Nurse
% of Days 100%
6 RN Director of Nursing
% of Days 84%
10 Other Dietary Services Staff
% of Days 100%
7 Speech Language Pathologist
% of Days 97%
4 Physical Therapy Aide
% of Days 83%
4 Physical Therapy Assistant
% of Days 80%
2 Dental Services Staff
% of Days 68%
2 Qualified Social Worker
% of Days 83%
1 Dietitian
% of Days 65%
1 Administrator
% of Days 61%
4 Respiratory Therapy Technician
% of Days 85%
1 Nurse Practitioner
% of Days 61%
1 Clinical Nurse Specialist
% of Days 61%
1 Mental Health Service Worker
% of Days 61%
1 Occupational Therapy Aide
% of Days 55%
1 Feeding Assistant
% of Days 30%
1 Medical Director
% of Days 24%
1 Occupational Therapy Assistant
% of Days 13%
1 Other Physician
% of Days 4%

Penalties and fines

Federal penalties imposed by CMS for regulatory violations, including civil money penalties (fines) and denials of payment for new Medicare/Medicaid admissions.

Source: CMS Penalties Database

No penalties in the past 3 years

No civil money penalties or payment denials were reported in the last 3 years.

Quality of care over time

These measures show how residents usually do over time at this home, based on health outcomes and preventive care.

High-risk clinical events score Info A composite score based on pressure ulcers, falls with injury, weight loss, walking ability decline, and activities of daily living decline. 16.6
108% worse than Indiana average

Indiana average: 8.0

Functional decline score Info A composite score based on activities of daily living decline, walking ability decline, and incontinence. 29.6
74% worse than Indiana average

Indiana average: 17.1

Long-stay resident measures
Above average Indiana avg: 4.1 Info CMS star rating based on long-stay quality measure performance. 5 stars = significantly above average, 1 star = significantly below average.
Need for Help with Daily Activities Increased Info Percent of long-stay residents whose need for help with daily activities has increased 34.6%
187% worse than Indiana average

Indiana average: 12.0%

Walking Ability Worsened Info Percent of long-stay residents whose ability to move independently worsened 36.2%
152% worse than Indiana average

Indiana average: 14.4%

Low Risk Residents with Bowel/Bladder Incontinence Info Percent of low risk long-stay residents who lose control of their bowels or bladder 18.1%
26% better than Indiana average

Indiana average: 24.6%

Falls with Major Injury Info Percent of long-stay residents experiencing one or more falls with major injury 1.5%
62% better than Indiana average

Indiana average: 3.9%

High Risk Residents with Pressure Ulcers Info Percent of long-stay high risk residents with pressure ulcers 0.4%
90% better than Indiana average

Indiana average: 4.4%

Urinary Tract Infection Info Percent of long-stay residents with a urinary tract infection 1.5%
23% worse than Indiana average

Indiana average: 1.2%

Lost Too Much Weight Info Percent of long-stay residents who lose too much weight 10.5%
85% worse than Indiana average

Indiana average: 5.7%

Depressive Symptoms Info Percent of long-stay residents who have depressive symptoms 3.3%
86% better than Indiana average

Indiana average: 24.1%

Antipsychotic Use Info Percent of long-stay residents who received an antipsychotic medication 16.7%
34% worse than Indiana average

Indiana average: 12.4%

Pneumococcal Vaccine Info Percent of long-stay residents assessed and appropriately given the pneumococcal vaccine 97.8%
In line with Indiana average

Indiana average: 93.7%

Influenza Vaccine Info Percent of long-stay residents assessed and appropriately given the seasonal influenza vaccine 94.5%
In line with Indiana average

Indiana average: 95.4%

Hospitalizations per 1,000 days Info Number of hospitalizations per 1,000 long-stay resident days. 0.91
43% better than Indiana average

Indiana average: 1.60

ED visits per 1,000 days Info Number of outpatient emergency department visits per 1,000 long-stay resident days. 0.70
53% better than Indiana average

Indiana average: 1.48

Short-stay resident measures
Significantly above average Indiana avg: 2.9 Info CMS star rating based on short-stay quality measure performance. 5 stars = much above average, 1 star = much below average.
Pneumococcal Vaccine Info Percent of short-stay residents assessed and appropriately given the pneumococcal vaccine 98.8%
21% better than Indiana average

Indiana average: 81.7%

Antipsychotic medication increase Info Percent of short-stay residents who newly received an antipsychotic medication 0.6%
58% better than Indiana average

Indiana average: 1.4%

Influenza Vaccine Info Percent of short-stay residents assessed and appropriately given the seasonal influenza vaccine 92.4%
17% better than Indiana average

Indiana average: 79.0%

Re-hospitalized after SNF stay Info Percentage of short-stay residents who were re-hospitalized after their nursing home admission. 21.7%
In line with Indiana average

Indiana average: 22.4%

Emergency department visits Info Percentage of short-stay residents who had an outpatient emergency department visit. 10.0%
5% better than Indiana average

Indiana average: 10.5%

Falls with major injury Info Percentage of SNF residents who experience falls with major injury during their stay. 0.7%
In line with Indiana average

Indiana average: 0.8%

Ability to care for self at discharge Info Percentage of residents at or above expected ability to care for themselves at discharge. 64.1%
19% better than Indiana average

Indiana average: 53.7%

Successful return to home or community Info Rate of successful return to home or community from a skilled nursing facility. 64.3%
27% better than Indiana average

Indiana average: 50.6%

Breakdown by payment type

Medicare

54% of new residents, usually for short-term rehab.

Typical stay 1 - 2 months

Private pay

41% of new residents, often for short stays.

Typical stay 6 - 7 months

Medicaid

5% of new residents, often for long-term daily care.

Typical stay 3 years

Facility Characteristics

Source: CMS Long-Term Care Facility Characteristics (Data as of Jan 2026)

Total residents 121
Medicare
13
10.7% of residents
Medicaid
62
51.2% of residents
Private pay or other
46
38% of residents
Programs & Services
Residents Group

Residents meet regularly to discuss policies, care quality, and activities

Nurse Aide Training

State-approved Nurse Aide Training and Competency Evaluation Program on-site

CCRC

Part of a Continuing Care Retirement Community offering multiple care levels

Active Resident Council

Organized group of residents that meets regularly to discuss facility policies, quality of life, and activities.

Finances and operations

Based on CMS SNF Cost Report for fiscal year ending in 12/2023.
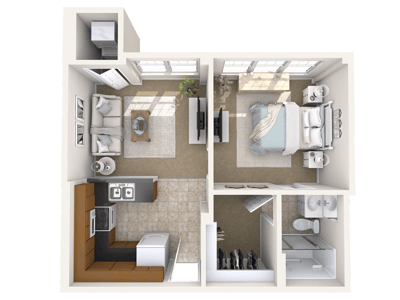
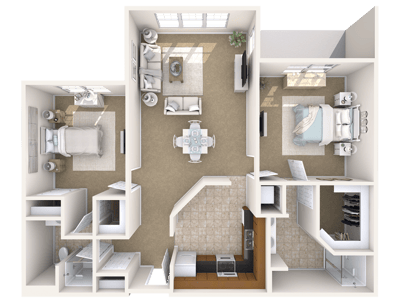
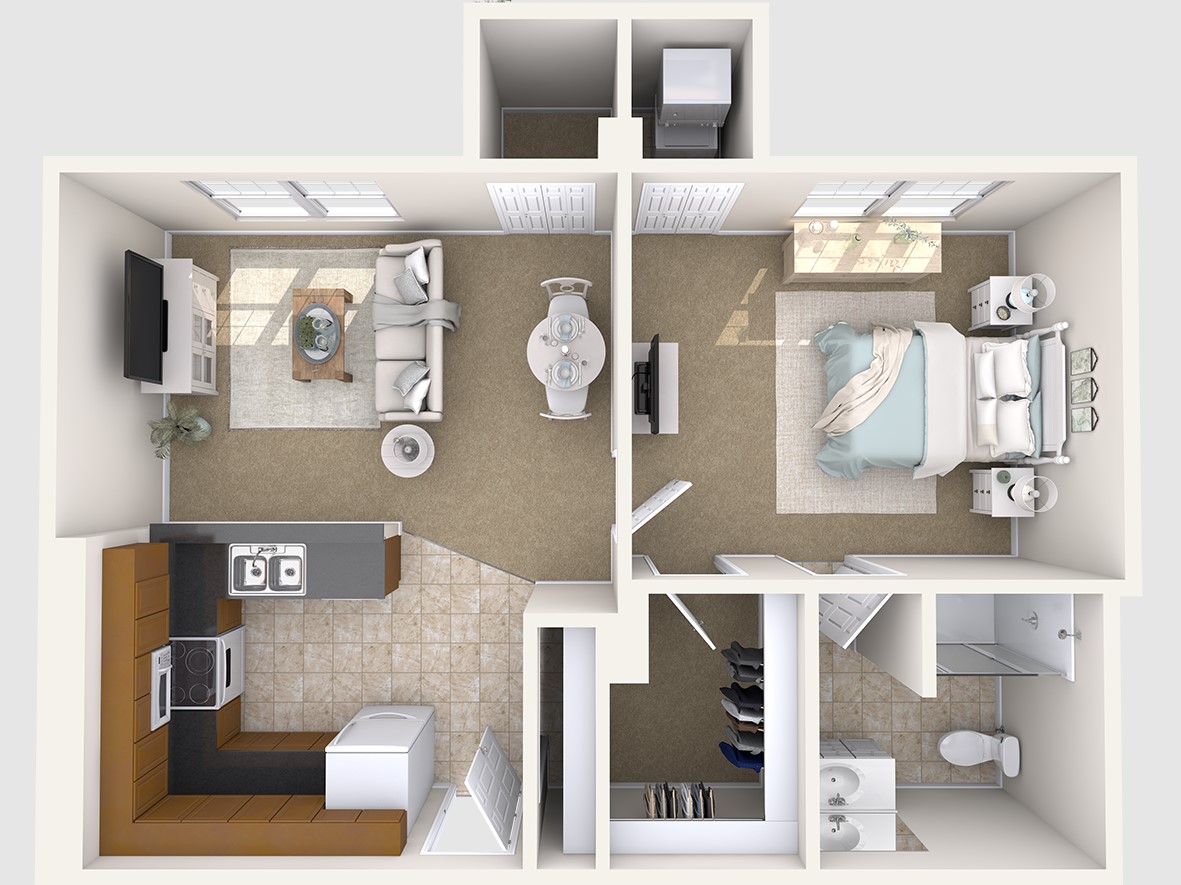
Nonprofit
Other Nonprofit
Net patient revenue Info Net patient revenue — what the home actually collects for resident care, after contractual allowances, bad debt and discounts are subtracted from its gross charges (CMS cost report, Worksheet G-3). It covers resident care only; money the home earns from other sources is shown separately as "Other income."
$28.2M
Net patient income Info Net patient income: net patient revenue minus the home's total operating expenses. A positive figure means it earns more from resident care than it spends to deliver it; a negative figure means the opposite. It excludes non-operating "other income."
-$5.7M
Nonprofit Other Nonprofit
Net patient revenue Info Net patient revenue — what the home actually collects for resident care, after contractual allowances, bad debt and discounts are subtracted from its gross charges (CMS cost report, Worksheet G-3). It covers resident care only; money the home earns from other sources is shown separately as "Other income."
$28.2M Rank #3 / 294Revenue — State benchmarkedThis home is ranked 3rd out of 294 homes in Indiana. Shows this facility's annual revenue compared to the Indiana average. Higher revenue generally means more resources for staffing and capital — read alongside Payroll %.Rankings are based only on facilities in Indiana that report data for that category. Facilities without available data are excluded from the ranking.Click the rank badge to see the full State ranking.Click here to see the full State ranking.
Net patient income Info Net patient income: net patient revenue minus the home's total operating expenses. A positive figure means it earns more from resident care than it spends to deliver it; a negative figure means the opposite. It excludes non-operating "other income."
-$5.7M
Other income Info Money the home earns outside of resident care — such as investments, grants, rentals and other non-operating sources (CMS cost report, Worksheet G-3). It is tracked separately from net patient revenue: it is not part of that figure, and it is not included in net patient income.
$4.9M
Payroll costs Info Staff salaries plus wage-related costs — benefits such as payroll taxes, health insurance and retirement — from the home's own accounting records (CMS cost report, Worksheet A). Contract or agency labor is counted separately, under other operating costs. Rank #3 / 294Payroll — State benchmarkedThis home is ranked 3rd out of 294 homes in Indiana. Shows total annual staff payroll benchmarked to the Indiana average. Higher payroll investment relative to peers often signals better staffing and less reliance on cheaper contract labor.Rankings are based only on facilities in Indiana that report data for that category. Facilities without available data are excluded from the ranking.Click the rank badge to see the full State ranking.Click here to see the full State ranking.
$15.6M 55.4% of net patient revenue Info Payroll as a share of revenue: staff salaries and wage-related benefits divided by net patient revenue. A higher figure means more of each revenue dollar goes to staff pay. Rank #150 / 294Payroll % — State benchmarkedThis home is ranked 150th out of 294 homes in Indiana. Shows payroll as a percentage of revenue versus the Indiana average. Well-run Indiana facilities typically land around 54–68% — the top third Statewide. Below 25% may signal understaffing or heavy agency use — read with Staffing ratings.Rankings are based only on facilities in Indiana that report data for that category. Facilities without available data are excluded from the ranking.Click the rank badge to see the full State ranking.Click here to see the full State ranking.
Other operating costs Info Everything it costs to run the home apart from payroll — food, utilities, supplies, maintenance, contract labor and administration. Calculated as total operating expense minus payroll (staff salaries and wage-related benefits).
$18.3M
Total costs Info The home's total operating expense for the year — all the costs of running it, salaries included (CMS cost report, Worksheet G-3).
$33.9M

What does this home offer?

Pets allowed icon
Pets allowed icon

Pets Allowed

Housing options icon

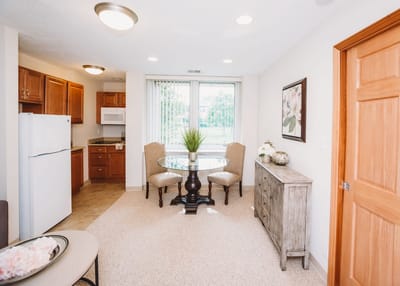
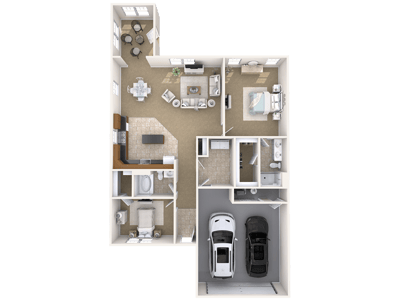
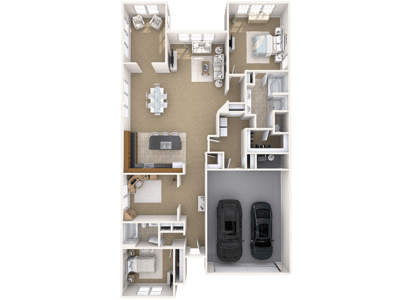
Housing Options: Apartment / Cottage

Building type icon
Building type icon

Building Type: Two-story

Fitness and recreation icon

Fitness and Recreation

Dining services icon

Three Meals Per Day

Transportation services icon

Transportation Services

Who this home usually serves

TYPE OF STAY

Mostly short-term rehab stays

Most residents typically stay for a few weeks or months before returning home or moving on.

Most new residents arrive under Medicare (54% of admissions), and a typical Medicare stay runs around 1 - 2 months.

Admissions
266 total

Coverage residents most often arrive under.

Medicare 54%
Private pay 41%
Medicaid 5%
Discharges
373 total

Coverage residents most often leave under.

Medicare 36%
Private pay 47%
Medicaid 17%

Managed by Paul Pfaff

Administrator

Living Spaces & Floor Plans for Greenwood Village South

Places of interest near Greenwood Village South

Address 1.1 miles from city center Info Estimated distance in miles from Greenwood's city center to Greenwood Village South's address, calculated via Google Maps.

Calculate Travel Distance to Greenwood Village South

Add your location

Address

Compare Nursing Homes around Greenwood

The information below is reported by the Indiana Department of Health, Division of Long Term Care.

4 facilities compared · CMS & IN Dept. of Health data

Greenwood Village South
NH
AL
IL
MC
Greenwood
207
Facility 207
IN AVG 116
Rank #27 / 437
--
4.16
Facility 4.16
IN AVG 3.44
Rank #39 / 291
-50%+21%
$0
Facility $0
IN AVG $31.4k
Rank #1 / 293
83
Facility 83
IN AVG 83
Rank #151 / 384
6
Facility 6
IN AVG 25.0
Rank #17 / 292
3.0
Facility 3.0
IN AVG 4.1
Rank #82 / 292
-38A+
50
Facility 50
IN AVG 37
Rank #205 / 587
Pamela Seegers
$28.2M
Facility $28.2M
IN AVG $10.7M
Rank #3 / 294
$15.6M
Facility $15.6M
IN AVG $4.2M
Rank #3 / 294
55.4%
Facility 55.4%
IN AVG 42%
Rank #150 / 294
155026
Greenwood Meadows
NH
AL
Greenwood
169
Facility 169
IN AVG 116
Rank #56 / 437
86.4%
Facility 86.4%
IN AVG 69.4%
Rank #52 / 434
+24%
2.81
Facility 2.81
IN AVG 3.44
Rank #245 / 291
+25%-18%
$0
Facility $0
IN AVG $31.4k
Rank #1 / 293
81
Facility 81
IN AVG 83
Rank #174 / 384
12
Facility 12
IN AVG 25.0
Rank #51 / 292
3.0
Facility 3.0
IN AVG 4.1
Rank #82 / 292
-145-
0
Facility 0
IN AVG 37
Rank #562 / 587
Ashley Maire
$18.3M
Facility $18.3M
IN AVG $10.7M
Rank #22 / 294
$9.7M
Facility $9.7M
IN AVG $4.2M
Rank #21 / 294
52.7%
Facility 52.7%
IN AVG 42%
Rank #180 / 294
155788
Greenwood Healthcare Center
NH
MC
Greenwood
185
Facility 185
IN AVG 116
Rank #42 / 437
87.6%
Facility 87.6%
IN AVG 69.4%
Rank #45 / 434
+26%
2.86
Facility 2.86
IN AVG 3.44
Rank #232 / 291
-10%-17%
$12.7k
Facility $12.7k
IN AVG $31.4k
Rank #255 / 293
-
15
Facility 15
IN AVG 25.0
Rank #77 / 292
2.5
Facility 2.5
IN AVG 4.1
Rank #52 / 292
1163-
23
Facility 23
IN AVG 37
Rank #375 / 587
Westridge Mgt Co LLC
$26.8M
Facility $26.8M
IN AVG $10.7M
Rank #1 / 294
$11.3M
Facility $11.3M
IN AVG $4.2M
Rank #11 / 294
42.1%
Facility 42.1%
IN AVG 42%
Rank #292 / 294
155193
Greenwood Health & Living Community
NH
HC
RC
Greenwood
111
Facility 111
IN AVG 116
Rank #204 / 437
76.1%
Facility 76.1%
IN AVG 69.4%
Rank #133 / 434
+10%
2.89
Facility 2.89
IN AVG 3.44
Rank #232 / 291
-55%-16%
$0
Facility $0
IN AVG $31.4k
Rank #1 / 293
-
13
Facility 13
IN AVG 25.0
Rank #60 / 292
2.6
Facility 2.6
IN AVG 4.1
Rank #59 / 292
-98-
32
Facility 32
IN AVG 37
Rank #319 / 587
David Hyatt
$12.9M
Facility $12.9M
IN AVG $10.7M
Rank #48 / 294
$5.3M
Facility $5.3M
IN AVG $4.2M
Rank #116 / 294
41.1%
Facility 41.1%
IN AVG 42%
Rank #273 / 294
155412

Financial Assistance for
Nursing Home in Indiana

Greenwood Village South is located in Greenwood, Indiana.
Here are the financial assistance programs available to residents in Indiana.

Get Financial aid guidance

Aged and Disabled Waiver

Indiana Medicaid A&D Waiver

Age 65+ or disabled
General Indiana resident, Medicaid-eligible, nursing home-level care need.
Income Limits (2025) ~$2,829/month 300% FBR, individual
Asset Limits $2,000 (individual), $3,000 (couple).
IN

Requires level-of-care determination.

Benefits
Personal care (5-7 hours/day) Respite (240 hours/year) Adult day care (~$60/day) Home health services

CHOICE Program

Indiana CHOICE

Age 60+
General Indiana resident, at risk of nursing home.
Income Limits ~$2,000/month varies
Asset Limits $10,000 individual
IN

Limited funding; regional variation.

Benefits
In-home care (3-5 hours/week) Respite (up to 10 days/year) Transportation (~5 trips/month)

Residential Care Assistance Program (RCAP)

Indiana Residential Care Assistance Program

Age 65+
General or blind, or disabled, Indiana resident, in approved facility, low-income or SSI recipient.
Income Limits (2025) ~$1,004/month including SSI
Asset Limits $2,000 (individual), $3,000 (couple).
IN

~50 facilities statewide; per diem rate set by FSSA.

Benefits
Room/board Laundry Minimal care coordination (~$20-$50/day subsidy)

Medicare Savings Program (MSP)

Indiana Medicare Savings Program

Age 65+ or disabled
General Indiana resident, Medicare Part A/B.
Income Limits (2025) ~$2,510/month (QMB), ~$3,380/month (SLMB), ~$3,598/month (QI)—individual.
Asset Limits $9,430 (individual), $14,130 (couple).
IN

Three tiers; no waitlist.

Benefits
Covers Part B premiums ($174.70/month) Deductibles ($240/year) Copays (~20%)

National Family Caregiver Support Program (NFCSP) Respite

Indiana NFCSP Respite Care

Age
General Caregivers of 60+ needing care or 55+ caregivers of others; Indiana resident; functional needs (2+ ADLs).
Income Limits (2025) Prioritizes ~$24,980/year (individual); no strict cap.
Asset Limits Not assessed; need-based.
IN

16 AAAs; prioritizes low-income, rural caregivers.

Benefits
Respite (4-6 hours/week or 5 days/year) Adult day care ($60/day) Caregiver training

VA Aid and Attendance (A&A) and Housebound Benefits

Indiana VA Aid and Attendance/Housebound

Age 65+ or disabled veteran/spouse
General Indiana resident, wartime service, need for ADL help (A&A) or homebound.
Income Limits (2025) Net income < ~$1,984/month (veteran with dependent, A&A); pension offsets income.
Asset Limits ~$155,356 net worth limit
IN

High veteran demand statewide.

Benefits
Cash (~$1,433-$2,642/month veteran, ~$951-$1,318 spouse) for care costs (e.g., in-home, assisted living)

Frequently Asked Questions about Greenwood Village South

Who is the Director of Nursing at Greenwood Village South?

Alexa Ulrey is the Director of Nursing at Greenwood Village South.

Who is the owner of Greenwood Village South?

Greenwood Village South is legally operated by Johnson Memorial Hospital, and administered by Pamela Seegers.

Is Greenwood Village South in a walkable area?

Greenwood Village South has a walk score of 50. Moderately walkable. Some errands can be accomplished on foot, with a mix of nearby amenities.

What is the license number of Greenwood Village South?

According to IN state health department records, Greenwood Village South's license number is 24-000010-1.

When does Greenwood Village South's license expire?

According to IN state health department records, Greenwood Village South's license expires on October 31, 2026.

What is the occupancy rate at Greenwood Village South?

Greenwood Village South's occupancy is 75.8%.

Does Greenwood Village South operate as a for-profit or non-profit?

Greenwood Village South is registered as a non-profit in IN.

Guides for Better Senior Living

Care Cost Calculator: See Prices in Your Area

Nursing Home Data Explorer

Don’t Wait Too Long: 7 Red Flag Signs Your Parent Needs Assisted Living Now

The True Cost of Assisted Living in 2025 – And How Families Are Paying For It

Understanding Senior Living Costs: Pricing Models, Discounts & Financial Assistance