


Total staff
186
Employees
140
Contractors
46
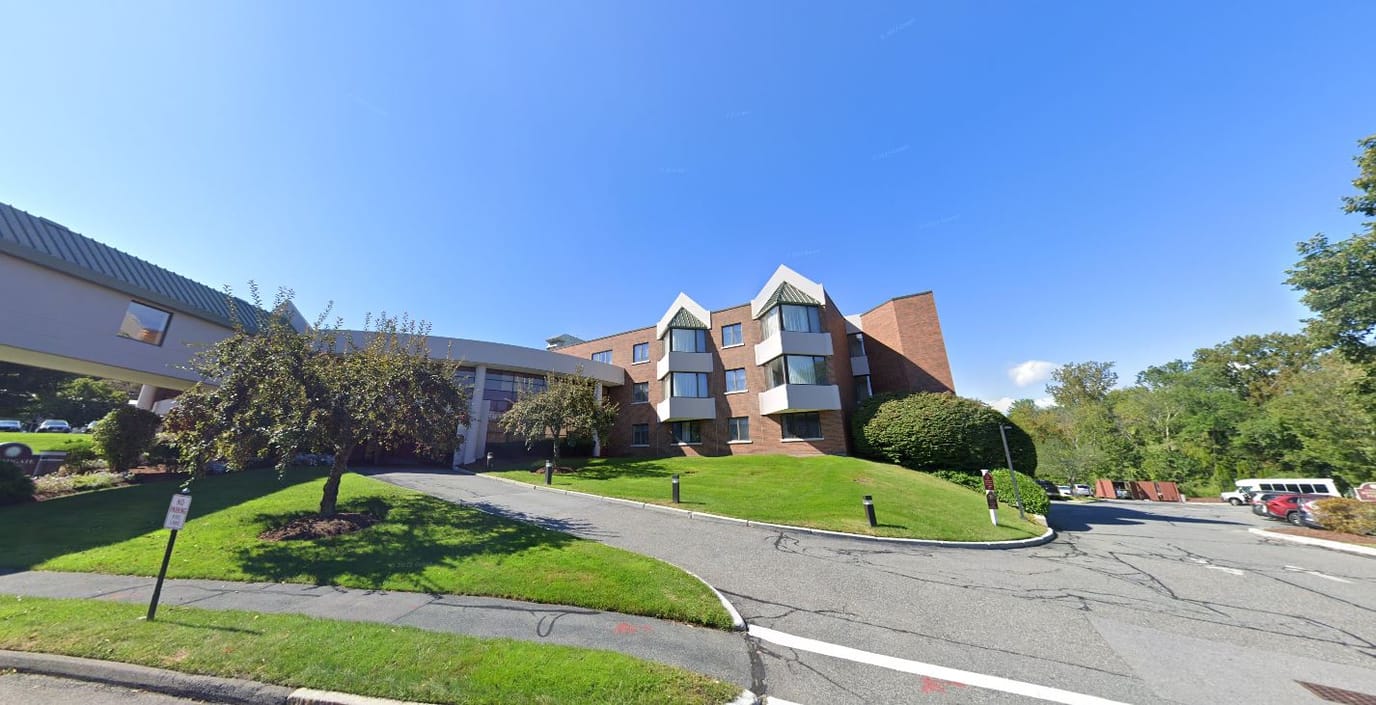


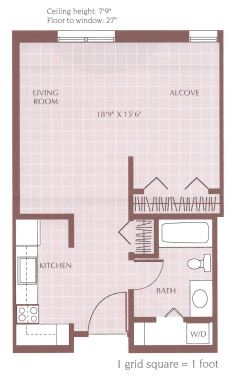
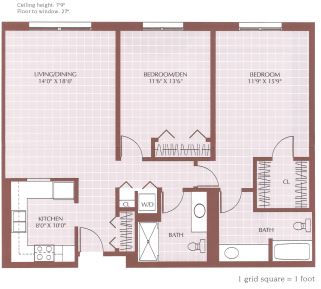
Hampton Suites at Shrewsbury operates a multi-level facility in Shrewsbury, Massachusetts, with 99 beds across nursing home, assisted living, and independent living care. Owned by Shrewsbury Operations Holdings LLC, the community accepts Medicare, Medicaid, and private-pay residents in studio, one-, and two-bedroom units that welcome pets.
The current resident census of 90 is 82.2% private-pay, reflecting an affluent population; admissions lean toward private-pay short-term stays (62%, average 2–3 months) and shorter Medicare stays (12%, average 3–4 months), with a small Medicaid long-term segment (26%, average 1–2 years).
Regulatory compliance is strong: health inspections 40.5% above state average, zero penalties or payment denials in three years, and quality measure ratings 25.8% above state.
Yet staffing levels present a stark concern. At 3 hours 43 minutes per resident per day, nursing hours run 66.7% below the Massachusetts average and sit just above the national red-flag threshold of 3.0 hours. Two-thirds of RNs (17 of 26) and nearly half of LPNs (27 of 55) are contractors, signaling turnover and care continuity issues despite adequate head counts.
Resident outcomes paint a divided picture: falls with major injury are exceptional (0.4% versus 3.6% state), vaccine rates are near-universal, and infection control is strong. But depressive symptoms affect 16.1% of long-stay residents (50% worse than state), weight loss rates are 40% worse than average, and functional decline metrics are measurably poor. The facility operates at a financial loss of $769,700 (2023), a -6.7% margin, despite recovering occupancy from pandemic lows to 81.4%.
Hampton Suites at Shrewsbury fits private-pay long-term residents seeking a Massachusetts nursing home with strong compliance records and regulatory oversight.
The staffing model and persistent operating losses suggest operational constraints that families should explore directly with the facility’s administration.
| Staff type | Hours / Day / Resident | vs state avg |
|---|---|---|
|
Registered Nurse (RN)
| 36m per day | ▼ 9% State avg: 39m per day · National avg: 41m per day |
|
LPN / LVN
| 1h 15m per day | ▲ 30% State avg: 57m per day · National avg: 52m per day |
|
Nurse Aide
| 2h 23m per day | ▲ 5% State avg: 2h 16m per day · National avg: 2h 20m per day |
|
Weekend Total Nursing
| 3h 54m per day | ▲ 12% State avg: 3h 29m per day · National avg: 3h 27m per day |
|
Physical Therapist
| 3m per day | ▼ 35% State avg: 5m per day · National avg: 4m per day |
|
Weekend RN
| 31m per day | ▲ 13% State avg: 27m per day · National avg: 29m per day |
Reporting period: October 1 – December 31, 2025 (Q4 2025). Source: CMS Payroll-Based Journal report.
Manages medical care and health needs.
Assists with medical care and medications.
Helps with daily care and mobility.
Total hours from contractors
2,873 contractor hours this quarter
| Certified Nursing Assistant | 65 | 0 | 65 | 19,854 | 92 | 100% | 7.6 |
| Licensed Practical Nurse | 28 | 27 | 55 | 7,702 | 92 | 100% | 8.4 |
| Registered Nurse | 9 | 17 | 26 | 3,298 | 92 | 100% | 7.9 |
| RN Director of Nursing | 7 | 0 | 7 | 2,689 | 80 | 87% | 7.8 |
| Other Dietary Services Staff | 11 | 0 | 11 | 1,917 | 92 | 100% | 7.3 |
| Clinical Nurse Specialist | 3 | 0 | 3 | 1,146 | 85 | 92% | 7.1 |
| Dental Services Staff | 2 | 0 | 2 | 497 | 64 | 70% | 5.6 |
| Nurse Practitioner | 1 | 0 | 1 | 488 | 61 | 66% | 8 |
| Qualified Social Worker | 3 | 0 | 3 | 475 | 77 | 84% | 5.7 |
| Administrator | 1 | 0 | 1 | 457 | 62 | 67% | 7.4 |
| Respiratory Therapy Technician | 3 | 0 | 3 | 413 | 64 | 70% | 5.2 |
| Speech Language Pathologist | 1 | 0 | 1 | 409 | 63 | 68% | 6.5 |
| Occupational Therapy Aide | 1 | 0 | 1 | 334 | 44 | 48% | 7.6 |
| Dietitian | 2 | 0 | 2 | 330 | 44 | 48% | 7.5 |
| Physical Therapy Assistant | 2 | 0 | 2 | 195 | 34 | 37% | 5.6 |
| Mental Health Service Worker | 1 | 0 | 1 | 150 | 20 | 22% | 7.5 |
| Occupational Therapy Assistant | 0 | 1 | 1 | 34 | 8 | 9% | 4.3 |
| Medical Director | 0 | 1 | 1 | 6 | 6 | 7% | 1 |
Includes penalties issued in 2023
Federal penalties imposed by CMS for regulatory violations, including civil money penalties (fines) and denials of payment for new Medicare/Medicaid admissions.
Source: CMS Penalties Database (Data as of Jan 2026)
Massachusetts average: $72K
Massachusetts average: 1.7
Massachusetts average: 0.1
Penalties are imposed by CMS for violations of federal nursing home regulations.
1 penalty in the past 3 years
Sep 19, 2023 · $8K
Last updated: Jan 2026
These measures show how residents usually do over time at this home, based on health outcomes and preventive care.
Massachusetts average: 10.2
Massachusetts average: 20.0
Massachusetts average: 18.7%
Massachusetts average: 19.3%
Massachusetts average: 22.1%
Massachusetts average: 3.6%
Massachusetts average: 4.7%
Massachusetts average: 2.1%
Massachusetts average: 5.2%
Massachusetts average: 10.7%
Massachusetts average: 20.3%
Massachusetts average: 91.9%
Massachusetts average: 94.8%
Massachusetts average: 76.7%
Massachusetts average: 1.3%
Massachusetts average: 77.7%
Quality measures are calculated from Minimum Data Set (MDS) assessments. For most measures, lower percentages indicate better care quality.
12% of new residents, usually for short-term rehab.
62% of new residents, often for short stays.
26% of new residents, often for long-term daily care.
Source: CMS Long-Term Care Facility Characteristics (Data as of Jan 2026)
Residents meet regularly to discuss policies, care quality, and activities
Part of a Continuing Care Retirement Community offering multiple care levels
Organized group of residents that meets regularly to discuss facility policies, quality of life, and activities.
Data sourced from CMS Long-Term Care Facility Characteristics quarterly report. Payer mix reflects the current resident census by primary payment source.
Historical financial and operational data for Hampton Suites at Shrewsbury from 2011–2023, based on CMS SNF Cost Reports.
Based on CMS SNF Cost Report for fiscal year ending in 12/2023.
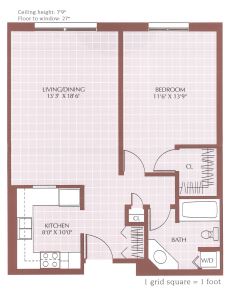
Pets Allowed
Housing Options: Studio / 1 Bed / 2 Bed
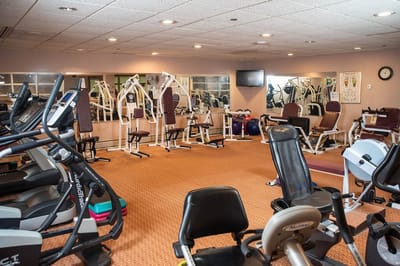
Fitness and Recreation
Most residents stay for extended periods and receive ongoing daily care.
Most new residents arrive under private pay (62% of admissions), and a typical private pay stay runs around 2 - 3 months.
Coverage residents most often arrive under.
Coverage residents most often leave under.
![]() 0.9 miles from city center
0.9 miles from city center
![]() Estimated distance in miles from Shrewsbury's city center to Hampton Suites at Shrewsbury's address, calculated via Google Maps.
Estimated distance in miles from Shrewsbury's city center to Hampton Suites at Shrewsbury's address, calculated via Google Maps.
Add your location
The information below is reported by the Massachusetts Executive Office of Elder Affairs and Department of Public Health.
| Hampton Suites at Shrewsbury | AL NH | Shrewsbury | - | 99
Facility
99
MA AVG
94
Rank
#101 / 280 | - |
21
Facility
21
MA AVG
53
Rank
#412 / 499 | Studio / 1 Bed / 2 Bed |
| Notre Dame du Lac | AL HC MC NC NH PC RC | Worcester (Booth Apartments Area) | - | 110
Facility
110
MA AVG
94
Rank
#80 / 280 | - |
13
Facility
13
MA AVG
53
Rank
#450 / 499 | Studio / 1 Bed / 2 Bed |
| The Jewish Healthcare Center | AL HC NC NH | Worcester (West Tatnuck) | - | 141
Facility
141
MA AVG
94
Rank
#37 / 280 | - |
12
Facility
12
MA AVG
53
Rank
#456 / 499 | - |
| The Lillie Mansion at Lutheran | AL MC NH PC RC | Worcester (Central Business District) | - | 150
Facility
150
MA AVG
94
Rank
#29 / 280 | - |
88
Facility
88
MA AVG
53
Rank
#63 / 499 | - |
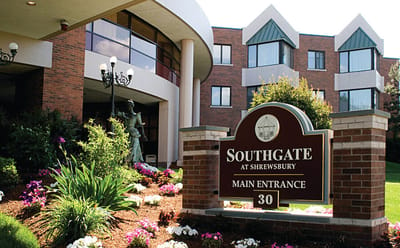
Hampton Suites at Shrewsbury is located in Shrewsbury, Massachusetts.
Here are the financial assistance programs available to residents in Massachusetts.
Hampton Suites at Shrewsbury has a walk score of 21. Car-dependent. Most errands require a car, with limited nearby walkable options.
Hampton Suites at Shrewsbury's occupancy is 81.4%.
Hampton Suites at Shrewsbury is registered as a for-profit.
Yes — there are 6 photos of Hampton Suites at Shrewsbury in the photo gallery on this page.
Hampton Suites at Shrewsbury is located at 30 Julio Dr, Shrewsbury, MA 01545.
(857) 557-6227 will put you in contact with the team at Hampton Suites at Shrewsbury.
Yes — Hampton Suites at Shrewsbury is a CMS-certified provider of Medicare and Medicaid.
Care Cost Calculator: See Prices in Your Area
Nursing Home Data Explorer
Don’t Wait Too Long: 7 Red Flag Signs Your Parent Needs Assisted Living Now
The True Cost of Assisted Living in 2025 – And How Families Are Paying For It
Understanding Senior Living Costs: Pricing Models, Discounts & Financial Assistance


