Harbour View Senior Living
Nursing Home, Assisted Living, Independent Living, Memory Care & Respite Care · Jersey City, NJ
CMS overall rating Info CMS (the Centers for Medicare & Medicaid Services) is the federal agency that rates nursing home quality. Its Overall Rating runs from 1 to 5 stars, combining health inspections, staffing, and quality measures, with inspections weighted most heavily.

Harbour View Senior Living

Nursing Home, Assisted Living, Independent Living, Memory Care & Respite Care · Jersey City, NJ
CMS overall rating Info CMS (the Centers for Medicare & Medicaid Services) is the federal agency that rates nursing home quality. Its Overall Rating runs from 1 to 5 stars, combining health inspections, staffing, and quality measures, with inspections weighted most heavily.
Calculator: See prices in your area
Harbour View Senior Living accepts Medicare, Medicaid, and private pay.

Overview of Harbour View Senior Living

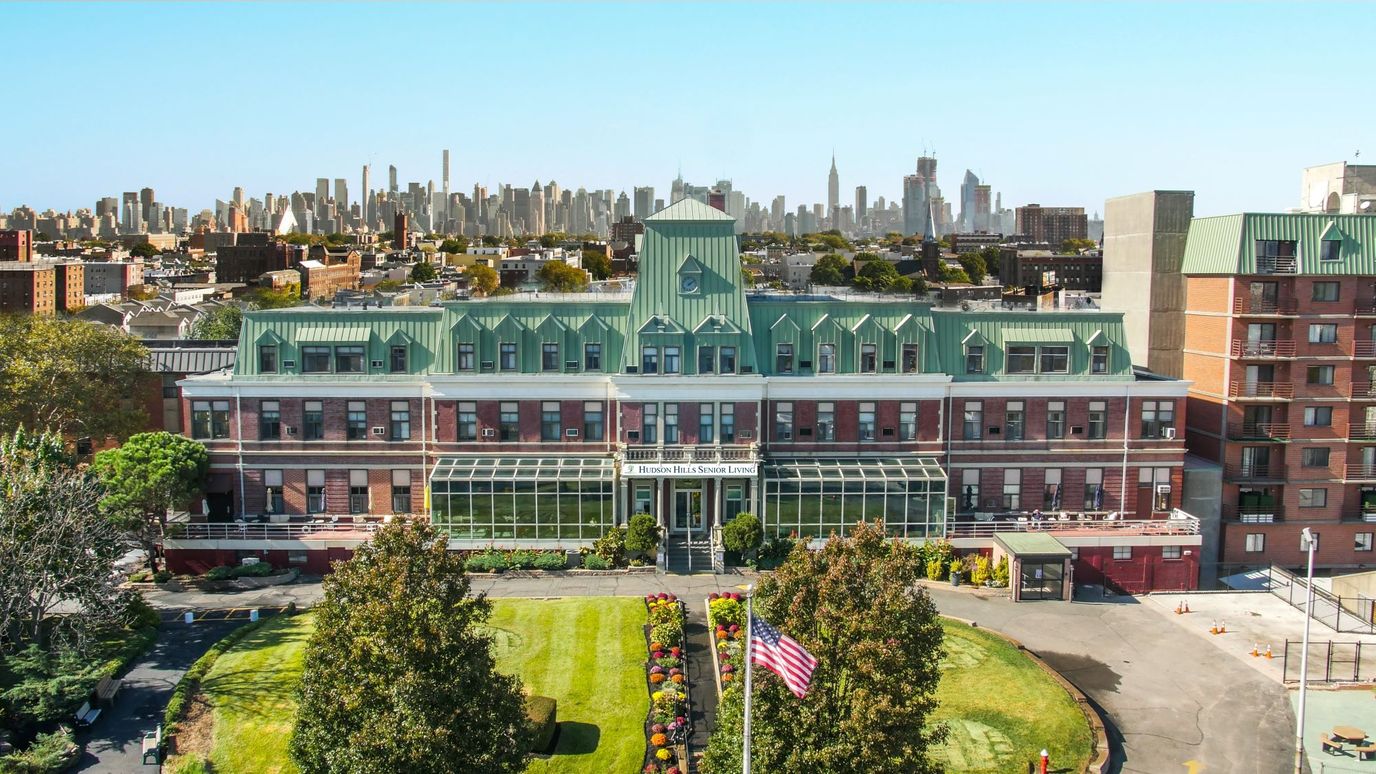
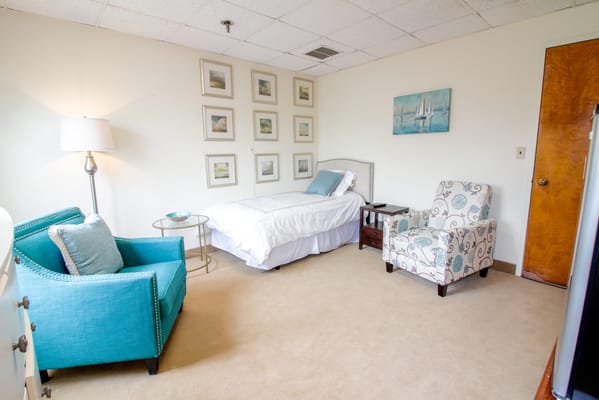
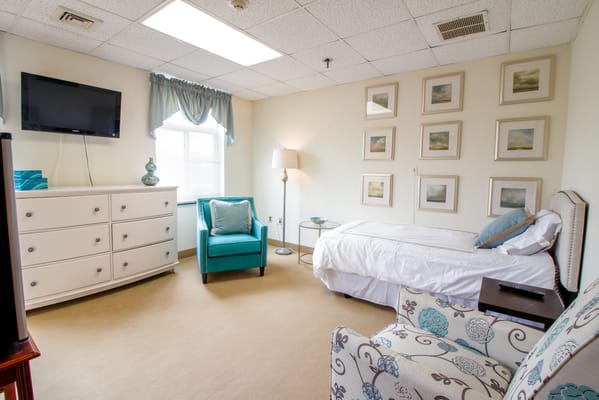
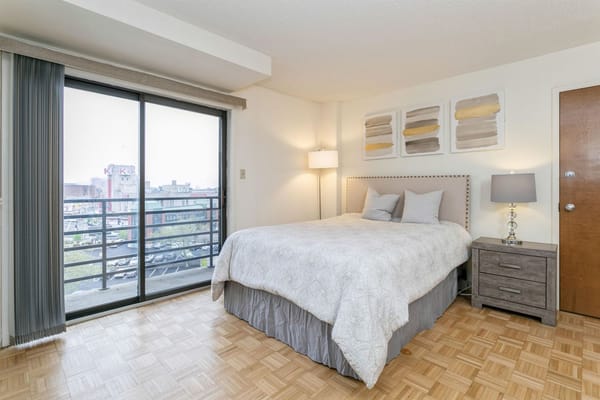
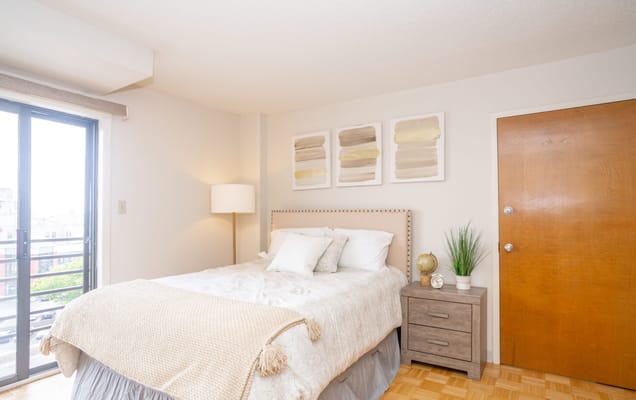
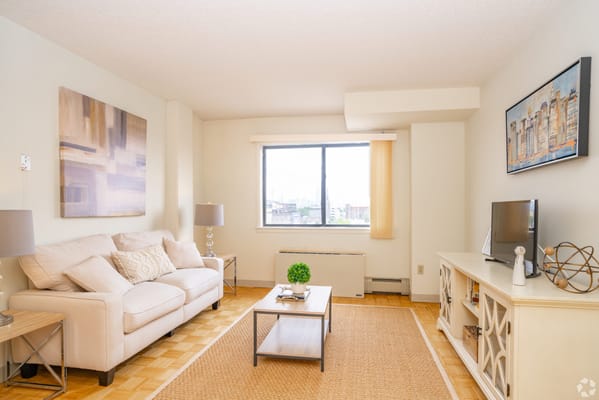
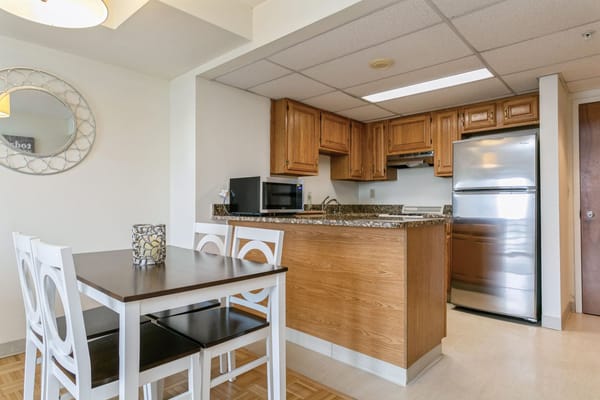
At Harbour View Senior Living, located in serene North Bergen, NJ, the individuality of each resident is celebrated through a continuum of care including independent living, assisted living, short-term and long-term care in addition to trusted and innovative memory care services. Residents of this community admire the way in which the management and staff promote an active lifestyle with activities and programs that keep them engaged and fulfilled.

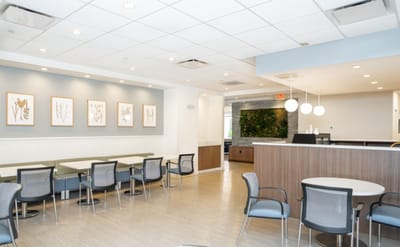
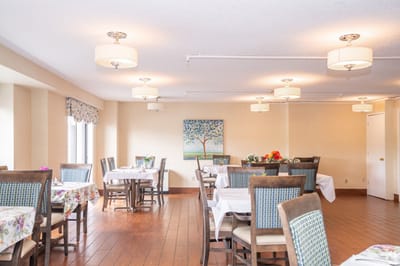
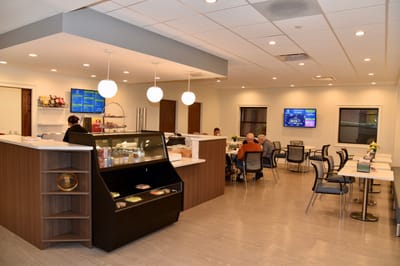
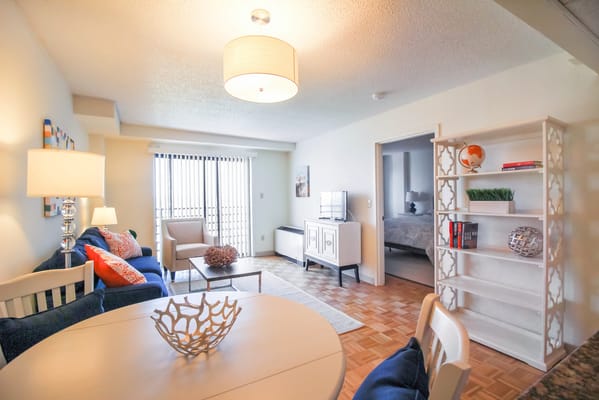
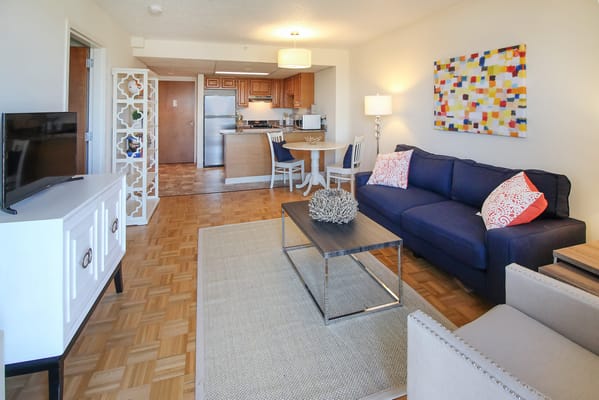
Harbour View is a premier provider of senior living services in New Jersey due to its welcoming environment and accommodating services that contribute to its top-notch quality. This community provides residents with an array of options to choose from in terms of schedule, flexibility, and activities adjusted to their liking.  This beautiful and historic community has been designed for accessibility and enjoyment with its common areas, lounges, library, restaurant-style dining, cafe, and fitness center.

(201) 867-3585

Quality ratings

Measured by Centers for Medicare & Medicaid Services (CMS)

Overall rating Info The Overall CMS Rating combines results from health inspections, staffing levels and quality measures. Health inspections carry the most weight. Staffing and quality scores can increase or decrease the final rating based on performance compared to state and national standards.
▲ 22.7% Above NJ avg. ▲ 22.7% Above NJ avg.NJ average: 3.3Click the badge to see the full State ranking.Click here to see the full State ranking.
Health Inspection Info Based on the results of the facility's three most recent standard inspections and any complaint investigations. CMS reviews the number, scope, and severity of deficiencies, with more recent findings weighted more heavily.
▼ 28.0% Below NJ avg. ▼ 28.0% Below NJ avg.NJ average: 2.8Click the badge to see the full State ranking.Click here to see the full State ranking.
Staffing Info Measures average nursing staff hours per resident per day, including Registered Nurses (RNs) and total nursing staff. Ratings are adjusted based on the level of care residents require and are compared to state and national benchmarks.
▲ 64.0% Above NJ avg. ▲ 64.0% Above NJ avg.NJ average: 3.0Click the badge to see the full State ranking.Click here to see the full State ranking.
Quality Measures Info Based on clinical and physical health indicators reported to CMS, such as hospital readmissions, falls, pressure ulcers, and improvements in mobility. These measures reflect how well residents' health needs are being managed.
▲ 16.1% Above NJ avg. ▲ 16.1% Above NJ avg.NJ average: 4.3Click the badge to see the full State ranking.Click here to see the full State ranking.

Staffing hours breakdown

Info Daily nursing hours per resident by staff type, reported to CMS. Higher is generally better — compare this facility to state and national averages to see where staffing stands.

Hours per resident per day — compared to New Jersey state averages

Total nursing care / resident Info This home is ranked 9th out of 294 homes in New Jersey for nurse hours. Total adjusted nursing hours per resident per day, combining RN, LPN, and aide time. CMS adjusts this for case-mix so facilities can be fairly compared.
5h 54m per day
Rank #9 / 294Nurse hours — State benchmarkedThis home is ranked 9th out of 294 homes in New Jersey. Shows adjusted nurse hours per resident per day benchmarked to the New Jersey average, with a ranking across 294 New Jersey facilities. More hours mean more direct care. The national average is about 3.5 hrs; below 3.0 is a red flag.Ranking totals vary by category as each rank only includes facilities that report data for that metric. Homes missing that data point aren't included in the ranking.Click the rank badge to see the full State ranking.Click here to see the full State ranking.
This facility New Jersey avg (3h 53m per day)
vs New Jersey avg
+52%

2 of 6 metrics below state avg

Standout metric Physical Therapist is +147% above state avg
Staff typeHours / Day / Residentvs state avg
Registered Nurse (RN) Info RNs hold the highest nursing license and can assess residents, interpret test results, and direct care plans. More RN hours per day often signals stronger clinical oversight and faster response to health changes. 34m per day ▼ 18% State avg: 42m per day · National avg: 41m per day
LPN / LVN Info Licensed Practical Nurses (LPNs) or Licensed Vocational Nurses (LVNs) deliver routine hands-on care — medication administration, wound dressing, and monitoring vital signs. They work under RN supervision and make up a large share of daily bedside care. 1h 43m per day ▲ 82% State avg: 57m per day · National avg: 52m per day
Nurse Aide Info Certified Nurse Aides (CNAs) provide the most direct day-to-day assistance: bathing, dressing, feeding, and mobility. Nurse aide hours are typically the largest staffing category and directly affect residents' quality of life. 3h 40m per day ▲ 64% State avg: 2h 15m per day · National avg: 2h 20m per day
Weekend Total Nursing Info Combined nursing hours (RN + LPN + Nurse Aide) per resident per day on weekends. Staffing often drops on weekends — this figure reveals whether the facility maintains adequate coverage outside of weekday hours. 5h 20m per day ▲ 52% State avg: 3h 30m per day · National avg: 3h 27m per day
Physical Therapist Info Hours per resident per day provided by licensed Physical Therapists (PTs) or PT Assistants. PT services help residents recover mobility after injury or illness and are especially important for post-acute (short-stay) rehabilitation. 16m per day ▲ 147% State avg: 7m per day · National avg: 4m per day
Weekend RN Info Registered nurse hours specifically on weekends. Facilities sometimes reduce RN presence on Saturdays and Sundays — a low weekend RN figure compared to weekday hours can indicate reduced clinical oversight when most administrative staff are absent. 25m per day ▼ 17% State avg: 30m per day · National avg: 29m per day

Capacity and availability

This home usually has limited availability

Higher occupancy than the New Jersey average: 77%
Occupancy rate
94.7% Rank #36 / 496Occupancy rate — State benchmarkedThis home is ranked 36th out of 496 homes in New Jersey. Shows this facility's occupancy rate versus the New Jersey average, with its Statewide rank out of 496. Higher occupancy signals strong local demand and financial stability.Ranking totals vary by category as each rank only includes facilities that report data for that metric. Homes missing that data point aren't included in the ranking.Click the rank badge to see the full State ranking.Click here to see the full State ranking.
Avg. Length of Stay
104 days
Bed community size
60-bed community Rank #486 / 561Bed count — State benchmarkedThis home is ranked 486th out of 561 homes in New Jersey. Shows this facility's certified or reported bed count compared to other New Jersey facilities. Larger communities may offer more amenities, programs, and on-site services for residents and families.Ranking totals vary by category as each rank only includes facilities that report data for that metric. Homes missing that data point aren't included in the ranking.Click the rank badge to see the full State ranking.Click here to see the full State ranking.
A moderately sized community that may balance personal attention with shared amenities and social activities.
Walk Score
Walk Score: 93 / 100 Rank #25 / 640Walk Score — State benchmarkedThis home is ranked 25th out of 640 homes in New Jersey. Shows how walkable this facility's neighborhood is compared to the average Walk Score across New Jersey facilities. Higher scores benefit residents, families, and staff.Ranking totals vary by category as each rank only includes facilities that report data for that metric. Homes missing that data point aren't included in the ranking.Click the rank badge to see the full State ranking.Click here to see the full State ranking.
Walker's paradise. Daily errands do not require a car, with many shops and services nearby.

About this community

Payment & Insurance

1 service
Accept Medicare

Therapy & Rehabilitation

3 services
Rehabilitation Services
Respite Care
Short-Term Rehab

Staffing & Medical

2 services
Doctor on Staff
24-Hour Staffing

Contact Harbour View Senior Living

Staffing Data

Reporting period: October 1 – December 31, 2025 (Q4 2025). Source: CMS Payroll-Based Journal report.

Total staff 101
Employees 99
Contractors 2
Staff to resident ratio 1.84 : 1
0% compared with New Jersey average
New Jersey average ratio: 1.79 : 1 New Jersey average ratio: 1.79 : 1See full New Jersey ranking
Avg staff/day 52
Average shift 8.1 hours
0% compared with New Jersey average
New Jersey average: 8 hours New Jersey average shift: 8 hoursSee full New Jersey ranking
Total staff hours (quarter) 38,865

Nursing staff breakdown

Q4 2025 · Oct 1 – Dec 31 More info This data comes from the CMS Payroll-Based Journal report covering October 1 – December 31, 2025.
Registered Nurse

Manages medical care and health needs.

RN Staff Info All 12 RN Staff are full-time employees. No contractors work on this role. 12
Average shift length Info Average shift length. Calculated as total hours divided by days worked and average staff per day. 7.8 hours
Licensed Practical Nurse

Assists with medical care and medications.

LPN Staff Info All 20 LPN Staff are full-time employees. No contractors work on this role. 20
Average shift length Info Average shift length. Calculated as total hours divided by days worked and average staff per day. 8.7 hours
Certified Nursing Assistant

Helps with daily care and mobility.

CNA Staff Info 40 total: 39 full-time employees and 1 contractor. 40
Average shift length Info Average shift length. Calculated as total hours divided by days worked and average staff per day. 8.6 hours

Contractor staffing

Q4 2025 · Oct 1 – Dec 31 More info This data comes from the CMS Payroll-Based Journal report covering October 1 – December 31, 2025.

Total hours from contractors

1.5%

584 contractor hours this quarter

Certified Nursing Assistant: 1 Medical Director: 1

Staff by category

Q4 2025 · Oct 1 – Dec 31 More info This data comes from the CMS Payroll-Based Journal report covering October 1 – December 31, 2025.
Certified Nursing Assistant3914019,30792100%8.6
Licensed Practical Nurse200209,04492100%8.7
Other Dietary Services Staff8082,9949199%7.3
Registered Nurse120122,49492100%7.8
Respiratory Therapy Technician7071,4128592%5.6
Physical Therapy Assistant6061,4008795%6.7
Administrator2025545964%7.9
Nurse Practitioner1014886166%8
Qualified Social Worker1014556065%7.6
Mental Health Service Worker2023524246%8
Occupational Therapy Aide1011913740%5.2
Medical Director0111763942%4.5
40 Certified Nursing Assistant
% of Days 100%
20 Licensed Practical Nurse
% of Days 100%
8 Other Dietary Services Staff
% of Days 99%
12 Registered Nurse
% of Days 100%
7 Respiratory Therapy Technician
% of Days 92%
6 Physical Therapy Assistant
% of Days 95%
2 Administrator
% of Days 64%
1 Nurse Practitioner
% of Days 66%
1 Qualified Social Worker
% of Days 65%
2 Mental Health Service Worker
% of Days 46%
1 Occupational Therapy Aide
% of Days 40%
1 Medical Director
% of Days 42%

Penalties and fines

Federal penalties imposed by CMS for regulatory violations, including civil money penalties (fines) and denials of payment for new Medicare/Medicaid admissions.

Source: CMS Penalties Database

No penalties in the past 3 years

No civil money penalties or payment denials were reported in the last 3 years.

Quality of care over time

These measures show how residents usually do over time at this home, based on health outcomes and preventive care.

High-risk clinical events score Info A composite score based on pressure ulcers, falls with injury, weight loss, walking ability decline, and activities of daily living decline. 6.8
In line with New Jersey average

New Jersey average: 6.8

Functional decline score Info A composite score based on activities of daily living decline, walking ability decline, and incontinence. 6.1
51% better than New Jersey average

New Jersey average: 12.4

Long-stay resident measures
Need for Help with Daily Activities Increased Info Percent of long-stay residents whose need for help with daily activities has increased 9.4%
6% better than New Jersey average

New Jersey average: 10.1%

Walking Ability Worsened Info Percent of long-stay residents whose ability to move independently worsened 6.0%
46% better than New Jersey average

New Jersey average: 11.0%

Low Risk Residents with Bowel/Bladder Incontinence Info Percent of low risk long-stay residents who lose control of their bowels or bladder 3.1%
81% better than New Jersey average

New Jersey average: 16.0%

Falls with Major Injury Info Percent of long-stay residents experiencing one or more falls with major injury 1.5%
39% better than New Jersey average

New Jersey average: 2.4%

High Risk Residents with Pressure Ulcers Info Percent of long-stay high risk residents with pressure ulcers 6.8%
11% worse than New Jersey average

New Jersey average: 6.1%

Urinary Tract Infection Info Percent of long-stay residents with a urinary tract infection 0.5%
46% better than New Jersey average

New Jersey average: 1.0%

Lost Too Much Weight Info Percent of long-stay residents who lose too much weight 10.4%
124% worse than New Jersey average

New Jersey average: 4.6%

Depressive Symptoms Info Percent of long-stay residents who have depressive symptoms 1.0%
91% better than New Jersey average

New Jersey average: 11.3%

Antipsychotic Use Info Percent of long-stay residents who received an antipsychotic medication 3.8%
66% better than New Jersey average

New Jersey average: 11.1%

Pneumococcal Vaccine Info Percent of long-stay residents assessed and appropriately given the pneumococcal vaccine 80.9%
13% worse than New Jersey average

New Jersey average: 93.0%

Influenza Vaccine Info Percent of long-stay residents assessed and appropriately given the seasonal influenza vaccine 91.2%
6% worse than New Jersey average

New Jersey average: 97.2%

Short-stay resident measures
Pneumococcal Vaccine Info Percent of short-stay residents assessed and appropriately given the pneumococcal vaccine 23.1%
71% worse than New Jersey average

New Jersey average: 78.9%

Antipsychotic medication increase Info Percent of short-stay residents who newly received an antipsychotic medication 4.8%
314% worse than New Jersey average

New Jersey average: 1.2%

Influenza Vaccine Info Percent of short-stay residents assessed and appropriately given the seasonal influenza vaccine 35.1%
56% worse than New Jersey average

New Jersey average: 80.1%

Breakdown by payment type

Medicare

51% of new residents, usually for short-term rehab.

Typical stay 1 - 2 months

Private pay

29% of new residents, often for short stays.

Typical stay 2 - 3 months

Medicaid

20% of new residents, often for long-term daily care.

Typical stay 9 - 10 months

Facility Characteristics

Source: CMS Long-Term Care Facility Characteristics (Data as of Jan 2026)

Total residents 55
Medicare
13
23.6% of residents
Medicaid
34
61.8% of residents
Private pay or other
8
14.5% of residents
Programs & Services
Residents Group

Residents meet regularly to discuss policies, care quality, and activities

CCRC

Part of a Continuing Care Retirement Community offering multiple care levels

Active Resident Council

Organized group of residents that meets regularly to discuss facility policies, quality of life, and activities.

Finances and operations

Based on CMS SNF Cost Report for fiscal year ending in 12/2023.

Voluntary non-profit community
Operated by a church.
Net patient revenue Info Net patient revenue — what the home actually collects for resident care, after contractual allowances, bad debt and discounts are subtracted from its gross charges (CMS cost report, Worksheet G-3). It covers resident care only; money the home earns from other sources is shown separately as "Other income."
$7.9M
Net patient income Info Net patient income: net patient revenue minus the home's total operating expenses. A positive figure means it earns more from resident care than it spends to deliver it; a negative figure means the opposite. It excludes non-operating "other income."
-$3.9M
Voluntary non-profit community Operated by a church.
Net patient revenue Info Net patient revenue — what the home actually collects for resident care, after contractual allowances, bad debt and discounts are subtracted from its gross charges (CMS cost report, Worksheet G-3). It covers resident care only; money the home earns from other sources is shown separately as "Other income."
$7.9M Rank #272 / 292Revenue — State benchmarkedThis home is ranked 272nd out of 292 homes in New Jersey. Shows this facility's annual revenue compared to the New Jersey average. Higher revenue generally means more resources for staffing and capital — read alongside Payroll %.Ranking totals vary by category as each rank only includes facilities that report data for that metric. Homes missing that data point aren't included in the ranking.Click the rank badge to see the full State ranking.Click here to see the full State ranking.
Net patient income Info Net patient income: net patient revenue minus the home's total operating expenses. A positive figure means it earns more from resident care than it spends to deliver it; a negative figure means the opposite. It excludes non-operating "other income."
-$3.9M
Other income Info Money the home earns outside of resident care — such as investments, grants, rentals and other non-operating sources (CMS cost report, Worksheet G-3). It is tracked separately from net patient revenue: it is not part of that figure, and it is not included in net patient income.
$6.8K
Payroll costs Info Staff salaries plus wage-related costs — benefits such as payroll taxes, health insurance and retirement — from the home's own accounting records (CMS cost report, Worksheet A). Contract or agency labor is counted separately, under other operating costs. Rank #249 / 292Payroll — State benchmarkedThis home is ranked 249th out of 292 homes in New Jersey. Shows total annual staff payroll benchmarked to the New Jersey average. Higher payroll investment relative to peers often signals better staffing and less reliance on cheaper contract labor.Ranking totals vary by category as each rank only includes facilities that report data for that metric. Homes missing that data point aren't included in the ranking.Click the rank badge to see the full State ranking.Click here to see the full State ranking.
$5.7M 72% of net patient revenue Info Payroll as a share of revenue: staff salaries and wage-related benefits divided by net patient revenue. A higher figure means more of each revenue dollar goes to staff pay. Rank #20 / 292Payroll % — State benchmarkedThis home is ranked 20th out of 292 homes in New Jersey. Shows payroll as a percentage of revenue versus the New Jersey average. Well-run New Jersey facilities typically land around 55–65% — the top third Statewide. Below 25% may signal understaffing or heavy agency use — read with Staffing ratings.Ranking totals vary by category as each rank only includes facilities that report data for that metric. Homes missing that data point aren't included in the ranking.Click the rank badge to see the full State ranking.Click here to see the full State ranking.
Other operating costs Info Everything it costs to run the home apart from payroll — food, utilities, supplies, maintenance, contract labor and administration. Calculated as total operating expense minus payroll (staff salaries and wage-related benefits).
$6.1M
Total costs Info The home's total operating expense for the year — all the costs of running it, salaries included (CMS cost report, Worksheet G-3).
$11.8M

What does this home offer?

Pets allowed icon
Pets allowed icon

Pets Allowed

Housing options icon

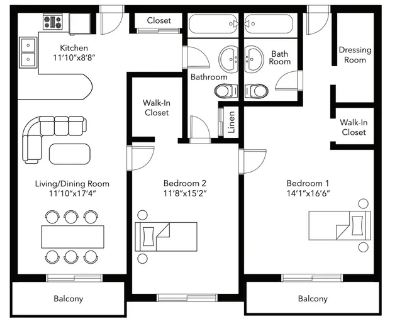
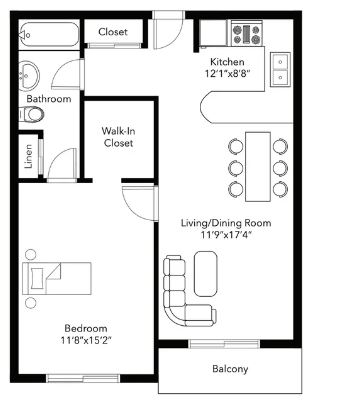
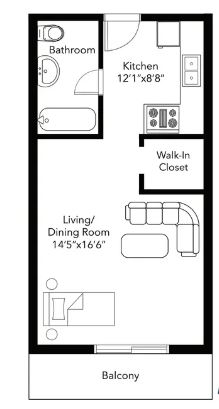
Housing Options: Studio / 1 Bed / 2 Bed

Building type icon
Building type icon

Building Type: 3-story

Fitness and recreation icon

Fitness and Recreation

Type of Rooms Available

Studio
Studio
1 / 4
Studio
1
348 sq. ft
1 Bed
1 Bed
1 / 4
1 Bed
1
620 sq. ft
2 Bed
2 Bed
2 Bed
2 Bed
1 / 4
2 Bed
1
975 sq. ft

Who this home usually serves

TYPE OF STAY

Mostly short-term rehab stays

Most residents typically stay for a few weeks or months before returning home or moving on.

Most new residents arrive under Medicare (51% of admissions), and a typical Medicare stay runs around 1 - 2 months.

Admissions
205 total

Coverage residents most often arrive under.

Medicare 51%
Private pay 29%
Medicaid 20%
Discharges
200 total

Coverage residents most often leave under.

Medicare 41%
Private pay 31%
Medicaid 29%

Living Spaces & Floor Plans for Harbour View Senior Living

Harbour View Senior Living 2 Bed 2
Harbour View Senior Living 1 Bed 2
Harbour View Senior Living Studio 2

Places of interest near Harbour View Senior Living

Address 6.6 miles from city center Info Estimated distance in miles from North Bergen's city center to Harbour View Senior Living's address, calculated via Google Maps. — 2.45 miles to nearest hospital (Mount Sinai West)

Calculate Travel Distance to Harbour View Senior Living

Add your location

Address

Compare Nursing Home around Jersey City

The information below is reported by the New Jersey Department of Health, Health Facilities Evaluation and Licensing.

5 facilities compared · CMS & NJ Dept. of Health data

Acclaim Rehabilitation and Care Center
NH
HC
MC
PC
Jersey City (Greenville)
183
Facility 183
NJ AVG 125
Rank #77 / 561
83.1%
Facility 83.1%
NJ AVG 77%
Rank #210 / 496
+8%
3.29
Facility 3.29
NJ AVG 3.88
Rank #221 / 294
-71%-15%
$0
Facility $0
NJ AVG $76.4k
Rank #1 / 297
13
Facility 13
NJ AVG 20.9
Rank #66 / 296
3.3
Facility 3.3
NJ AVG 5.3
Rank #59 / 296
-156-
80
Facility 80
NJ AVG 47
Rank #91 / 640
Robert Smolin
$17.1M
Facility $17.1M
NJ AVG $19.6M
Rank #131 / 292
$7.2M
Facility $7.2M
NJ AVG $7.1M
Rank #143 / 292
42%
Facility 42%
NJ AVG 39.3%
Rank #205 / 292
315083
Alaris Health at Hamilton Park
NH
HC
PC
RC
Jersey City (Hamilton Park)
260
Facility 260
NJ AVG 125
Rank #20 / 561
64.6%
Facility 64.6%
NJ AVG 77%
Rank #379 / 496
-16%
4.08
Facility 4.08
NJ AVG 3.88
Rank #69 / 294
+58%+5%
$0
Facility $0
NJ AVG $76.4k
Rank #1 / 297
19
Facility 19
NJ AVG 20.9
Rank #140 / 296
3.2
Facility 3.2
NJ AVG 5.3
Rank #54 / 296
-175-
90
Facility 90
NJ AVG 47
Rank #34 / 640
Hpo LLC
$22.2M
Facility $22.2M
NJ AVG $19.6M
Rank #72 / 292
$1.8M
Facility $1.8M
NJ AVG $7.1M
Rank #52 / 292
8.3%
Facility 8.3%
NJ AVG 39.3%
Rank #120 / 292
315300
Harbour View Senior Living
NH
AL
IL
MC
RC
North Bergen (Bergen Turnpike)
60
Facility 60
NJ AVG 125
Rank #486 / 561
94.7%
Facility 94.7%
NJ AVG 77%
Rank #36 / 496
+23%
5.90
Facility 5.90
NJ AVG 3.88
Rank #9 / 294
+29%+52%
$28.7k
Facility $28.7k
NJ AVG $76.4k
Rank #223 / 297
18
Facility 18
NJ AVG 20.9
Rank #125 / 296
6.0
Facility 6.0
NJ AVG 5.3
Rank #194 / 296
157-
93
Facility 93
NJ AVG 47
Rank #25 / 640
Yedidya Danziger
$7.9M
Facility $7.9M
NJ AVG $19.6M
Rank #272 / 292
$5.7M
Facility $5.7M
NJ AVG $7.1M
Rank #249 / 292
72%
Facility 72%
NJ AVG 39.3%
Rank #20 / 292
315525
Optima Care Harborview
NH
HC
MC
NC
PC
RC
Jersey City (The Heights)
180
Facility 180
NJ AVG 125
Rank #78 / 561
71.1%
Facility 71.1%
NJ AVG 77%
Rank #326 / 496
-8%
3.79
Facility 3.79
NJ AVG 3.88
Rank #111 / 294
-28%-2%
$13.7k
Facility $13.7k
NJ AVG $76.4k
Rank #194 / 297
17
Facility 17
NJ AVG 20.9
Rank #113 / 296
4.3
Facility 4.3
NJ AVG 5.3
Rank #112 / 296
-138-
92
Facility 92
NJ AVG 47
Rank #28 / 640
Eric Mendel
$17.2M
Facility $17.2M
NJ AVG $19.6M
Rank #159 / 292
$3.0M
Facility $3.0M
NJ AVG $7.1M
Rank #162 / 292
17.2%
Facility 17.2%
NJ AVG 39.3%
Rank #176 / 292
315310
Peace Care St. Ann’s
NH
ADC
Jersey City (Greenville)
120
Facility 120
NJ AVG 125
Rank #236 / 561
88.3%
Facility 88.3%
NJ AVG 77%
Rank #131 / 496
+15%
4.07
Facility 4.07
NJ AVG 3.88
Rank #69 / 294
+170%+5%
$0
Facility $0
NJ AVG $76.4k
Rank #1 / 297
12
Facility 12
NJ AVG 20.9
Rank #52 / 296
3.0
Facility 3.0
NJ AVG 5.3
Rank #41 / 296
-108-
86
Facility 86
NJ AVG 47
Rank #51 / 640
Peace Care Inc
$16.6M
Facility $16.6M
NJ AVG $19.6M
Rank #75 / 292
$9.3M
Facility $9.3M
NJ AVG $7.1M
Rank #107 / 292
55.9%
Facility 55.9%
NJ AVG 39.3%
Rank #212 / 292
315413

Financial Assistance for
Nursing Home in New Jersey

Harbour View Senior Living is located in North Bergen, New Jersey.
Here are the financial assistance programs available to residents in New Jersey.

Get Financial aid guidance

Managed Long Term Services and Supports

NJ Medicaid MLTSS

Age 65+ or disabled
General New Jersey resident, Medicaid- eligible, nursing home-level care need.
Income Limits (2025) ~$2,829/month 300% FBR, individual
Asset Limits $2,000 (individual), $3,000 (couple).
NJ

High urban demand; managed care model.

Benefits
In-home care (5-7 hours/day) Assisted living Respite (240 hours/year) Medical services

JACC (Jersey Assistance for Community Caregiving)

NJ JACC

Age 60+
General New Jersey resident, at risk of nursing home.
Income Limits ~$2,500/month individual, varies
Asset Limits $40,000 individual
NJ

Higher asset limit; limited funding.

Benefits
In-home care (3-5 hours/week) Respite (up to 10 days/year) Home modifications (~$1,000 avg.)

Pharmaceutical Assistance to the Aged and Disabled (PAAD)

New Jersey PAAD

Age 65+
General NJ resident, enrolled in Medicare Part D or eligible.
Income Limits (2025) ~$42,142/year (individual), ~$49,209/year (couple).
Asset Limits Not assessed.
NJ

Copays $5 (generic), $7 (brand); covers Part D premiums up to benchmark.

Benefits
Prescription cost reduction ($500-$1,000/year savings) Premium assistance ($20/month above benchmark)

Senior Gold Prescription Discount Program

New Jersey Senior Gold

Age 65+
General NJ resident, enrolled in Medicare Part D or eligible.
Income Limits (2025) ~$42,142-$52,142/year (individual), ~$49,209-$59,209/year (couple).
Asset Limits Not assessed.
NJ

Copays $15 + 50% of remaining cost; no premium assistance.

Benefits
Prescription cost reduction (~$300-$800/year savings)

Medicare Savings Program (MSP)

New Jersey Medicare Savings Program

Age 65+ or disabled
General NJ resident, Medicare Part A/B.
Income Limits (2025) ~$2,510/month (QMB), ~$3,380/month (SLMB), ~$3,598/month (QI)—individual.
Asset Limits $9,430 (individual), $14,130 (couple).
NJ

Three tiers; no waitlist; includes Extra Help for Part D.

Benefits
Covers Part B premiums ($174.70/month) Deductibles ($240/year) Copays (~20%)

Senior Freeze (Property Tax Reimbursement)

New Jersey Senior Freeze

Age 65+ by Dec 31 prior year
General NJ resident, homeowner, paid property taxes.
Income Limits (2025) ~$150,000/year combined household, projected
Asset Limits Not assessed; home ownership required.
NJ

Combines with ANCHOR/Stay NJ via PAS-1; annual application.

Benefits
Tax reimbursement (~$500-$2,000/year) for increases since base year

ANCHOR (Affordable NJ Communities for Homeowners and Renters)

New Jersey ANCHOR

Age 65+ prioritized
General NJ resident, homeowner/renter, paid property taxes/rent.
Income Limits (2025) ~$150,000/year (homeowners), ~$75,000/year (renters).
Asset Limits Not assessed.
NJ

Combines with Senior Freeze/Stay NJ; broader than prior Homestead program.

Benefits
Tax relief (~$700-$1,500/year homeowners, ~$250-$450 renters)

Stay NJ

New Jersey Stay NJ

Age 65+ by Dec 31 prior year
General NJ resident, homeowner, lived in home 10+ years.
Income Limits (2025) ~$500,000/year projected, subject to final regs
Asset Limits Not assessed; home ownership required.
NJ

Up to 50% tax credit (max $6,500); phased implementation.

Benefits
Tax credit (~$3,000-$6,500/year, projected) starting 2026

Universal Service Fund (USF)

New Jersey Universal Service Fund

Age 65+ prioritized
General NJ resident, utility customer, low-income.
Income Limits (2025) ~$3,970/month individual, 185% FPL
Asset Limits Not assessed; income-focused.
NJ

Must owe >$25 on bill; combines with LIHEAP if eligible.

Benefits
Bill credits (~$300-$1,500/year) to cap energy costs at 6% of income

NJ Family Caregiver Support Program (via NFCSP)

New Jersey Family Caregiver Support Program

Age
General Caregivers of 60+ needing care or 55+ caregivers of others; NJ resident; functional needs (2+ ADLs).
Income Limits (2025) Prioritizes ~$24,980/year (individual); no strict cap.
Asset Limits Not assessed; need-based.
NJ

21 AAAs; rural/low-income priority.

Benefits
Respite (4-6 hours/week or 5 days/year) Adult day care ($60/day) Training Supplies (~$500/year)

VA Aid and Attendance (A&A) and Housebound Benefits

New Jersey VA Aid and Attendance/Housebound

Age 65+ or disabled veteran/spouse
General NJ resident, wartime service, need for ADL help (A&A) or homebound.
Income Limits (2025) Net income < ~$1,984/month (veteran with dependent, A&A); pension offsets income.
Asset Limits ~$155,356 net worth limit
NJ

High veteran demand in urban/rural areas.

Benefits
Cash (~$1,433-$2,642/month veteran, ~$951-$1,318 spouse) for care costs (e.g., in-home, assisted living)

Frequently Asked Questions about Harbour View Senior Living

What neighborhood is Harbour View Senior Living in?

Harbour View Senior Living is in the Bergen Turnpike neighborhood.

Is Harbour View Senior Living in a walkable area?

Harbour View Senior Living has a walk score of 93. Walker's paradise. Daily errands do not require a car, with many shops and services nearby.

What is the occupancy rate at Harbour View Senior Living?

Harbour View Senior Living's occupancy is 94.7%.

Are there photos of Harbour View Senior Living?

Yes — there are 6 photos of Harbour View Senior Living in the photo gallery on this page.

What is the address of Harbour View Senior Living?

Harbour View Senior Living is located at 3505 Bergen Turnpike, North Bergen, NJ 07047, United States.

What is the phone number of Harbour View Senior Living?

(201) 867-3585 will put you in contact with the team at Harbour View Senior Living.

Is Harbour View Senior Living Medicare or Medicaid certified?

Yes — Harbour View Senior Living is a CMS-certified provider of Medicare and Medicaid.

Guides for Better Senior Living

Care Cost Calculator: See Prices in Your Area

Nursing Home Data Explorer

Don’t Wait Too Long: 7 Red Flag Signs Your Parent Needs Assisted Living Now

The True Cost of Assisted Living in 2025 – And How Families Are Paying For It

Understanding Senior Living Costs: Pricing Models, Discounts & Financial Assistance