Heritage Care & Rehabilitation Center
Nursing Home · Iowa, IA
CMS overall rating Info The Overall CMS Rating is scored from 1 to 5 stars and combines results from health inspections, staffing levels, and quality measures. Health inspections carry the most weight. Staffing and quality scores can increase or decrease the final rating based on performance compared to state and national standards.

Heritage Care & Rehabilitation Center

Nursing Home · Iowa, IA
CMS overall rating Info The Overall CMS Rating is scored from 1 to 5 stars and combines results from health inspections, staffing levels, and quality measures. Health inspections carry the most weight. Staffing and quality scores can increase or decrease the final rating based on performance compared to state and national standards.
Calculator: See prices in your area
Heritage Care & Rehabilitation Center accepts Medicare, Medicaid, and private pay.

Overview of Heritage Care & Rehabilitation Center

Heritage Rehabilitation and Care focuses on healing, wellness, and enriching lives through compassionate care. It offers a welcoming atmosphere where expert caregivers deliver personalized treatments, aiding in physical recovery and enhancing overall quality of life. The facility specializes in a full spectrum of rehabilitation services and amenities.
(641) 423-2121

Quality ratings

Measured by Centers for Medicare & Medicaid Services (CMS)

Overall rating Info The Overall CMS Rating combines results from health inspections, staffing levels and quality measures. Health inspections carry the most weight. Staffing and quality scores can increase or decrease the final rating based on performance compared to state and national standards.
▲ 30.6% Above IA avg. ▲ 30.6% Above IA avg.Click the badge to see the full State ranking.Click here to see the full State ranking.
Health Inspection Info Based on the results of the facility's three most recent standard inspections and any complaint investigations. CMS reviews the number, scope, and severity of deficiencies, with more recent findings weighted more heavily.
▲ 40.3% Above IA avg. ▲ 40.3% Above IA avg.Click the badge to see the full State ranking.Click here to see the full State ranking.
Staffing Info Measures average nursing staff hours per resident per day, including Registered Nurses (RNs) and total nursing staff. Ratings are adjusted based on the level of care residents require and are compared to state and national benchmarks.
▼ 15.4% Below IA avg. ▼ 15.4% Below IA avg.Click the badge to see the full State ranking.Click here to see the full State ranking.
Quality Measures Info Based on clinical and physical health indicators reported to CMS, such as hospital readmissions, falls, pressure ulcers, and improvements in mobility. These measures reflect how well residents' health needs are being managed.
▲ 22.2% Above IA avg. ▲ 22.2% Above IA avg.Click the badge to see the full State ranking.Click here to see the full State ranking.

Staffing hours breakdown

Info Daily nursing hours per resident by staff type, reported to CMS. Higher is generally better — compare this facility to state and national averages to see where staffing stands.

Hours per resident per day — compared to Iowa state averages

Total nursing care / resident Info This home is ranked 213th out of 241 homes in Iowa. Total adjusted nursing hours per resident per day, combining RN, LPN, and aide time. CMS adjusts this for case-mix so facilities can be fairly compared.
3h 28m per day
Rank #213 / 241Nurse hours — State benchmarkedThis home is ranked 213th out of 241 homes in Iowa. Shows adjusted nurse hours per resident per day benchmarked to the Iowa average, with a ranking across 241 Iowa SNFs. More hours mean more direct care. The national average is about 3.5 hrs; below 3.0 is a red flag.Click the rank badge to see the full State ranking.Click here to see the full State ranking.
This facility Iowa avg (4h 18m per day)
vs Iowa avg
-19%

1 of 1 metrics below state avg

Staff typeHours / Day / Residentvs state avg
Weekend Total Nursing Info Combined nursing hours (RN + LPN + Nurse Aide) per resident per day on weekends. Staffing often drops on weekends — this figure reveals whether the facility maintains adequate coverage outside of weekday hours. 2h 52m per day ▼ 15% State avg: 3h 21m per day · National avg: 3h 26m per day

Capacity and availability

This home usually has availability

Occupancy lower than 85% suggests more openings may be available.

Lower occupancy than the Iowa average: 75.4%
Occupancy rate 63.4% Rank #211 / 401Occupancy rate — State benchmarkedThis home is ranked 211th out of 401 homes in Iowa. Shows this facility's occupancy rate versus the Iowa average, with its Statewide rank out of 401. Higher occupancy signals strong local demand and financial stability.Click the rank badge to see the full State ranking.Click here to see the full State ranking.
Avg. Length of Stay 112 days
Occupancy rate
63.4% Rank #211 / 401Occupancy rate — State benchmarkedThis home is ranked 211th out of 401 homes in Iowa. Shows this facility's occupancy rate versus the Iowa average, with its Statewide rank out of 401. Higher occupancy signals strong local demand and financial stability.Click the rank badge to see the full State ranking.Click here to see the full State ranking.
Avg. Length of Stay
112 days
Walk Score
Walk Score: 85 / 100 Rank #29 / 528Walk Score — State benchmarkedThis home is ranked 29th out of 528 homes in Iowa. Shows how walkable this facility's neighborhood is compared to the average Walk Score across Iowa SNFs. Higher scores benefit residents, families, and staff.Click the rank badge to see the full State ranking.Click here to see the full State ranking.
Very walkable. Most errands can be accomplished on foot, and many essentials are within a short walk.

About this community

Therapy & Rehabilitation

2 services
Rehabilitation Services
Short-Term Rehab

Amenities & Lifestyle

High-Speed Wi-Fi
Basic Cable Tv
Outdoor Walking Trail
Laundry Services
Specific ProgramsHealthcare Services, Suites & Accommodations

Contact Heritage Care & Rehabilitation Center

Staffing Data

Reporting period: October 1 – December 31, 2025 (Q4 2025). Source: CMS Payroll-Based Journal report.

Total staff 112
Employees 88
Contractors 24
Staff to resident ratio 1.81:1
12% worse than Iowa average
Iowa average ratio: 2.05:1 Iowa average ratio: 2.05:1See full Iowa ranking
Avg staff/day 34
Average shift 6.9 hours
7% worse than Iowa average
Iowa average: 7.4 hours Iowa average shift: 7.4 hoursSee full Iowa ranking
Total staff hours (quarter) 21,611

Nursing staff breakdown

Q4 2025 · Oct 1 – Dec 31 More info This data comes from the CMS Payroll-Based Journal report covering October 1 – December 31, 2025.
Registered Nurse

Manages medical care and health needs.

RN Staff 5
Average shift length Info Average shift length. Calculated as total hours divided by days worked and average staff per day. 8 hours

No contractors work on this role.

Licensed Practical Nurse

Assists with medical care and medications.

LPN Staff 14
Average shift length Info Average shift length. Calculated as total hours divided by days worked and average staff per day. 7.7 hours

This role is partially covered by contractors.

Certified Nursing Assistant

Helps with daily care and mobility.

CNA Staff 57
Average shift length Info Average shift length. Calculated as total hours divided by days worked and average staff per day. 6.9 hours

This role is partially covered by contractors.

Contractor staffing

Q4 2025 · Oct 1 – Dec 31 More info This data comes from the CMS Payroll-Based Journal report covering October 1 – December 31, 2025.

Total hours from contractors

3.9%

843 contractor hours this quarter

Certified Nursing Assistant: 18 Feeding Assistant: 2 Occupational Therapy Aide: 2 Licensed Practical Nurse: 1 Medical Director: 1

Staff by category

Q4 2025 · Oct 1 – Dec 31 More info This data comes from the CMS Payroll-Based Journal report covering October 1 – December 31, 2025.
Certified Nursing Assistant39185711,03592100%6.9
Licensed Practical Nurse131143,57892100%7.7
Registered Nurse5051,5379199%8
RN Director of Nursing2029396773%7.6
Medication Aide/Technician9097978491%5.1
Nurse Practitioner1015046368%8
Dietitian1014986470%7.8
Administrator1014966267%8
Dental Services Staff1014775964%8.1
Speech Language Pathologist2024586470%7
Other Dietary Services Staff1013846368%6.1
Physical Therapy Assistant4043724650%7.4
Feeding Assistant0221444953%2.9
Respiratory Therapy Technician3031324043%3.2
Qualified Social Worker2021022426%3.3
Physical Therapy Aide303821617%5.2
Occupational Therapy Aide123481415%3.4
Medical Director0112933%9.7
57 Certified Nursing Assistant
% of Days 100%
14 Licensed Practical Nurse
% of Days 100%
5 Registered Nurse
% of Days 99%
2 RN Director of Nursing
% of Days 73%
9 Medication Aide/Technician
% of Days 91%
1 Nurse Practitioner
% of Days 68%
1 Dietitian
% of Days 70%
1 Administrator
% of Days 67%
1 Dental Services Staff
% of Days 64%
2 Speech Language Pathologist
% of Days 70%
1 Other Dietary Services Staff
% of Days 68%
4 Physical Therapy Assistant
% of Days 50%
2 Feeding Assistant
% of Days 53%
3 Respiratory Therapy Technician
% of Days 43%
2 Qualified Social Worker
% of Days 26%
3 Physical Therapy Aide
% of Days 17%
3 Occupational Therapy Aide
% of Days 15%
1 Medical Director
% of Days 3%

Penalties and fines

Federal penalties imposed by CMS for regulatory violations, including civil money penalties (fines) and denials of payment for new Medicare/Medicaid admissions.

Source: CMS Penalties Database

No penalties in the past 3 years

No civil money penalties or payment denials were reported in the last 3 years.

Quality of care over time

These measures show how residents usually do over time at this home, based on health outcomes and preventive care.

High-risk clinical events score Info A composite score based on pressure ulcers, falls with injury, weight loss, walking ability decline, and activities of daily living decline. 8.1
21% better than Iowa average

Iowa average: 10.2

Functional decline score Info A composite score based on activities of daily living decline, walking ability decline, and incontinence. 17.0
21% better than Iowa average

Iowa average: 21.6

Long-stay resident measures
Above average Iowa avg: 3.3 Info CMS star rating based on long-stay quality measure performance. 5 stars = significantly above average, 1 star = significantly below average.
Need for Help with Daily Activities Increased Info Percent of long-stay residents whose need for help with daily activities has increased 13.0%
31% better than Iowa average

Iowa average: 18.8%

Walking Ability Worsened Info Percent of long-stay residents whose ability to move independently worsened 15.4%
22% better than Iowa average

Iowa average: 19.7%

Low Risk Residents with Bowel/Bladder Incontinence Info Percent of low risk long-stay residents who lose control of their bowels or bladder 22.7%
14% better than Iowa average

Iowa average: 26.2%

Falls with Major Injury Info Percent of long-stay residents experiencing one or more falls with major injury 2.6%
29% better than Iowa average

Iowa average: 3.6%

High Risk Residents with Pressure Ulcers Info Percent of long-stay high risk residents with pressure ulcers 3.6%
19% better than Iowa average

Iowa average: 4.4%

Urinary Tract Infection Info Percent of long-stay residents with a urinary tract infection 1.0%
59% better than Iowa average

Iowa average: 2.5%

Lost Too Much Weight Info Percent of long-stay residents who lose too much weight 5.9%
18% worse than Iowa average

Iowa average: 5.0%

Depressive Symptoms Info Percent of long-stay residents who have depressive symptoms 7.5%
92% worse than Iowa average

Iowa average: 3.9%

Antipsychotic Use Info Percent of long-stay residents who received an antipsychotic medication 30.6%
61% worse than Iowa average

Iowa average: 19.0%

Pneumococcal Vaccine Info Percent of long-stay residents assessed and appropriately given the pneumococcal vaccine 99.5%
5% better than Iowa average

Iowa average: 94.4%

Influenza Vaccine Info Percent of long-stay residents assessed and appropriately given the seasonal influenza vaccine 98.0%
In line with Iowa average

Iowa average: 95.3%

Hospitalizations per 1,000 days Info Number of hospitalizations per 1,000 long-stay resident days. 0.71
52% better than Iowa average

Iowa average: 1.48

ED visits per 1,000 days Info Number of outpatient emergency department visits per 1,000 long-stay resident days. 2.55
22% worse than Iowa average

Iowa average: 2.09

Short-stay resident measures
Below average Iowa avg: 2.6 Info CMS star rating based on short-stay quality measure performance. 5 stars = much above average, 1 star = much below average.
Pneumococcal Vaccine Info Percent of short-stay residents assessed and appropriately given the pneumococcal vaccine 95.8%
13% better than Iowa average

Iowa average: 85.1%

Antipsychotic medication increase Info Percent of short-stay residents who newly received an antipsychotic medication 0.0%
100% better than Iowa average

Iowa average: 1.8%

Influenza Vaccine Info Percent of short-stay residents assessed and appropriately given the seasonal influenza vaccine 81.6%
11% better than Iowa average

Iowa average: 73.3%

Re-hospitalized after SNF stay Info Percentage of short-stay residents who were re-hospitalized after their nursing home admission. 40.1%
88% worse than Iowa average

Iowa average: 21.3%

Emergency department visits Info Percentage of short-stay residents who had an outpatient emergency department visit. 12.5%
5% better than Iowa average

Iowa average: 13.1%

Falls with major injury Info Percentage of SNF residents who experience falls with major injury during their stay. 2.0%
160% worse than Iowa average

Iowa average: 0.8%

Ability to care for self at discharge Info Percentage of residents at or above expected ability to care for themselves at discharge. 42.1%
22% worse than Iowa average

Iowa average: 53.7%

Successful return to home or community Info Rate of successful return to home or community from a skilled nursing facility. 41.6%
18% worse than Iowa average

Iowa average: 50.6%

Breakdown by payment type

Medicare

31% of new residents, usually for short-term rehab.

Typical stay 22 days

Private pay

51% of new residents, often for short stays.

Typical stay 2 - 3 months

Medicaid

18% of new residents, often for long-term daily care.

Typical stay 1 years

Facility Characteristics

Source: CMS Long-Term Care Facility Characteristics (Data as of Jan 2026)

Total residents 62
Medicare
5
8.1% of residents
Medicaid
41
66.1% of residents
Private pay or other
16
25.8% of residents

Finances and operations

Privately-owned community
Operated by a business corporation.
Home revenue
$6.2M
Operating loss
-$19.3K
Privately-owned community Operated by a business corporation.
Home revenue
$6.2M Rank #139 / 242Revenue — State benchmarkedThis home is ranked 139th out of 242 homes in Iowa. Shows this facility's annual revenue compared to the Iowa SNF average. Higher revenue generally means more resources for staffing and capital — read alongside Payroll %.Click the rank badge to see the full State ranking.Click here to see the full State ranking.
Operating loss
-$19.3K
Payroll costs Info The portion of the home's budget spent on staff, including nurses, caregivers, and other employees who support care and operations. Rank #114 / 242Payroll — State benchmarkedThis home is ranked 114th out of 242 homes in Iowa. Shows total annual staff payroll benchmarked to the Iowa average. Higher payroll investment relative to peers often signals better staffing and less reliance on cheaper contract labor.Click the rank badge to see the full State ranking.Click here to see the full State ranking.
$4.0M
64.3% of revenue Rank #49 / 242Payroll % — State benchmarkedThis home is ranked 49th out of 242 homes in Iowa. Shows payroll as a percentage of revenue versus the Iowa average. Well-run Iowa SNFs typically land around 61–69% — the top third Statewide. Below 25% may signal understaffing or heavy agency use — read with Staffing ratings.Click the rank badge to see the full State ranking.Click here to see the full State ranking.
Other operating costs Info All remaining costs needed to run the home, such as food, utilities, building maintenance, supplies and administrative expenses.
$2.2M
Total costs $6.2M

Who this home usually serves

TYPE OF STAY

Mix of rehab and long-term care

This home supports both short-term rehab and long-term care, with residents staying for a wide range of durations.

Places of interest near Heritage Care & Rehabilitation Center

Address 0.0 miles from city center Info Estimated distance in miles from Mason City's city center to Heritage Care & Rehabilitation Center's address, calculated via Google Maps.

Calculate Travel Distance to Heritage Care & Rehabilitation Center

Add your location

Address

Financial Assistance for
Nursing Home in Iowa

Heritage Care & Rehabilitation Center is located in Mason City, Iowa.
Here are the financial assistance programs available to residents in Iowa.

Get Financial aid guidance

Elderly Waiver

Iowa Medicaid Elderly Waiver

Age 65+
General Iowa resident, Medicaid-eligible, nursing home-level care need.
Income Limits (2025) ~$2,829/month 300% FBR, individual
Asset Limits $2,000 (individual), $3,000 (couple).
IA

Rural focus; waitlists possible.

Benefits
In-home care (5-7 hours/day) Meals ($6/meal) Respite (240 hours/year) Adult day care ($60/day)

Iowa Family Caregiver Support

IA NFCSP

Age Caregiver of someone 60+
General Iowa resident.
Income Limits No strict limit; prioritizes low-income.
Asset Limits Not applicable.
IA

Limited slots; rural emphasis.

Benefits
In-home respite (4-6 hours/day) Adult day care (~$60/day) Short-term facility care (up to 5 days)

Medicare Savings Program (MSP)

Iowa Medicare Savings Program

Age 65+ or disabled
General Iowa resident, Medicare Part A/B.
Income Limits (2025) ~$2,510/month (QMB), ~$3,380/month (SLMB), ~$3,598/month (QI)—individual.
Asset Limits $9,430 (individual), $14,130 (couple).
IA

Three tiers; no waitlist.

Benefits
Covers Part B premiums ($174.70/month) Deductibles ($240/year) Copays (~20%)

Program of All-Inclusive Care for the Elderly (PACE)

Iowa PACE

Age 55+
General Iowa resident, nursing home-level care need, safe with PACE support.
Income Limits (2025) ~$2,829/month 300% FBR, Medicaid-eligible
Asset Limits $2,000 (individual), $3,000 (couple).
IA

Limited to western Iowa (e.g., Council Bluffs); expanding slowly.

Benefits
Personal care (5-7 hours/day) Medical care Meals Transportation Therapy Respite

VA Aid and Attendance (A&A) and Housebound Benefits

Iowa VA Aid and Attendance/Housebound

Age 65+ or disabled veteran/spouse
General Iowa resident, wartime service, need for ADL help (A&A) or homebound.
Income Limits (2025) Net income < ~$1,984/month (veteran with dependent, A&A); pension offsets income.
Asset Limits ~$155,356 net worth limit
IA

High veteran demand in rural areas.

Benefits
Cash (~$1,433-$2,642/month veteran, ~$951-$1,318 spouse) for care costs (e.g., in-home, assisted living)

Able Up Iowa

Able Up Iowa

Age 65+ or disabled
General Iowa resident, ability to repay loan, need for assistive tech or mods.
Income Limits (2025) No strict limit; must demonstrate repayment capacity.
Asset Limits Not specified; credit-based.
IA

Loans up to $25,000; statewide via Easterseals partnership.

Benefits
Loans for wheelchairs Ramps Walk-in tubs (~$500-$10,000 avg.) Reducing reliance on paid care

Compare Nursing Home around Iowa

The information below is reported by the Iowa Department of Inspections, Appeals, and Licensing.

5 facilities compared · CMS & IA Dept. of Health data

Filter by care type
Sunrise Retirement Community
NH

Nursing Home Licensed facility providing 24/7 skilled nursing care for residents with complex, ongoing medical needs. Staffed by RNs, LPNs, and CNAs. Inspected and star-rated annually by CMS. Accepts Medicare (short-term rehab) and Medicaid (long-term care).

AL

Assisted Living A licensed, long-term care setting for seniors or individuals with disabilities who need help with daily activities — like bathing, dressing, and medication management — but not 24-hour skilled nursing. Offers housing, meals, and around-the-clock support while aiming to maximize resident independence.

IL

Independent Living Lifestyle-focused communities for older adults offering dining, activities, and transportation with minimal personal care. Best for active, independent seniors who want community without medical support.

MC

Memory Care Secured, specialized care for people living with Alzheimer's or dementia. Staff trained in cognitive impairment, with higher staff-to-resident ratios and an environment designed to reduce confusion and wandering risk.

Sioux City74 134.2% +78%6.19 -23%+44%$0113.7-66A+ 22 Samantha Roth$14.6M$8.5M58.2%165473
Terrace Glen Village
NH

Nursing Home Licensed facility providing 24/7 skilled nursing care for residents with complex, ongoing medical needs. Staffed by RNs, LPNs, and CNAs. Inspected and star-rated annually by CMS. Accepts Medicare (short-term rehab) and Medicaid (long-term care).

AL

Assisted Living A licensed, long-term care setting for seniors or individuals with disabilities who need help with daily activities — like bathing, dressing, and medication management — but not 24-hour skilled nursing. Offers housing, meals, and around-the-clock support while aiming to maximize resident independence.

IL

Independent Living Lifestyle-focused communities for older adults offering dining, activities, and transportation with minimal personal care. Best for active, independent seniors who want community without medical support.

Marion (Flynn)40 94.7% +26%4.48 +20%+4%$12.2k144.7439A 14 Abernathy Family Farms LLC$9.5M$4.5M47.9%165625
Heritage Care & Rehabilitation Center
NH

Nursing Home Licensed facility providing 24/7 skilled nursing care for residents with complex, ongoing medical needs. Staffed by RNs, LPNs, and CNAs. Inspected and star-rated annually by CMS. Accepts Medicare (short-term rehab) and Medicaid (long-term care).

AL

Assisted Living A licensed, long-term care setting for seniors or individuals with disabilities who need help with daily activities — like bathing, dressing, and medication management — but not 24-hour skilled nursing. Offers housing, meals, and around-the-clock support while aiming to maximize resident independence.

Mason City87 63.4% -16%3.46 -61%-19%$073.5161- 85 -$6.2M$4.0M64.3%165367
Maple Crest Manor
NH

Nursing Home Licensed facility providing 24/7 skilled nursing care for residents with complex, ongoing medical needs. Staffed by RNs, LPNs, and CNAs. Inspected and star-rated annually by CMS. Accepts Medicare (short-term rehab) and Medicaid (long-term care).

AL

Assisted Living A licensed, long-term care setting for seniors or individuals with disabilities who need help with daily activities — like bathing, dressing, and medication management — but not 24-hour skilled nursing. Offers housing, meals, and around-the-clock support while aiming to maximize resident independence.

MC

Memory Care Secured, specialized care for people living with Alzheimer's or dementia. Staff trained in cognitive impairment, with higher staff-to-resident ratios and an environment designed to reduce confusion and wandering risk.

Fayette (Bolger Drive)46 82.4% +9%4.01 +29%-7%$97.2k84.0-39- 29 Albert W Martin Estate$5.8M$3.6M61.6%165437
Ramsey Village Continuing Care
NH

Nursing Home Licensed facility providing 24/7 skilled nursing care for residents with complex, ongoing medical needs. Staffed by RNs, LPNs, and CNAs. Inspected and star-rated annually by CMS. Accepts Medicare (short-term rehab) and Medicaid (long-term care).

AL

Assisted Living A licensed, long-term care setting for seniors or individuals with disabilities who need help with daily activities — like bathing, dressing, and medication management — but not 24-hour skilled nursing. Offers housing, meals, and around-the-clock support while aiming to maximize resident independence.

IL

Independent Living Lifestyle-focused communities for older adults offering dining, activities, and transportation with minimal personal care. Best for active, independent seniors who want community without medical support.

MC

Memory Care Secured, specialized care for people living with Alzheimer's or dementia. Staff trained in cognitive impairment, with higher staff-to-resident ratios and an environment designed to reduce confusion and wandering risk.

Des Moines (Drake)78 85.8% +14%4.04 -46%-6%$0314.4161- 38 Claremont House Inc.$12.4M$8.5M68.5%165514

Frequently Asked Questions about Heritage Care & Rehabilitation Center

Is Heritage Care & Rehabilitation Center in a walkable area?

Heritage Care & Rehabilitation Center has a walk score of 85. Very walkable. Most errands can be accomplished on foot, and many essentials are within a short walk.

Are there photos of Heritage Care & Rehabilitation Center?

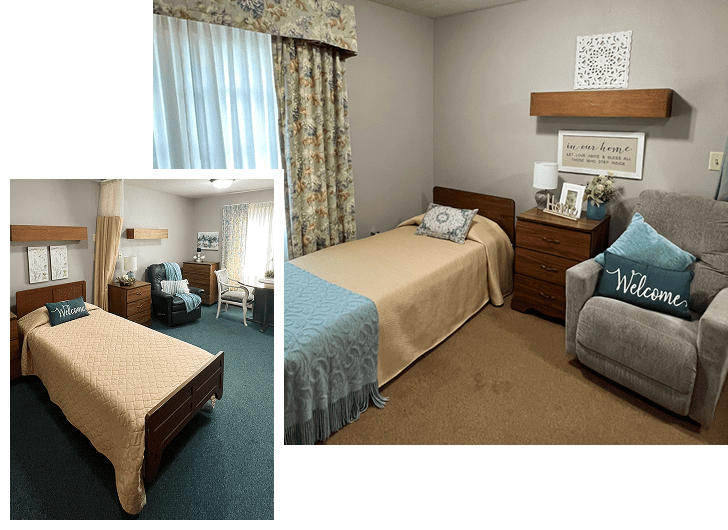
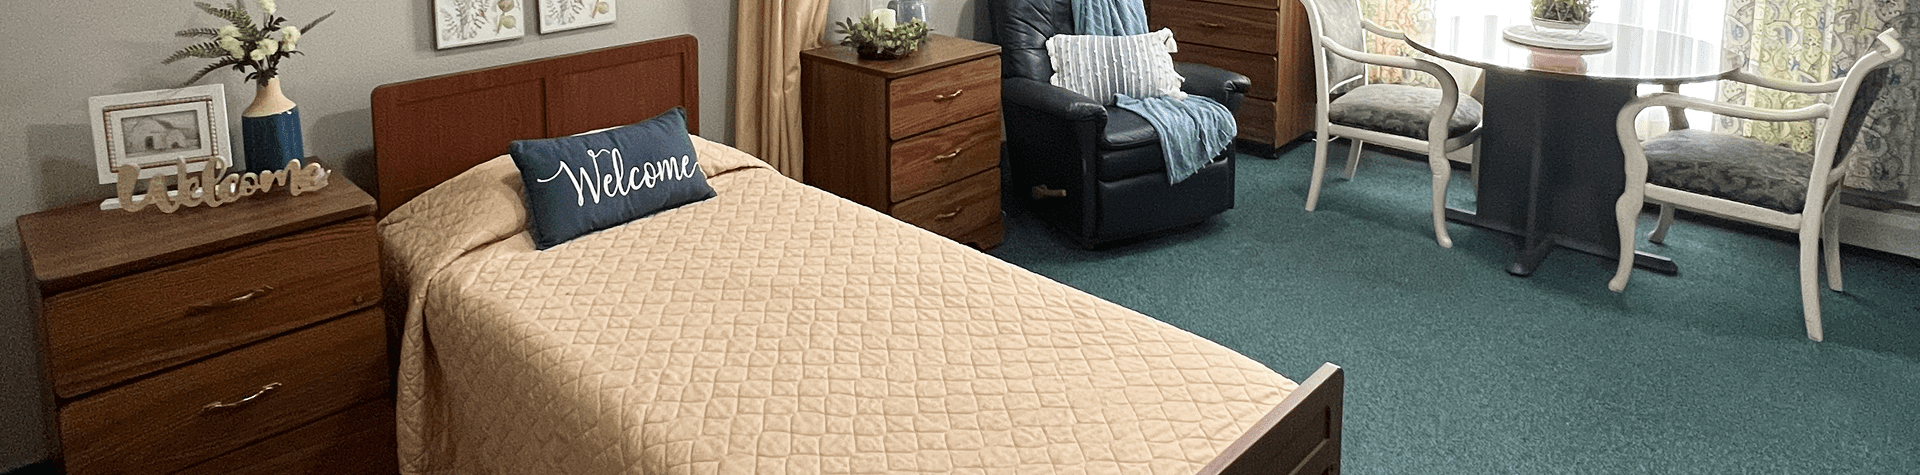
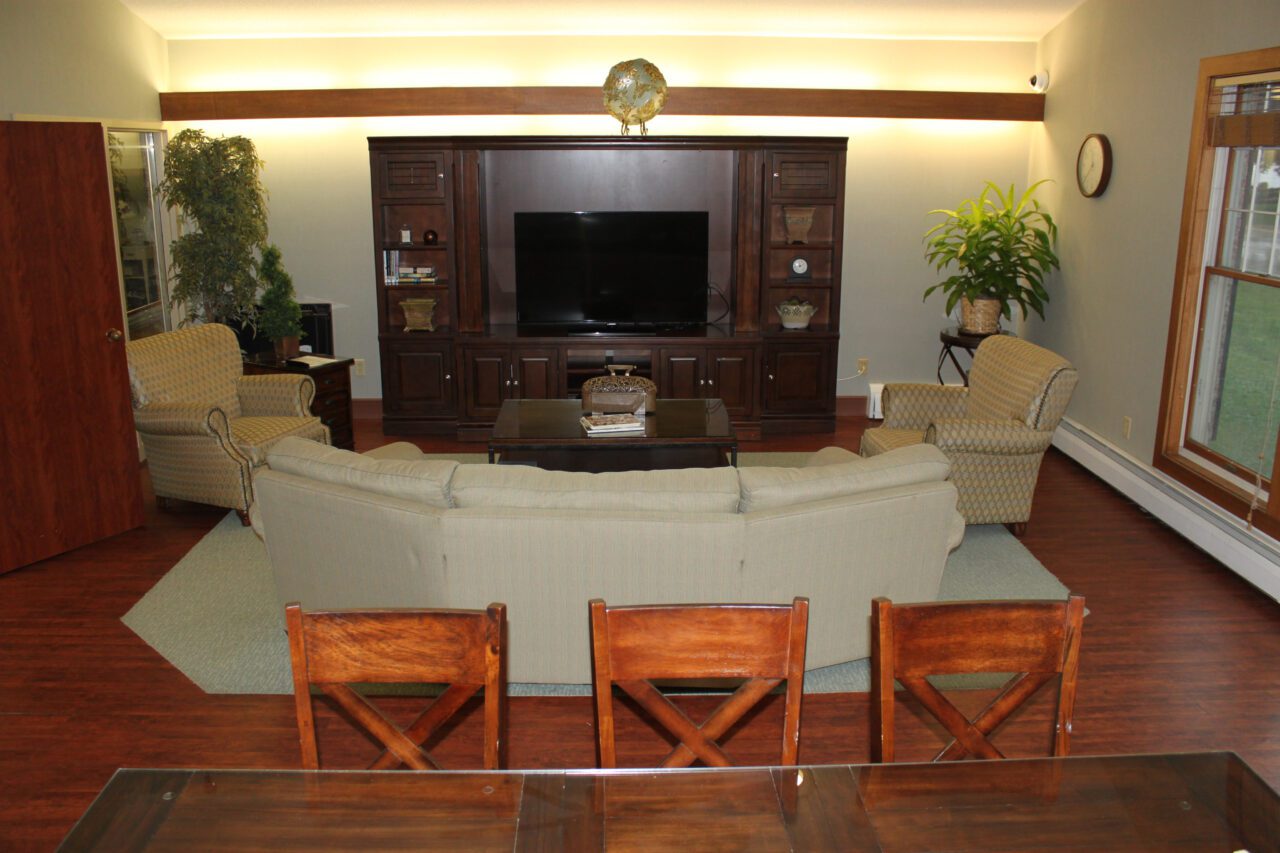
Yes — there are 9 photos of Heritage Care & Rehabilitation Center in the photo gallery on this page.

What is the address of Heritage Care & Rehabilitation Center?

Heritage Care & Rehabilitation Center is located at 501 South Kentucky Avenue.

What is the phone number of Heritage Care & Rehabilitation Center?

(641) 423-2121 will put you in contact with the team at Heritage Care & Rehabilitation Center.

Is Heritage Care & Rehabilitation Center Medicare or Medicaid certified?

Yes — Heritage Care & Rehabilitation Center is a CMS-certified provider of Medicare and Medicaid.

Guides for Better Senior Living

Care Cost Calculator: See Prices in Your Area

Nursing Home Data Explorer

Don’t Wait Too Long: 7 Red Flag Signs Your Parent Needs Assisted Living Now

The True Cost of Assisted Living in 2025 – And How Families Are Paying For It

Understanding Senior Living Costs: Pricing Models, Discounts & Financial Assistance

Explore Open Rooms
1 Contact details
2 What type of senior care service are you looking for?
3 What budget do you have in mind for senior care?
4 How soon do you need to find care?
5 Additional details

Thank you for your interest!

Our team will be in touch shortly to help with next steps.