Heritage Place Independent Living
Nursing Home & Independent Living · Fort Worth, TX
CMS overall rating Info The Overall CMS Rating is scored from 1 to 5 stars and combines results from health inspections, staffing levels, and quality measures. Health inspections carry the most weight. Staffing and quality scores can increase or decrease the final rating based on performance compared to state and national standards.

Heritage Place Independent Living

Nursing Home & Independent Living · Fort Worth, TX
CMS overall rating Info The Overall CMS Rating is scored from 1 to 5 stars and combines results from health inspections, staffing levels, and quality measures. Health inspections carry the most weight. Staffing and quality scores can increase or decrease the final rating based on performance compared to state and national standards.
Calculator: See prices in your area
Heritage Place Independent Living accepts Medicare, Medicaid, and private pay.

Overview of Heritage Place Independent Living

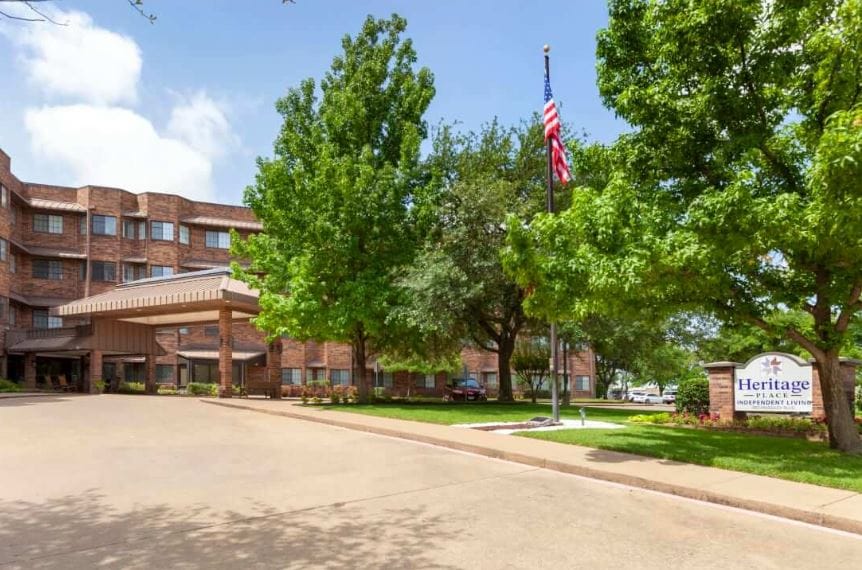
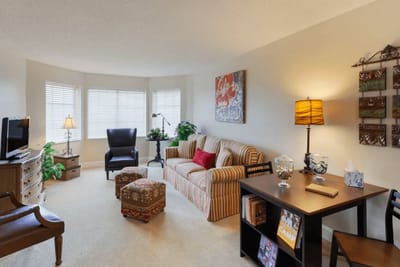
Live life to the fullest with the reliable senior living community of Heritage Place Independent Living situated in Huguley Boulevard, Burleson, TX, offering independent living. Featuring intricately designed and spacious floor plans including studio, one-bedroom, and two-bedroom apartments, seniors enjoy unparalleled relaxation and safety. The community doubles its efforts to deliver the highest quality of care and support for seniors to enjoy the things they love and experience new things in their golden years.

Participate in enjoyable activities and fun programs orchestrated for seniors to live a blissful lifestyle. Delight in healthy and delicious meals satisfying nutritional requirements and tastes. Heritage Place Independent Living is ideal for a retirement in comfort and style with its scenic campus filled with wonderful amenities and a friendly environment.

(817) 409-8158

Quality ratings

Measured by Centers for Medicare & Medicaid Services (CMS)

Overall rating Info The Overall CMS Rating combines results from health inspections, staffing levels and quality measures. Health inspections carry the most weight. Staffing and quality scores can increase or decrease the final rating based on performance compared to state and national standards.
▲ 7.4% Above TX avg. ▲ 7.4% Above TX avg.Click the badge to see the full State ranking.Click here to see the full State ranking.
Health Inspection Info Based on the results of the facility's three most recent standard inspections and any complaint investigations. CMS reviews the number, scope, and severity of deficiencies, with more recent findings weighted more heavily.
▼ 27.6% Below TX avg. ▼ 27.6% Below TX avg.Click the badge to see the full State ranking.Click here to see the full State ranking.
Staffing Info Measures average nursing staff hours per resident per day, including Registered Nurses (RNs) and total nursing staff. Ratings are adjusted based on the level of care residents require and are compared to state and national benchmarks.
▼ 5.7% Below TX avg. ▼ 5.7% Below TX avg.Click the badge to see the full State ranking.Click here to see the full State ranking.
Quality Measures Info Based on clinical and physical health indicators reported to CMS, such as hospital readmissions, falls, pressure ulcers, and improvements in mobility. These measures reflect how well residents' health needs are being managed.
▲ 33.2% Above TX avg. ▲ 33.2% Above TX avg.Click the badge to see the full State ranking.Click here to see the full State ranking.

Staffing hours breakdown

Info Daily nursing hours per resident by staff type, reported to CMS. Higher is generally better — compare this facility to state and national averages to see where staffing stands.

Hours per resident per day — compared to Texas state averages

Total nursing care / resident Info This home is ranked 140th out of 289 homes in Texas. Total adjusted nursing hours per resident per day, combining RN, LPN, and aide time. CMS adjusts this for case-mix so facilities can be fairly compared.
3h 28m per day
Rank #140 / 289Nurse hours — State benchmarkedThis home is ranked 140th out of 289 homes in Texas. Shows adjusted nurse hours per resident per day benchmarked to the Texas average, with a ranking across 289 Texas SNFs. More hours mean more direct care. The national average is about 3.5 hrs; below 3.0 is a red flag.Click the rank badge to see the full State ranking.Click here to see the full State ranking.
This facility Texas avg (3h 38m per day)
vs Texas avg
-5%
Staff typeHours / Day / Residentvs state avg
Weekend Total Nursing Info Combined nursing hours (RN + LPN + Nurse Aide) per resident per day on weekends. Staffing often drops on weekends — this figure reveals whether the facility maintains adequate coverage outside of weekday hours. 2h 55m per day

Types of Care at Heritage Place Independent Living

Independent Living

Capacity and availability

This home usually has availability

Occupancy lower than 85% suggests more openings may be available.

Lower occupancy than the Texas average: 63.5%
Occupancy rate 48.3% Rank #246 / 297Occupancy rate — State benchmarkedThis home is ranked 246th out of 297 homes in Texas. Shows this facility's occupancy rate versus the Texas average, with its Statewide rank out of 297. Higher occupancy signals strong local demand and financial stability.Click the rank badge to see the full State ranking.Click here to see the full State ranking.
Avg. Length of Stay 118 days
Occupancy rate
48.3% Rank #246 / 297Occupancy rate — State benchmarkedThis home is ranked 246th out of 297 homes in Texas. Shows this facility's occupancy rate versus the Texas average, with its Statewide rank out of 297. Higher occupancy signals strong local demand and financial stability.Click the rank badge to see the full State ranking.Click here to see the full State ranking.
Avg. Length of Stay
118 days
Walk Score
Walk Score: 25 / 100 Rank #1021 / 1393Walk Score — State benchmarkedThis home is ranked 1021st out of 1393 homes in Texas. Shows how walkable this facility's neighborhood is compared to the average Walk Score across Texas SNFs. Higher scores benefit residents, families, and staff.Click the rank badge to see the full State ranking.Click here to see the full State ranking.
Somewhat walkable. A few nearby services may be reachable on foot, but most trips require transportation.

About this community

Safety & Compliance

Wheelchair Accessible

Staffing & Medical

1 service
24-Hour Staffing

Additional Policies & Features

Pets Allowed
Utilities IncludedYes, all utilities except phone.

Amenities & Lifestyle

Pet-Friendly
Salon And Barber Shop
Billiards Room
Library
Exercise Room
Computer Room
Craft Room
Chapel
Tv Room
Outdoor Gardening Area
ActivitiesResidents can participate in various social activities, classes, and outings.
Specific ProgramsCulinary

Pricing & Financial Information

Starting Price$2467 per month

Dining & Nutrition

Food DescriptionResidents are treated to three delicious restaurant-quality meals every day, served in shared dining spaces.

Contact Heritage Place Independent Living

Staffing Data

Reporting period: October 1 – December 31, 2025 (Q4 2025). Source: CMS Payroll-Based Journal report.

Total staff 190
Employees 150
Contractors 40
Staff to resident ratio 2.07:1
40% better than Texas average
Texas average ratio: 1.48:1 Texas average ratio: 1.48:1See full Texas ranking
Avg staff/day 43
Average shift 7.8 hours
0% compared with Texas average
Texas average: 8.1 hours Texas average shift: 8.1 hoursSee full Texas ranking
Total staff hours (quarter) 30,757

Nursing staff breakdown

Q4 2025 · Oct 1 – Dec 31 More info This data comes from the CMS Payroll-Based Journal report covering October 1 – December 31, 2025.
Registered Nurse

Manages medical care and health needs.

RN Staff 4
Average shift length Info Average shift length. Calculated as total hours divided by days worked and average staff per day. 8.7 hours

This role is partially covered by contractors.

Licensed Practical Nurse

Assists with medical care and medications.

LPN Staff 44
Average shift length Info Average shift length. Calculated as total hours divided by days worked and average staff per day. 7.6 hours

This role is partially covered by contractors.

Certified Nursing Assistant

Helps with daily care and mobility.

CNA Staff 71
Average shift length Info Average shift length. Calculated as total hours divided by days worked and average staff per day. 8.5 hours

This role is partially covered by contractors.

Contractor staffing

Q4 2025 · Oct 1 – Dec 31 More info This data comes from the CMS Payroll-Based Journal report covering October 1 – December 31, 2025.

Total hours from contractors

1.3%

415 contractor hours this quarter

Certified Nursing Assistant: 22 Licensed Practical Nurse: 16 Registered Nurse: 2

Staff by category

Q4 2025 · Oct 1 – Dec 31 More info This data comes from the CMS Payroll-Based Journal report covering October 1 – December 31, 2025.
Certified Nursing Assistant49227113,31592100%8.5
Licensed Practical Nurse2816448,41592100%7.6
Medication Aide/Technician110112,76092100%9
RN Director of Nursing2021,0856672%8.5
Speech Language Pathologist4048887076%6.9
Physical Therapy Aide2028046571%6.8
Nurse Practitioner1015126470%8
Mental Health Service Worker1015126470%8
Clinical Nurse Specialist1014886166%8
Physical Therapy Assistant1013986368%6.3
Administrator1013444347%8
Dietitian1013444347%8
Qualified Social Worker6062787076%3.2
Registered Nurse2242512932%8.7
Respiratory Therapy Technician3031834650%3.7
Physical Therapist350351512325%3.4
Other Dietary Services Staff202281213%2.2
71 Certified Nursing Assistant
% of Days 100%
44 Licensed Practical Nurse
% of Days 100%
11 Medication Aide/Technician
% of Days 100%
2 RN Director of Nursing
% of Days 72%
4 Speech Language Pathologist
% of Days 76%
2 Physical Therapy Aide
% of Days 71%
1 Nurse Practitioner
% of Days 70%
1 Mental Health Service Worker
% of Days 70%
1 Clinical Nurse Specialist
% of Days 66%
1 Physical Therapy Assistant
% of Days 68%
1 Administrator
% of Days 47%
1 Dietitian
% of Days 47%
6 Qualified Social Worker
% of Days 76%
4 Registered Nurse
% of Days 32%
3 Respiratory Therapy Technician
% of Days 50%
35 Physical Therapist
% of Days 25%
2 Other Dietary Services Staff
% of Days 13%

Penalties and fines

Includes penalties issued in 2023-2025

Federal penalties imposed by CMS for regulatory violations, including civil money penalties (fines) and denials of payment for new Medicare/Medicaid admissions.

Source: CMS Penalties Database (Data as of Jan 2026)

Total fines amount $66K Rank #219 / 294Federal fines — State benchmarkedThis home is ranked 219th out of 294 homes in Texas. Shows this facility's cumulative CMS federal fine dollars versus the Texas average among facilities with fines, and where it ranks among 294 skilled nursing facilities in the pool. Lower total dollars mean a better rank.Click the rank badge to see the full State ranking.Click here to see the full State ranking.
18% lower than Texas average

Texas average: $80K

Number of fines 3
21% more fines than Texas average

Texas average: 2.5

Payment Denials Info Serious action where Medicare and/or Medicaid temporarily stops payments for new residents until issues are fixed. 0
100% fewer payment denials than Texas average

Texas average: 0.2

Fines amount comparison
This facility $66K
Texas average $80K
Penalty History

Penalties are imposed by CMS for violations of federal nursing home regulations.

3 penalties in the past 3 years

Multiple penalties were reported in the last 3 years.

Civil Money Penalty Info Fines imposed for noncompliance, which can be assessed per day or per instance of violation. May 23, 2025
$10K
Civil Money Penalty Info Fines imposed for noncompliance, which can be assessed per day or per instance of violation. Feb 12, 2025
$17K
Civil Money Penalty Info Fines imposed for noncompliance, which can be assessed per day or per instance of violation. Nov 1, 2023
$39K

Last updated: Jan 2026

Quality of care over time

These measures show how residents usually do over time at this home, based on health outcomes and preventive care.

High-risk clinical events score Info A composite score based on pressure ulcers, falls with injury, weight loss, walking ability decline, and activities of daily living decline. 5.4
38% better than Texas average

Texas average: 8.6

Functional decline score Info A composite score based on activities of daily living decline, walking ability decline, and incontinence. 8.4
48% better than Texas average

Texas average: 16.0

Long-stay resident measures
Need for Help with Daily Activities Increased Info Percent of long-stay residents whose need for help with daily activities has increased 5.6%
65% better than Texas average

Texas average: 16.2%

Walking Ability Worsened Info Percent of long-stay residents whose ability to move independently worsened 10.7%
34% better than Texas average

Texas average: 16.2%

Low Risk Residents with Bowel/Bladder Incontinence Info Percent of low risk long-stay residents who lose control of their bowels or bladder 8.8%
44% better than Texas average

Texas average: 15.7%

Falls with Major Injury Info Percent of long-stay residents experiencing one or more falls with major injury 2.4%
25% better than Texas average

Texas average: 3.2%

High Risk Residents with Pressure Ulcers Info Percent of long-stay high risk residents with pressure ulcers 4.9%
10% worse than Texas average

Texas average: 4.4%

Urinary Tract Infection Info Percent of long-stay residents with a urinary tract infection 0.0%
100% better than Texas average

Texas average: 0.8%

Lost Too Much Weight Info Percent of long-stay residents who lose too much weight 3.2%
7% better than Texas average

Texas average: 3.5%

Depressive Symptoms Info Percent of long-stay residents who have depressive symptoms 0.0%
100% better than Texas average

Texas average: 2.9%

Antipsychotic Use Info Percent of long-stay residents who received an antipsychotic medication 1.6%
80% better than Texas average

Texas average: 7.9%

Pneumococcal Vaccine Info Percent of long-stay residents assessed and appropriately given the pneumococcal vaccine 100.0%
In line with Texas average

Texas average: 97.3%

Influenza Vaccine Info Percent of long-stay residents assessed and appropriately given the seasonal influenza vaccine 100.0%
In line with Texas average

Texas average: 97.9%

Short-stay resident measures
Pneumococcal Vaccine Info Percent of short-stay residents assessed and appropriately given the pneumococcal vaccine 100.0%
11% better than Texas average

Texas average: 90.4%

Antipsychotic medication increase Info Percent of short-stay residents who newly received an antipsychotic medication 0.0%
100% better than Texas average

Texas average: 1.4%

Influenza Vaccine Info Percent of short-stay residents assessed and appropriately given the seasonal influenza vaccine 97.0%
10% better than Texas average

Texas average: 88.0%

Breakdown by payment type

Medicare

37% of new residents, usually for short-term rehab.

Typical stay 1 - 2 months

Private pay

35% of new residents, often for short stays.

Typical stay 3 - 4 months

Medicaid

28% of new residents, often for long-term daily care.

Typical stay 8 - 9 months

Facility Characteristics

Source: CMS Long-Term Care Facility Characteristics (Data as of Jan 2026)

Total residents 92
Medicare
10
10.9% of residents
Medicaid
51
55.4% of residents
Private pay or other
31
33.7% of residents
Programs & Services
Residents Group

Residents meet regularly to discuss policies, care quality, and activities

Active Resident Council

Organized group of residents that meets regularly to discuss facility policies, quality of life, and activities.

Finances and operations

Governmental community
Operated by state authorities.
Home revenue
$10.5M
Operating deficit
-$431.4K
Governmental community Operated by state authorities.
Home revenue
$10.5M Rank #160 / 297Revenue — State benchmarkedThis home is ranked 160th out of 297 homes in Texas. Shows this facility's annual revenue compared to the Texas SNF average. Higher revenue generally means more resources for staffing and capital — read alongside Payroll %.Click the rank badge to see the full State ranking.Click here to see the full State ranking.
Operating deficit
-$431.4K
Payroll costs Info The portion of the home's budget spent on staff, including nurses, caregivers, and other employees who support care and operations. Rank #103 / 297Payroll — State benchmarkedThis home is ranked 103rd out of 297 homes in Texas. Shows total annual staff payroll benchmarked to the Texas average. Higher payroll investment relative to peers often signals better staffing and less reliance on cheaper contract labor.Click the rank badge to see the full State ranking.Click here to see the full State ranking.
$5.9M
56.5% of revenue Rank #53 / 297Payroll % — State benchmarkedThis home is ranked 53rd out of 297 homes in Texas. Shows payroll as a percentage of revenue versus the Texas average. Well-run Texas SNFs typically land around 51–63% — the top third Statewide. Below 25% may signal understaffing or heavy agency use — read with Staffing ratings.Click the rank badge to see the full State ranking.Click here to see the full State ranking.
Other operating costs Info All remaining costs needed to run the home, such as food, utilities, building maintenance, supplies and administrative expenses.
$4.6M
Total costs $10.5M

What does this home offer?

Housing options icon

Housing Options: Studio / 1 Bed / 2 Bed

Building type icon
Building type icon

Building Type: Mid-rise

Transportation services icon

Transportation Services

Fitness and recreation icon

Fitness and Recreation

Who this home usually serves

TYPE OF STAY

Mostly short-term rehab stays

Most residents typically stay for a few weeks or months before returning home or moving on.

Living Spaces & Floor Plans for Heritage Place Independent Living

Independent Living Tribute One Bedroom Deluxe
Independent Living Tradition Bay Studio
Independent Living Legacy Two Bedroom Deluxe

Places of interest near Heritage Place Independent Living

Address 14.5 miles from city center Info Estimated distance in miles from Burleson's city center to Heritage Place Independent Living's address, calculated via Google Maps.

Calculate Travel Distance to Heritage Place Independent Living

Add your location

Address

Financial Assistance for
Nursing Home in Texas

Heritage Place Independent Living is located in Burleson, Texas.
Here are the financial assistance programs available to residents in Texas.

Get Financial aid guidance

Community Care for the Aged and Disabled (CCAD)

TX Medicaid CCAD

Age 65+ or disabled
General Texas resident, Medicaid-eligible, care need (not always nursing home level).
Income Limits (2025) ~$2,829/month 300% FBR, individual
Asset Limits $2,000 (individual), $3,000 (couple).
TX

Large state; rural access challenges.

Benefits
Personal care (5-7 hours/day) Respite (240 hours/year) Adult day care (~$60/day) Home aides

Texas Community Care Services

TX CCS

Age 60+
General Texas resident, at risk of decline.
Income Limits ~$2,000/month individual, varies
Asset Limits $5,000 individual
TX

Limited funding; high demand in urban areas.

Benefits
In-home care (3-5 hours/week) Respite (up to 10 days/year) Transportation (~5 trips/month)

Area Agency on Aging (AAA) Services

Texas AAA Services

Age 60+
General TX resident; no income/asset limits.
Income Limits (2025) None; donations encouraged.
Asset Limits Not assessed.
TX

28 AAAs; includes Meals on Wheels in some areas.

Benefits
Meals (~$5-$7/meal) Transportation Homemaker services (~4 hours/week) Respite (~5 days/year) Legal aid

Medicare Savings Program (MSP)

Texas Medicare Savings Program

Age 65+ or disabled
General TX resident, Medicare Part A/B.
Income Limits (2025) ~$2,510/month (QMB), ~$3,380/month (SLMB), ~$3,598/month (QI)—individual.
Asset Limits $9,430 (individual), $14,130 (couple).
TX

Includes Extra Help for Part D; no waitlist.

Benefits
Covers Part B premiums ($174.70/month) Deductibles ($240/year) Copays (~20%)

Family Caregiver Support Program (FCSP)

Texas Family Caregiver Support Program

Age
General Caregivers of 60+ needing care or 55+ caregivers of others; TX resident; 2+ ADLs.
Income Limits (2025) No strict cap; prioritizes low-income ~$24,980/year
Asset Limits Not assessed.
TX

High rural demand; includes grandparent caregivers.

Benefits
Respite (4-6 hours/week or 5 days/year) Adult day care ($60/day) Training Supplies (~$500/year)

VA Aid and Attendance (A&A) and Housebound Benefits

Texas VA Aid and Attendance/Housebound

Age 65+ or disabled veteran/spouse
General TX resident, wartime service, ADL help (A&A) or homebound.
Income Limits (2025) Net income < ~$1,984/month (veteran with dependent, A&A); pension offsets income.
Asset Limits ~$155,356 net worth
TX

High veteran population; supports rural/urban needs.

Benefits
Cash (~$1,433-$2,642/month veteran, ~$951-$1,318 spouse) for care costs

Property Tax Exemption for Seniors

Texas Senior Property Tax Exemption

Age 65+
General TX resident, homeowner (homestead).
Income Limits (2025) None; tax-based eligibility.
Asset Limits Not assessed.
TX

$25,000+ exemption; optional freeze in some counties; saves ~$500-$1,000/year.

Benefits
Tax exemption or freeze (~$500-$1,000/year savings)

Senior Farmers’ Market Nutrition Program (SFMNP)

Texas SFMNP

Age 60+
General TX resident, low-income.
Income Limits (2025) ~$2,322/month 185% FPL
Asset Limits Not assessed.
TX

Vouchers (~$50/season); serves ~20,000 via 28 AAAs.

Benefits
Vouchers (~$50/season) for produce at farmers’ markets

Frequently Asked Questions about Heritage Place Independent Living

What neighborhood is Heritage Place Independent Living in?

Heritage Place Independent Living is in the Oak Grove neighborhood.

Is Heritage Place Independent Living in a walkable area?

Heritage Place Independent Living has a walk score of 25. Somewhat walkable. A few nearby services may be reachable on foot, but most trips require transportation.

Does Heritage Place Independent Living have different floorplan options?

Yes — see the floorplan options available at Heritage Place Independent Living on this page.

What is the phone number of Heritage Place Independent Living?

(817) 409-8158 will put you in contact with the team at Heritage Place Independent Living.

Is Heritage Place Independent Living Medicare or Medicaid certified?

Yes — Heritage Place Independent Living is a CMS-certified provider of Medicare and Medicaid.

Guides for Better Senior Living

Care Cost Calculator: See Prices in Your Area

Nursing Home Data Explorer

Don’t Wait Too Long: 7 Red Flag Signs Your Parent Needs Assisted Living Now

The True Cost of Assisted Living in 2025 – And How Families Are Paying For It

Understanding Senior Living Costs: Pricing Models, Discounts & Financial Assistance

Explore Open Rooms
1 Contact details
2 What type of senior care service are you looking for?
3 What budget do you have in mind for senior care?
4 How soon do you need to find care?
5 Additional details

Thank you for your interest!

Our team will be in touch shortly to help with next steps.