• Home
  • Nursing Home in Florida
Highland Place
Nursing Home, Assisted Living & Respite Care · Inverness, FL
CMS overall rating Info CMS (the Centers for Medicare & Medicaid Services) is the federal agency that rates nursing home quality. Its Overall Rating runs from 1 to 5 stars, combining health inspections, staffing, and quality measures, with inspections weighted most heavily.

Highland Place

Nursing Home, Assisted Living & Respite Care · Inverness, FL
CMS overall rating Info CMS (the Centers for Medicare & Medicaid Services) is the federal agency that rates nursing home quality. Its Overall Rating runs from 1 to 5 stars, combining health inspections, staffing, and quality measures, with inspections weighted most heavily.
Calculator: See prices in your area
Highland Place accepts Medicare, Medicaid, and private pay.

Overview of Highland Place

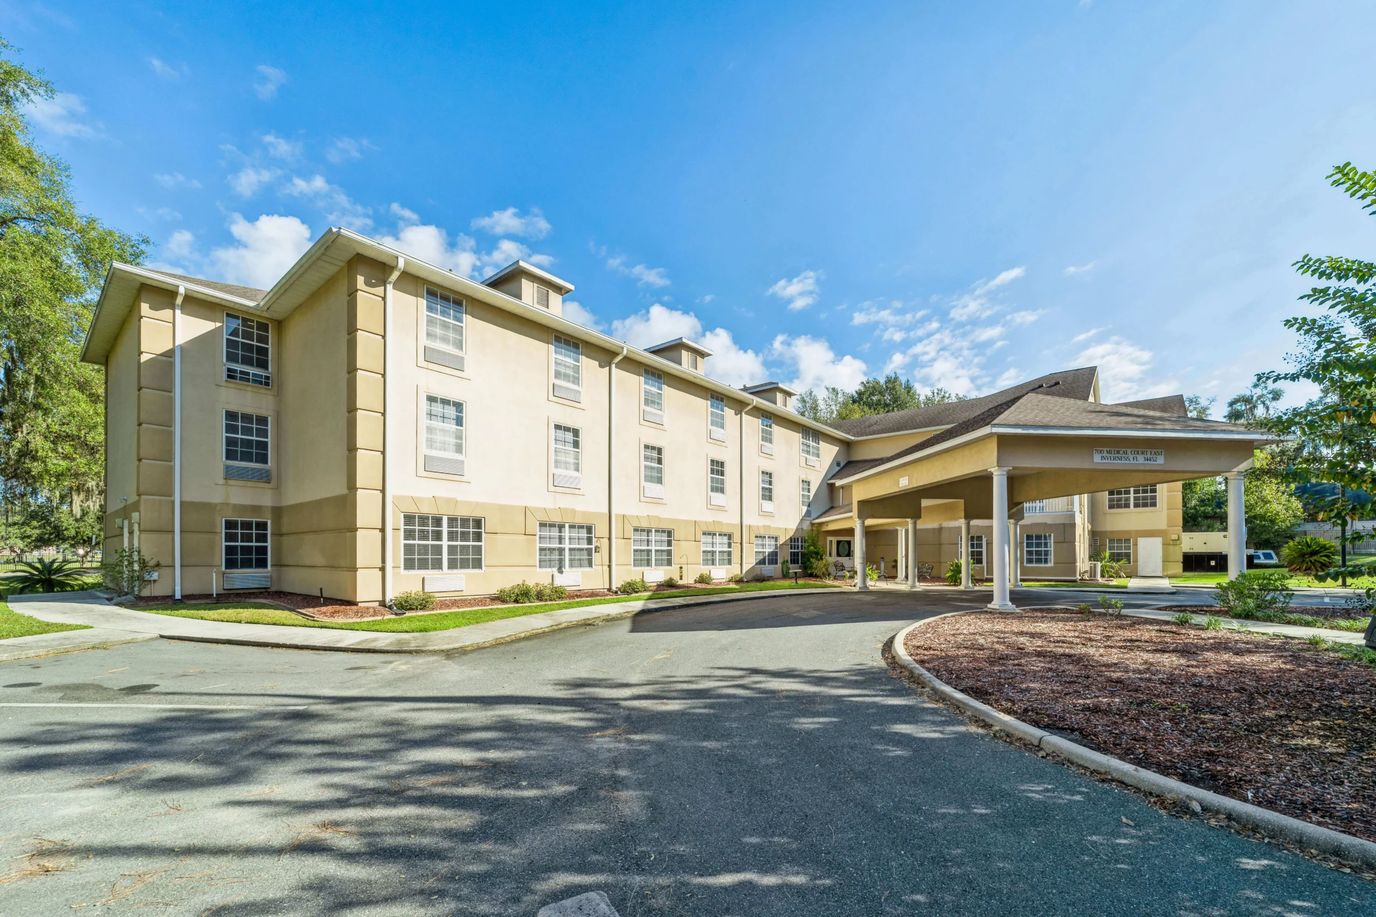
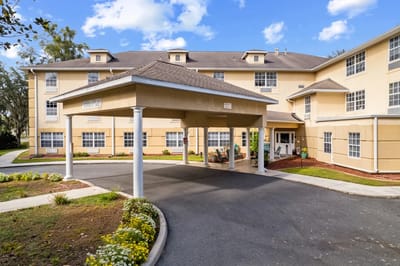
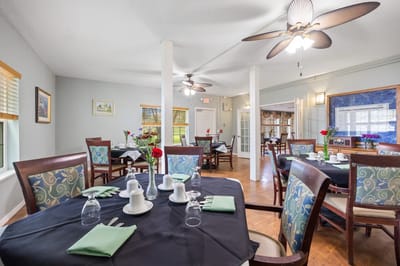
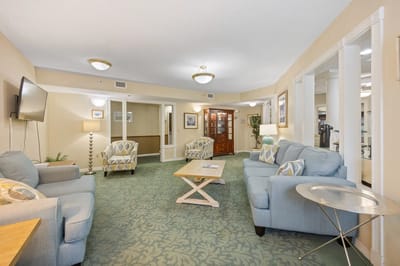
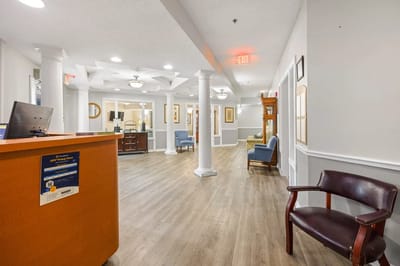
Highland Place is an assisted living home where nothing beats its elegance and luxury in Inverness. The vibrant community performs nothing less than exceptional service offered by its professional and compassionate staff, who are committed to providing abundant support for a stress-free lifestyle for its residents. One of the trusted assisted living homes in Florida created an environment that nurtures seniors to thrive in a cozy, home-like atmosphere.

The lifestyle at Highland Place is all about satisfying the wellness of each senior; their personalized care plans include essential amenities and services, such as scheduled doctor appointments, planned outings, transportation, furnished bedrooms, pet programs, and maintenance services.
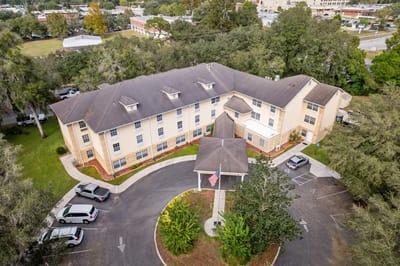
Quality ratings

Measured by Centers for Medicare & Medicaid Services (CMS)

Overall rating Info The Overall CMS Rating combines results from health inspections, staffing levels and quality measures. Health inspections carry the most weight. Staffing and quality scores can increase or decrease the final rating based on performance compared to state and national standards.
Health Inspection Info Based on the results of the facility's three most recent standard inspections and any complaint investigations. CMS reviews the number, scope, and severity of deficiencies, with more recent findings weighted more heavily.
Staffing Info Measures average nursing staff hours per resident per day, including Registered Nurses (RNs) and total nursing staff. Ratings are adjusted based on the level of care residents require and are compared to state and national benchmarks.
Quality Measures Info Based on clinical and physical health indicators reported to CMS, such as hospital readmissions, falls, pressure ulcers, and improvements in mobility. These measures reflect how well residents' health needs are being managed.

Staffing hours breakdown

Info Daily nursing hours per resident by staff type, reported to CMS. Higher is generally better — compare this facility to state and national averages to see where staffing stands.

Hours per resident per day — compared to state averages

Total nursing care / resident Info Total adjusted nursing hours per resident per day, combining RN, LPN, and aide time. CMS adjusts this for case-mix so facilities can be fairly compared.
3h 54m per day
Rank #126 / 253Nurse hours — State benchmarkedThis home is ranked 126th out of 253 homes in Florida. Shows adjusted nurse hours per resident per day benchmarked to the Florida average, with a ranking across 253 Florida facilities. More hours mean more direct care. The national average is about 3.5 hrs; below 3.0 is a red flag.Rankings are based only on facilities in Florida that report data for that category. Facilities without available data are excluded from the ranking.Click the rank badge to see the full State ranking.Click here to see the full State ranking.
vs avg
Staff typeHours / Day / Residentvs state avg
Registered Nurse (RN) Info RNs hold the highest nursing license and can assess residents, interpret test results, and direct care plans. More RN hours per day often signals stronger clinical oversight and faster response to health changes. 25m per day
LPN / LVN Info Licensed Practical Nurses (LPNs) or Licensed Vocational Nurses (LVNs) deliver routine hands-on care — medication administration, wound dressing, and monitoring vital signs. They work under RN supervision and make up a large share of daily bedside care. 56m per day
Nurse Aide Info Certified Nurse Aides (CNAs) provide the most direct day-to-day assistance: bathing, dressing, feeding, and mobility. Nurse aide hours are typically the largest staffing category and directly affect residents' quality of life. 2h 22m per day
Weekend Total Nursing Info Combined nursing hours (RN + LPN + Nurse Aide) per resident per day on weekends. Staffing often drops on weekends — this figure reveals whether the facility maintains adequate coverage outside of weekday hours. 3h 22m per day
Physical Therapist Info Hours per resident per day provided by licensed Physical Therapists (PTs) or PT Assistants. PT services help residents recover mobility after injury or illness and are especially important for post-acute (short-stay) rehabilitation. 5m per day
Weekend RN Info Registered nurse hours specifically on weekends. Facilities sometimes reduce RN presence on Saturdays and Sundays — a low weekend RN figure compared to weekday hours can indicate reduced clinical oversight when most administrative staff are absent. 8m per day

Capacity and availability

Avg. Length of Stay
86 days
Bed community size
48-bed community Rank #787 / 1074Bed count — State benchmarkedThis home is ranked 787th out of 1074 homes in Florida. Shows this facility's certified or reported bed count compared to other Florida facilities. Larger communities may offer more amenities, programs, and on-site services for residents and families.Rankings are based only on facilities in Florida that report data for that category. Facilities without available data are excluded from the ranking.Click the rank badge to see the full State ranking.Click here to see the full State ranking.
A moderately sized community that may balance personal attention with shared amenities and social activities.
Walk Score
Walk Score: 21 / 100 Rank #1066 / 1486Walk Score — State benchmarkedThis home is ranked 1066th out of 1486 homes in Florida. Shows how walkable this facility's neighborhood is compared to the average Walk Score across Florida facilities. Higher scores benefit residents, families, and staff.Rankings are based only on facilities in Florida that report data for that category. Facilities without available data are excluded from the ranking.Click the rank badge to see the full State ranking.Click here to see the full State ranking.
Car-dependent. Most errands require a car, with limited nearby walkable options.

About this community

Occupancy

Occupancy rate
91%
Rank #108 / 258Occupancy rate — State benchmarkedThis home is ranked 108th out of 258 homes in Florida. Shows this facility's occupancy rate versus the Florida average, with its Statewide rank out of 258. Higher occupancy signals strong local demand and financial stability.Rankings are based only on facilities in Florida that report data for that category. Facilities without available data are excluded from the ranking.Click the rank badge to see the full State ranking.Click here to see the full State ranking.
Higher than the Florida average: 84.3%
Occupied beds
43 / 48
Average occupied beds in Florida homes 108 beds

License Details

Facility TypeAssisted Living Facility
StatusLicensed
IssuanceOctober 9, 2025
ExpirationAugust 10, 2027
CountyCitrus
License Number8991

Ownership & Operating Entity

Highland Place is legally operated by Highland Terrace Aid Opco Llc, and administered by Jennifer Stafford.

Management CompanyAMERICAN TRUST SENIOR CARE LLC.
Profit StatusFor-profit

Type Of Units

Private
48 units
Total beds
48 units

Staffing

Key information about the people who lead and staff this community.

Contact Highland Place

Inspection History

In Florida, the Agency for Health Care Administration (AHCA) is the primary authority that conducts unannounced inspections and completes official health quality reports for all healthcare facilities.

Since 2012 · 14 years of data 27 citations 26 inspections 7 fines $25.5K fined
Inspection Score Info A composite 0–100 score combining this facility's inspections, citations, complaints, and enforcement actions relative to the Florida state average. The score below shows how many points this facility sits above or below the typical Florida assisted living residence score (the benchmark); higher is better.

10 points below the Florida average for assisted living residences (83/100)

Rank #692 / 876 in Florida Inspection Score — State benchmarked This home is ranked 692nd out of 876 homes in Florida. Shows this facility's inspection score compared to the Florida average among 876 comparable communities in the ranking pool. Rankings are based only on facilities in Florida that report data for that category. Facilities without available data are excluded from the ranking. Inspection score: 73 out of 100. Letter grade C. 10 points below the Florida average for assisted living residences (83/100)

Inspection Scorecard Info This scorecard compares key inspection, citation, and complaint metrics at this facility against the Florida state average. Metrics rated ≥15% worse than average are highlighted in red; those ≥15% better are highlighted in green.

Since 2012 vs. Florida state average
Overall vs. FL average 0 Worse No metrics in this bucket. 1 At Avg Metrics at Florida average:
• Total inspections (at FL avg)
5 Better Metrics better than Florida average:
• Total citations (18% below)
• Citations per year (21% below)
• Citations per inspection (23% below)
• Inspections with citations (6% below)
• Inspection citation rate (6% below)
Latest Inspection December 4, 2024 Complaint

Citations Info Citations are formal regulatory issues recorded during state inspections.

This FacilityFL Averagevs. FL Avg
Total citations Info Formal regulatory issues recorded by inspectors across all inspection types. 2733 This facility has 18% fewer total citations than a typical Florida assisted living residence (27 vs. FL avg 33).↓ 18% better Rank #429 / 919 Total citations — State benchmarked This home is ranked 429th out of 919 homes in Florida. Shows this facility's total citations compared to the Florida average among 919 comparable communities in the ranking pool. Rankings are based only on facilities in Florida that report data for that category. Facilities without available data are excluded from the ranking.
Citations per year Info Average citations per year since 2012. 1.92.4 This facility has 21% fewer citations per year than a typical Florida assisted living residence (1.9 vs. FL avg 2.4).↓ 21% better
Citations per inspection Info Average citations per inspection. 11.3 This facility has 23% fewer citations per inspection than a typical Florida assisted living residence (1 vs. FL avg 1.3).↓ 23% better Rank #167 / 919 Citations per inspection — State benchmarked This home is ranked 167th out of 919 homes in Florida. Shows this facility's citations per inspection compared to the Florida average among 919 comparable communities in the ranking pool. Rankings are based only on facilities in Florida that report data for that category. Facilities without available data are excluded from the ranking.

Inspections Info State inspections evaluate whether the facility meets health and safety standards.

This FacilityFL Averagevs. FL Avg
Total inspections Info Combined count of all routine and focused inspections. Excludes complaint investigations. 2626 This facility has total inspections in line with the Florida average (26 vs. FL avg 26).— At avg
Inspections with citations Info Inspections that resulted in at least one regulatory citation. 1516 This facility has 6% fewer inspections with citations than a typical Florida assisted living residence (15 vs. FL avg 16).↓ 6% better
Inspection citation rate Info Percentage of inspections that resulted in at least one citation. 58%62% This facility has 4 percentage points lower inspection citation rate than a typical Florida assisted living residence (58% vs. FL avg 62%).↓ 4% better Rank #491 / 919 Inspection citation rate — State benchmarked This home is ranked 491st out of 919 homes in Florida. Shows this facility's % of inspections with citations compared to the Florida average among 919 comparable communities in the ranking pool. Rankings are based only on facilities in Florida that report data for that category. Facilities without available data are excluded from the ranking.

Inspection Reports Summary Info An editor-reviewed summary of the themes and findings across this facility's recent inspection reports.

  • December 4, 2024 complaint inspection found no deficiencies.
  • March 21, 2024 routine inspection cited one Class 3 deficiency for dietary standards.
  • Past deficiencies included Class 4 citations for background screening compliance and staff training, with multiple issues in admissions, staffing, and resident care from 2012 to 2017.

Health Inspection History

Inspections since 2022
Total health inspections 4

State average N/A


Last Health inspection on May 2025

Total health citations
29 Rank #205 / 252Health citations — State benchmarkedThis home is ranked 205th out of 252 homes in Florida. Shows this facility's total health deficiency citations benchmarked to the Florida State average, with a ranking across all 252 FL facilities. Lower citation counts earn a better rank.Rankings are based only on facilities in Florida that report data for that category. Facilities without available data are excluded from the ranking.Click the rank badge to see the full State ranking.Click here to see the full State ranking.

State average N/A

Citations per inspection
7.25 Rank #224 / 252Citations per inspection — State benchmarkedThis home is ranked 224th out of 252 homes in Florida. Shows average deficiency citations per CMS inspection for this facility versus the Florida mean across 252 facilities with citation data. Lower is better.Rankings are based only on facilities in Florida that report data for that category. Facilities without available data are excluded from the ranking.Click the rank badge to see the full State ranking.Click here to see the full State ranking.

State average N/A


Health citations are formal notices following inspections when they fail to comply with safety and care standards.

27 of 29 citations resulted from standard inspections; 1 of 29 resulted from complaint investigations; and 1 of 29 came from combined inspections (standard and complaint).

Breakdown of citation severity (last 4 years)
Critical health citations
5
In line with State average

State average: N/A


Serious health citations
0
In line with State average

State average: N/A

5 critical citations State average: N/A

0 serious citations State average: N/A

24 moderate citations State average: N/A

0 minor citations State average: N/A
Citations history (last 4 years)
Environmental moderate citation May 15, 2025
Corrected

Infection Control moderate citation May 15, 2025
Corrected

Pharmacy moderate citation May 15, 2025
Corrected

Pharmacy moderate citation May 15, 2025
Corrected

Staffing Data

Reporting period: October 1 – December 31, 2025 (Q4 2025). Source: CMS Payroll-Based Journal report.

Total staff 153
Employees 151
Contractors 2
Staff to resident ratio 1.55 : 1
0% compared with State average

State average ratio: 0 : 0

Avg staff/day 62
Average shift 7.5 hours
0% compared with State average

State average: 0 hours

Total staff hours (quarter) 42,616

Nursing staff breakdown

Q4 2025 · Oct 1 – Dec 31 More info This data comes from the CMS Payroll-Based Journal report covering October 1 – December 31, 2025.
Registered Nurse

Manages medical care and health needs.

RN Staff Info All 13 RN Staff are full-time employees. No contractors work on this role. 13
Average shift length Info Average shift length. Calculated as total hours divided by days worked and average staff per day. 7 hours
Licensed Practical Nurse

Assists with medical care and medications.

LPN Staff Info All 23 LPN Staff are full-time employees. No contractors work on this role. 23
Average shift length Info Average shift length. Calculated as total hours divided by days worked and average staff per day. 7.3 hours
Certified Nursing Assistant

Helps with daily care and mobility.

CNA Staff Info 80 total: 79 full-time employees and 1 contractor. 80
Average shift length Info Average shift length. Calculated as total hours divided by days worked and average staff per day. 7.6 hours

Contractor staffing

Q4 2025 · Oct 1 – Dec 31 More info This data comes from the CMS Payroll-Based Journal report covering October 1 – December 31, 2025.

Total hours from contractors

1.3%

543 contractor hours this quarter

Certified Nursing Assistant: 1 Medical Director: 1

Staff by category

Q4 2025 · Oct 1 – Dec 31 More info This data comes from the CMS Payroll-Based Journal report covering October 1 – December 31, 2025.
Certified Nursing Assistant7918022,69192100%7.6
Licensed Practical Nurse230236,03592100%7.3
RN Director of Nursing7072,96292100%7.4
Registered Nurse130132,4268997%7
Speech Language Pathologist8081,8247379%7.4
Dietitian3031,3728896%7.8
Clinical Nurse Specialist3031,0607582%8.2
Dental Services Staff2029606571%8.1
Respiratory Therapy Technician3037427683%6.6
Physical Therapy Aide4045756874%5.7
Qualified Social Worker2025115661%9
Administrator1014886166%8
Nurse Practitioner1014886166%8
Physical Therapy Assistant2024745762%7.8
Medical Director011933%3
80 Certified Nursing Assistant
% of Days 100%
23 Licensed Practical Nurse
% of Days 100%
7 RN Director of Nursing
% of Days 100%
13 Registered Nurse
% of Days 97%
8 Speech Language Pathologist
% of Days 79%
3 Dietitian
% of Days 96%
3 Clinical Nurse Specialist
% of Days 82%
2 Dental Services Staff
% of Days 71%
3 Respiratory Therapy Technician
% of Days 83%
4 Physical Therapy Aide
% of Days 74%
2 Qualified Social Worker
% of Days 61%
1 Administrator
% of Days 66%
1 Nurse Practitioner
% of Days 66%
2 Physical Therapy Assistant
% of Days 62%
1 Medical Director
% of Days 3%

Penalties and fines

Federal penalties imposed by CMS for regulatory violations, including civil money penalties (fines) and denials of payment for new Medicare/Medicaid admissions.

Source: CMS Penalties Database (Data as of Jan 2026)

Total fines amount $24K Rank #1 / 258Federal fines — State benchmarkedThis home is ranked 1st out of 258 homes in Florida. Shows this facility's cumulative CMS federal fine dollars versus the Florida average among facilities with fines, and where it ranks among 258 facilities in the pool. Lower total dollars mean a better rank.Rankings are based only on facilities in Florida that report data for that category. Facilities without available data are excluded from the ranking.Click the rank badge to see the full State ranking.Click here to see the full State ranking.
67% lower than State average

State average: $72K

Number of fines 1
62% fewer fines than State average

State average: 2.6

Payment Denials Info Serious action where Medicare and/or Medicaid temporarily stops payments for new residents until issues are fixed. 0
100% fewer payment denials than State average

State average: 0.1

Fines amount comparison
This facility $24K
State average $72K

No penalties in the past 3 years

No civil money penalties or payment denials were reported in the last 3 years.

Quality of care over time

These measures show how residents usually do over time at this home, based on health outcomes and preventive care.

High-risk clinical events score Info A composite score based on pressure ulcers, falls with injury, weight loss, walking ability decline, and activities of daily living decline. 7.1
In line with State average

State average: 7.4

Functional decline score Info A composite score based on activities of daily living decline, walking ability decline, and incontinence. 6.8
45% better than State average

State average: 12.4

Long-stay resident measures
Need for Help with Daily Activities Increased Info Percent of long-stay residents whose need for help with daily activities has increased 6.7%
36% better than State average

State average: 10.5%

Walking Ability Worsened Info Percent of long-stay residents whose ability to move independently worsened 10.5%
19% better than State average

State average: 12.9%

Low Risk Residents with Bowel/Bladder Incontinence Info Percent of low risk long-stay residents who lose control of their bowels or bladder 3.2%
76% better than State average

State average: 13.5%

Falls with Major Injury Info Percent of long-stay residents experiencing one or more falls with major injury 3.0%
13% worse than State average

State average: 2.6%

High Risk Residents with Pressure Ulcers Info Percent of long-stay high risk residents with pressure ulcers 5.5%
In line with State average

State average: 5.4%

Urinary Tract Infection Info Percent of long-stay residents with a urinary tract infection 0.0%
100% better than State average

State average: 0.9%

Lost Too Much Weight Info Percent of long-stay residents who lose too much weight 9.9%
65% worse than State average

State average: 6.0%

Depressive Symptoms Info Percent of long-stay residents who have depressive symptoms 10.7%
219% worse than State average

State average: 3.3%

Antipsychotic Use Info Percent of long-stay residents who received an antipsychotic medication 1.3%
84% better than State average

State average: 8.0%

Pneumococcal Vaccine Info Percent of long-stay residents assessed and appropriately given the pneumococcal vaccine 100.0%
In line with State average

State average: 97.7%

Influenza Vaccine Info Percent of long-stay residents assessed and appropriately given the seasonal influenza vaccine 100.0%
In line with State average

State average: 99.2%

Short-stay resident measures
Pneumococcal Vaccine Info Percent of short-stay residents assessed and appropriately given the pneumococcal vaccine 99.7%
6% better than State average

State average: 94.0%

Antipsychotic medication increase Info Percent of short-stay residents who newly received an antipsychotic medication 1.3%
14% better than State average

State average: 1.5%

Influenza Vaccine Info Percent of short-stay residents assessed and appropriately given the seasonal influenza vaccine 100.0%
6% better than State average

State average: 94.7%

Breakdown by payment type

Medicare

43% of new residents, usually for short-term rehab.

Typical stay 1 - 2 months

Private pay

46% of new residents, often for short stays.

Typical stay 1 - 2 months

Medicaid

11% of new residents, often for long-term daily care.

Typical stay 1 years

Facility Characteristics

Source: CMS Long-Term Care Facility Characteristics (Data as of Jan 2026)

Total residents 99
Medicare
21
21.2% of residents
Medicaid
68
68.7% of residents
Private pay or other
10
10.1% of residents
Programs & Services
Residents Group

Residents meet regularly to discuss policies, care quality, and activities

Active Resident Council

Organized group of residents that meets regularly to discuss facility policies, quality of life, and activities.

Finances and operations

Based on CMS SNF Cost Report for fiscal year ending in 12/2023.

For-profit
Operated by a single business entity.
Net patient revenue Info Net patient revenue — what the home actually collects for resident care, after contractual allowances, bad debt and discounts are subtracted from its gross charges (CMS cost report, Worksheet G-3). It covers resident care only; money the home earns from other sources is shown separately as "Other income."
$13.4M
Net patient income Info Net patient income: net patient revenue minus the home's total operating expenses. A positive figure means it earns more from resident care than it spends to deliver it; a negative figure means the opposite. It excludes non-operating "other income."
$896.4K
For-profit Operated by a single business entity.
Net patient revenue Info Net patient revenue — what the home actually collects for resident care, after contractual allowances, bad debt and discounts are subtracted from its gross charges (CMS cost report, Worksheet G-3). It covers resident care only; money the home earns from other sources is shown separately as "Other income."
$13.4M Rank #74 / 257Revenue — State benchmarkedThis home is ranked 74th out of 257 homes in Florida. Shows this facility's annual revenue compared to the Florida average. Higher revenue generally means more resources for staffing and capital — read alongside Payroll %.Rankings are based only on facilities in Florida that report data for that category. Facilities without available data are excluded from the ranking.Click the rank badge to see the full State ranking.Click here to see the full State ranking.
Net patient income Info Net patient income: net patient revenue minus the home's total operating expenses. A positive figure means it earns more from resident care than it spends to deliver it; a negative figure means the opposite. It excludes non-operating "other income."
$896.4K
Other income Info Money the home earns outside of resident care — such as investments, grants, rentals and other non-operating sources (CMS cost report, Worksheet G-3). It is tracked separately from net patient revenue: it is not part of that figure, and it is not included in net patient income.
-$4.4K
Payroll costs Info Staff salaries plus wage-related costs — benefits such as payroll taxes, health insurance and retirement — from the home's own accounting records (CMS cost report, Worksheet A). Contract or agency labor is counted separately, under other operating costs. Rank #194 / 257Payroll — State benchmarkedThis home is ranked 194th out of 257 homes in Florida. Shows total annual staff payroll benchmarked to the Florida average. Higher payroll investment relative to peers often signals better staffing and less reliance on cheaper contract labor.Rankings are based only on facilities in Florida that report data for that category. Facilities without available data are excluded from the ranking.Click the rank badge to see the full State ranking.Click here to see the full State ranking.
$6.1M 45.2% of net patient revenue Info Payroll as a share of revenue: staff salaries and wage-related benefits divided by net patient revenue. A higher figure means more of each revenue dollar goes to staff pay. Rank #248 / 257Payroll % — State benchmarkedThis home is ranked 248th out of 257 homes in Florida. Shows payroll as a percentage of revenue versus the Florida average. Well-run Florida facilities typically land around 49–56% — the top third Statewide. Below 25% may signal understaffing or heavy agency use — read with Staffing ratings.Rankings are based only on facilities in Florida that report data for that category. Facilities without available data are excluded from the ranking.Click the rank badge to see the full State ranking.Click here to see the full State ranking.
Other operating costs Info Everything it costs to run the home apart from payroll — food, utilities, supplies, maintenance, contract labor and administration. Calculated as total operating expense minus payroll (staff salaries and wage-related benefits).
$6.5M
Total costs Info The home's total operating expense for the year — all the costs of running it, salaries included (CMS cost report, Worksheet G-3).
$12.5M

What does this home offer?

Pets allowed icon
Pets allowed icon

Pets Allowed

Room sizes icon
Room sizes icon

Room Sizes: 226 / 286 sq. ft

Housing options icon

Housing Options: Studio

Building type icon
Building type icon

Building Type: 3-story

Who this home usually serves

TYPE OF STAY

Mix of rehab and long-term care

This home supports both short-term rehab and long-term care, with residents staying for a wide range of durations.

New residents most often arrive under private pay (46% of admissions), and a typical private pay stay runs around 1 - 2 months.

Admissions
438 total

Coverage residents most often arrive under.

Medicare 43%
Private pay 46%
Medicaid 11%
Discharges
428 total

Coverage residents most often leave under.

Medicare 34%
Private pay 46%
Medicaid 20%

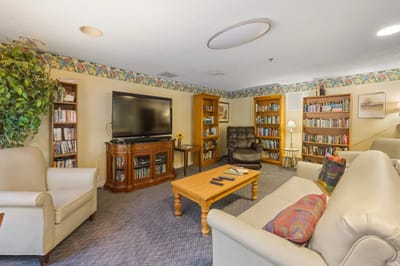
Activities in this home

Places of interest near Highland Place

Address 0.7 miles from city center Info Estimated distance in miles from Inverness's city center to Highland Place's address, calculated via Google Maps. — 0.19 miles to nearest hospital (Citrus Memorial Hospital: Berlow Michael E MD)

Calculate Travel Distance to Highland Place

Add your location

Address

Compare Nursing Homes around the area

The information below is reported by the Florida Agency for Health Care Administration (AHCA).

Highland Place
NH
AL
RC
Inverness -48 - 21 Studio
Westminster Woods on Julington Creek
NH
AL
IL
MC
Fruit Cove (Saint Johns) -80 C- 47 -

Frequently Asked Questions about Highland Place

What languages are spoken at Highland Place?

The team at Highland Place speaks English.

Who is the owner of Highland Place?

Highland Place is legally operated by Highland Terrace Aid Opco Llc, and administered by Jennifer Stafford.

Is Highland Place in a walkable area?

Highland Place has a walk score of 21. Car-dependent. Most errands require a car, with limited nearby walkable options.

What is the license number of Highland Place?

According to FL state health department records, Highland Place's license number is 8991.

When does Highland Place's license expire?

According to FL state health department records, Highland Place's license expires on August 10, 2027.

What is the occupancy rate at Highland Place?

Highland Place's occupancy is 91%.

What payment types does Highland Place accept?

Highland Place accepts Other.

Guides for Better Senior Living

Care Cost Calculator: See Prices in Your Area

Nursing Home Data Explorer

Don’t Wait Too Long: 7 Red Flag Signs Your Parent Needs Assisted Living Now

The True Cost of Assisted Living in 2025 – And How Families Are Paying For It

Understanding Senior Living Costs: Pricing Models, Discounts & Financial Assistance