


Total staff
251
Employees
87
Contractors
164
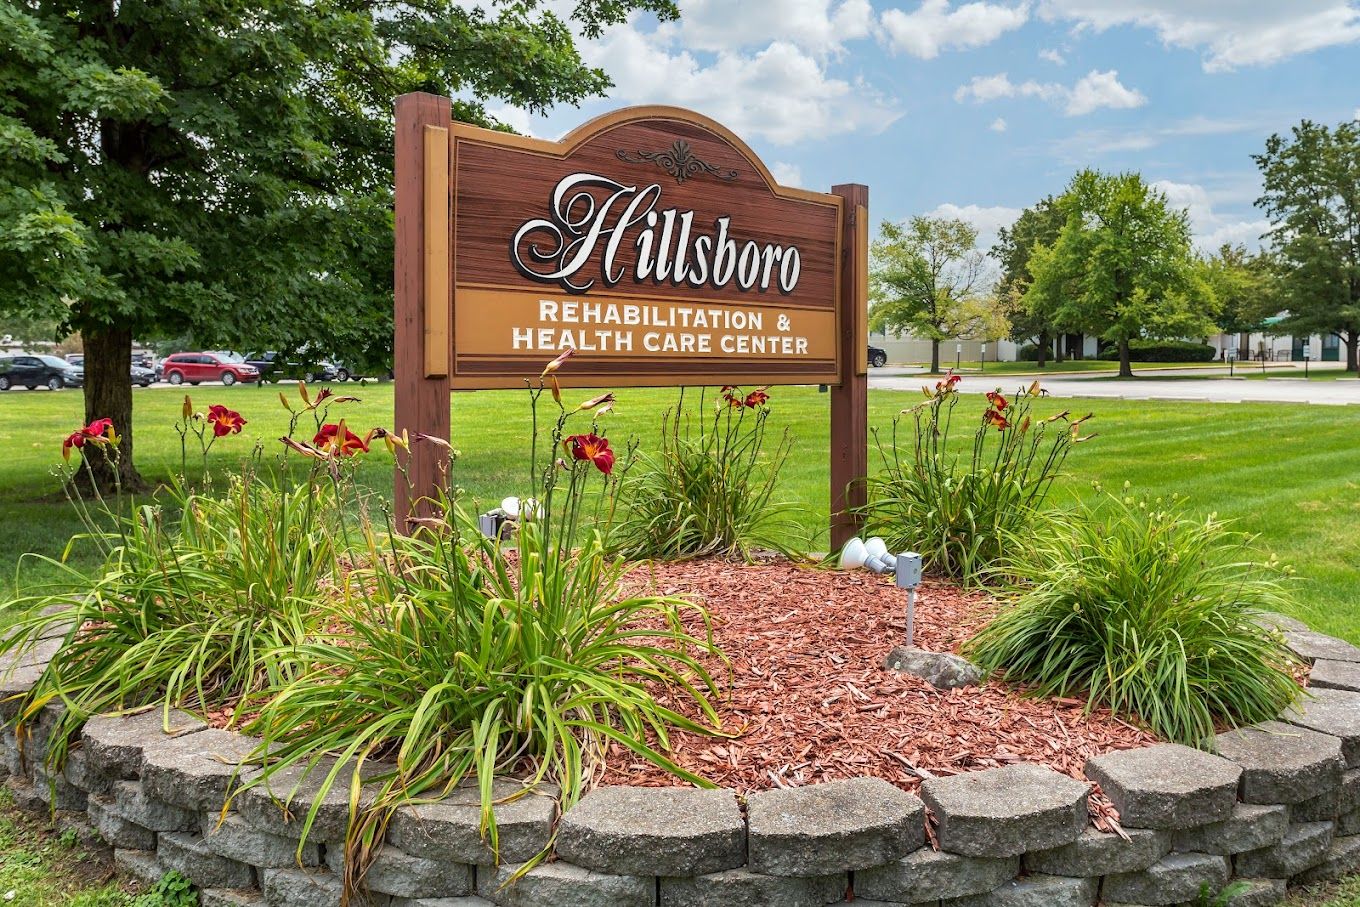
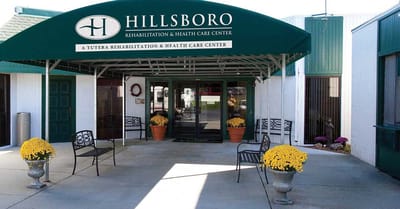


A 121-bed skilled nursing facility at 1300 E Tremont St in Hillsboro, Montgomery County, Illinois, Hillsboro Rehabilitation & Health Care Center primarily serves Medicaid residents needing extended care; typically staying 100 days or longer. The resident census breaks down as 66.3% Medicaid, 20.5% private pay, and 13.3% Medicare; new admissions follow a similar pattern: 42% Medicaid, 29% private pay, 29% Medicare with a 25-day typical stay for short-term rehab.
The facility’s 1-star CMS overall rating reflects across-the-board underperformance. Health inspections earned a 1-star rating, 63.8% below Oregon standards. Staffing, at 2h 50m per resident daily, falls 46% below the state average and ranks the facility 89th of 167 Oregon nursing homes; RN hours run 61% below state benchmarks, a critical gap for clinical oversight. Federal penalties have mounted: five enforcement actions in three years, totaling $318K in fines plus two separate payment denials blocking new Medicare and Medicaid admissions; outcomes that place this facility in the bottom tier of Illinois SNFs.
Emergency department visit rates for long-stay residents run at 4.38 per 1,000 days, nearly double the state average.
Falls with major injury occur at 5.5% in long-stay and 1.7% in short-stay residents, well above state norms.
Vaccination rates lag: pneumococcal compliance sits at 70.8% and influenza at 79.1%, both substantially below state standards.
For short-stay rehabilitation patients, discharge outcomes are notably poor: only 37.0% achieve successful return to home or community (versus 50.6% statewide), and only 39.4% leave with self-care ability at or above expected levels.
The facility maintains a partnership with Aegis Therapies and offers specialized programs including hospice, wound care, dialysis, and TPN for medically complex residents.
Hillsboro Rehabilitation’s extended compliance and outcome record suggests substantial operational and care-delivery challenges.
Long-term Medicaid residents and those with complex medical needs should weigh the documented pattern before placement.
| Staff type | Hours / Day / Resident | vs state avg |
|---|---|---|
|
Registered Nurse (RN)
| 23m per day | ▼ 47% State avg: 44m per day · National avg: 41m per day |
|
LPN / LVN
| 49m per day | ▲ 29% State avg: 38m per day · National avg: 52m per day |
|
Nurse Aide
| 2h 1m per day | ▼ 5% State avg: 2h 8m per day · National avg: 2h 21m per day |
|
Weekend Total Nursing
| 2h 56m per day | ▼ 5% State avg: 3h 5m per day · National avg: 3h 26m per day |
|
Physical Therapist
| 1m per day | ▼ 79% State avg: 3m per day · National avg: 4m per day |
|
Weekend RN
| 20m per day | ▼ 42% State avg: 34m per day · National avg: 29m per day |
Reporting period: October 1 – December 31, 2025 (Q4 2025). Source: CMS Payroll-Based Journal report.
Manages medical care and health needs.
Assists with medical care and medications.
Helps with daily care and mobility.
Total hours from contractors
7,759 contractor hours this quarter
| Certified Nursing Assistant | 44 | 84 | 128 | 15,224 | 92 | 100% | 8.9 |
| Licensed Practical Nurse | 22 | 29 | 51 | 5,663 | 92 | 100% | 9.2 |
| Registered Nurse | 6 | 30 | 36 | 2,492 | 92 | 100% | 8 |
| Other Dietary Services Staff | 9 | 0 | 9 | 1,428 | 92 | 100% | 7.3 |
| Speech Language Pathologist | 0 | 4 | 4 | 755 | 70 | 76% | 6 |
| Physical Therapy Aide | 0 | 2 | 2 | 679 | 73 | 79% | 5.3 |
| Administrator | 2 | 0 | 2 | 508 | 64 | 70% | 7.9 |
| RN Director of Nursing | 1 | 0 | 1 | 484 | 62 | 67% | 7.8 |
| Dental Services Staff | 1 | 0 | 1 | 470 | 60 | 65% | 7.8 |
| Nurse Practitioner | 0 | 4 | 4 | 440 | 55 | 60% | 7.7 |
| Mental Health Service Worker | 2 | 0 | 2 | 357 | 45 | 49% | 7.9 |
| Qualified Social Worker | 0 | 2 | 2 | 192 | 62 | 67% | 3.1 |
| Physical Therapy Assistant | 0 | 4 | 4 | 149 | 42 | 46% | 3.2 |
| Respiratory Therapy Technician | 0 | 1 | 1 | 81 | 29 | 32% | 2.8 |
| Occupational Therapy Aide | 0 | 2 | 2 | 46 | 24 | 26% | 1.9 |
| Medical Director | 0 | 2 | 2 | 21 | 9 | 10% | 2.3 |
Includes penalties issued in 2023-2024
Federal penalties imposed by CMS for regulatory violations, including civil money penalties (fines) and denials of payment for new Medicare/Medicaid admissions.
Source: CMS Penalties Database (Data as of Jan 2026)
Oregon average: $143K
Oregon average: 3.0
Oregon average: 1.1
Penalties are imposed by CMS for violations of federal nursing home regulations.
4 penalties in the past 3 years
Multiple penalties were reported in the last 3 years.
Last updated: Jan 2026
These measures show how residents usually do over time at this home, based on health outcomes and preventive care.
Oregon average: 9.7
Oregon average: 18.6
Oregon average: 15.5%
Oregon average: 18.4%
Oregon average: 21.6%
Oregon average: 3.4%
Oregon average: 5.3%
Oregon average: 1.8%
Oregon average: 6.5%
Oregon average: 48.1%
Oregon average: 20.2%
Oregon average: 89.2%
Oregon average: 91.6%
Oregon average: 2.05
Oregon average: 2.25
Oregon average: 68.3%
Oregon average: 2.3%
Oregon average: 63.0%
Oregon average: 26.2%
Oregon average: 14.0%
Oregon average: 0.8%
Oregon average: 53.7%
Oregon average: 50.6%
Quality measures are calculated from Minimum Data Set (MDS) assessments. For most measures, lower percentages indicate better care quality.
29% of new residents, usually for short-term rehab.
29% of new residents, often for short stays.
42% of new residents, often for long-term daily care.
Source: CMS Long-Term Care Facility Characteristics (Data as of Jan 2026)
Residents meet regularly to discuss policies, care quality, and activities
Organized group of residents that meets regularly to discuss facility policies, quality of life, and activities.
Data sourced from CMS Long-Term Care Facility Characteristics quarterly report. Payer mix reflects the current resident census by primary payment source.
Historical financial and operational data for Hillsboro Rehabilitation & Health Care Center from 2011–2023, based on CMS SNF Cost Reports.
Key figures below are for fiscal year ending in 12/2023.
Based on CMS SNF Cost Report for fiscal year ending in 12/2023.
Pets Allowed
Most residents stay for extended periods and receive ongoing daily care.
New residents most often arrive under Medicaid (42% of admissions), and a typical Medicaid stay runs around 4 - 5 months.
Coverage residents most often arrive under.
Coverage residents most often leave under.
![]() 1300 E Tremont St, Hillsboro, IL 62049
1300 E Tremont St, Hillsboro, IL 62049
Add your location
Info below is compiled from CMS reports & the OR Dept. of Human Services (ODHS), senior community websites & trusted data sources such as Walk Score & BBB.
Communities are listed from highest to lowest based on our ranking methodology.
| EmpRes Hillsboro Health and Rehabilitation Center | NH MC RC SNF | Hillsboro (Northeast Cornell Road) | 78
Facility
78
OR AVG
67
Rank
#114 / 351 |
73.6%
Facility
73.6%
OR AVG
73.5
Rank
#38 / 70 | 0% | 5.28
Facility
5.28
OR AVG
5.24
Rank
#34 / 84 | +3% | +1% | $0
Facility
$0
OR AVG
$62.3k
Rank
#1 / 85 | 28
Facility
28
OR AVG
34.0
Rank
#30 / 79 | 4.7
Facility
4.7
OR AVG
6.9
Rank
#23 / 79 | - | 57 | - |
75
Facility
75
OR AVG
55
Rank
#119 / 475 | Hillsboro Snf Operations, LLC | $7.1M*Fiscal year ending 12/2022These figures are from this home's most recent complete cost report — an older period than most facilities report. Compare with that in mind.
Facility
$7.1M*Fiscal year ending 12/2022These figures are from this home's most recent complete cost report — an older period than most facilities report. Compare with that in mind.
OR AVG
$12.6M
Rank
#73 / 80 | $3.6M*Fiscal year ending 12/2022These figures are from this home's most recent complete cost report — an older period than most facilities report. Compare with that in mind.
Facility
$3.6M*Fiscal year ending 12/2022These figures are from this home's most recent complete cost report — an older period than most facilities report. Compare with that in mind.
OR AVG
$4.5M
Rank
#52 / 80 | 50.3%*Fiscal year ending 12/2022These figures are from this home's most recent complete cost report — an older period than most facilities report. Compare with that in mind.
Facility
50.3%*Fiscal year ending 12/2022These figures are from this home's most recent complete cost report — an older period than most facilities report. Compare with that in mind.
OR AVG
38%
Rank
#4 / 80 | 385217 | ||||
| Forest Grove Rehabilitation and Care Center | NH PC SNF | Forest Grove | 114
Facility
114
OR AVG
67
Rank
#32 / 351 |
72.3%
Facility
72.3%
OR AVG
73.5
Rank
#41 / 70 | -2% | 4.71
Facility
4.71
OR AVG
5.24
Rank
#65 / 84 | -2% | -10% | $0
Facility
$0
OR AVG
$62.3k
Rank
#1 / 85 | 21
Facility
21
OR AVG
34.0
Rank
#22 / 79 | 4.2
Facility
4.2
OR AVG
6.9
Rank
#15 / 79 | 4 | 82 | - |
44
Facility
44
OR AVG
55
Rank
#320 / 475 | - | $14.1MFiscal year ending 12/2023
Facility
$14.1MFiscal year ending 12/2023
OR AVG
$12.6M
Rank
#14 / 80 | $6.9MFiscal year ending 12/2023
Facility
$6.9MFiscal year ending 12/2023
OR AVG
$4.5M
Rank
#20 / 80 | 49%Fiscal year ending 12/2023
Facility
49%Fiscal year ending 12/2023
OR AVG
38%
Rank
#73 / 80 | 385155 | ||||
| Hillsboro Rehabilitation & Health Care Center | NH MC | Hillsboro (Springfield Lake Shore Improvement) | 121 | 67.7% | -7% | 2.83 | +1% | -9% | $317.9k | 79 | 3.8 | 17 | 82 | - | 2 | - | $6.8MFiscal year ending 12/2023 | $3.3MFiscal year ending 12/2023 | 48.2%Fiscal year ending 12/2023 | 145500 |
Hillsboro Rehabilitation & Health Care Center is located in Hillsboro, Oregon.
Here are the financial assistance programs available to residents in Oregon.
Hillsboro Rehabilitation & Health Care Center is in the Springfield Lake Shore Improvement neighborhood.
Hillsboro Rehabilitation & Health Care Center has a walk score of 2. Car-dependent. Most errands require a car, with limited nearby walkable options.
Hillsboro Rehabilitation & Health Care Center's occupancy is 66.4%.
Yes, Hillsboro Rehabilitation & Health Care Center allows residents to bring their pets.
Hillsboro Rehabilitation & Health Care Center is registered as a for-profit.
Yes — there are 19 photos of Hillsboro Rehabilitation & Health Care Center in the photo gallery on this page.
Hillsboro Rehabilitation & Health Care Center is located at 1300 E Tremont St, Hillsboro, IL 62049.
Care Cost Calculator: See Prices in Your Area
Nursing Home Data Explorer
Don’t Wait Too Long: 7 Red Flag Signs Your Parent Needs Assisted Living Now
The True Cost of Assisted Living in 2025 – And How Families Are Paying For It
Understanding Senior Living Costs: Pricing Models, Discounts & Financial Assistance


