Forest Grove Rehabilitation and Care Center

Nursing Home in Hillsboro

CMS overall rating Info The Overall CMS Rating is scored from 1 to 5 stars and combines results from health inspections, staffing levels, and quality measures. Health inspections carry the most weight. Staffing and quality scores can increase or decrease the final rating based on performance compared to state and national standards.

Overview of Forest Grove Rehabilitation and Care Center

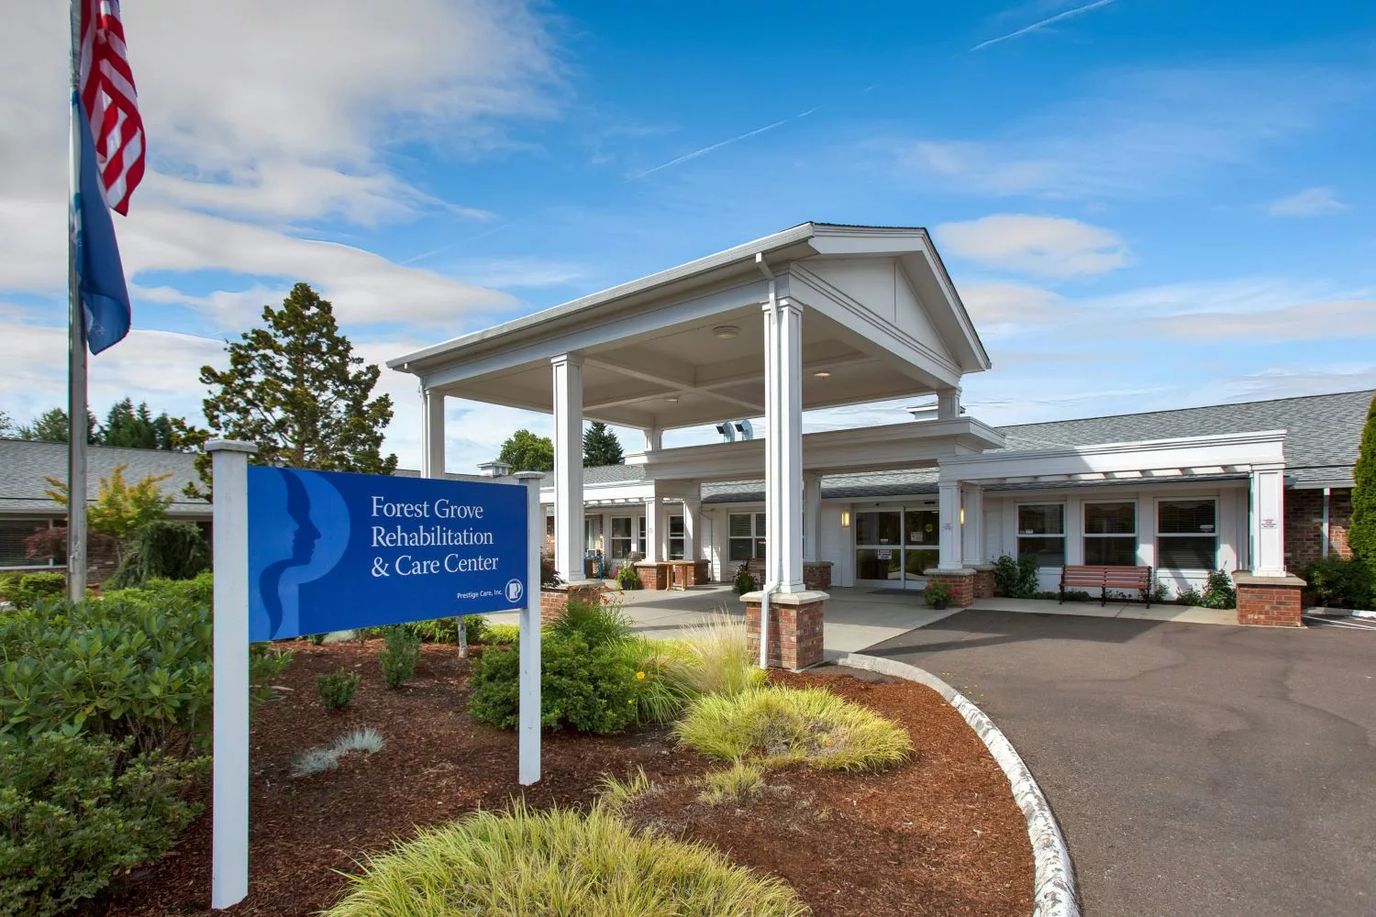
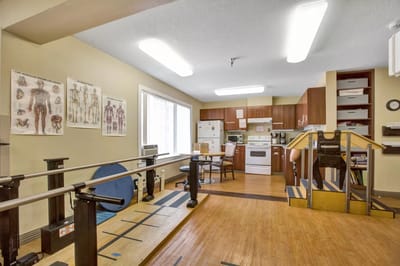
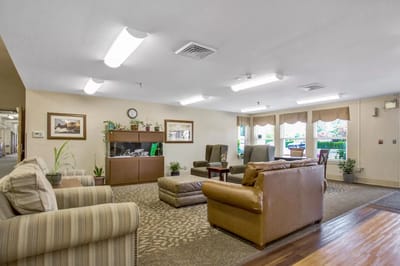
Conveniently nestled 25 miles west of Portland, Forest Grove Rehabilitation and Care Center is an assisted living community serving both the vibrant metro and serene coastal communities. Renowned for its commitment to excellence, the center specializes in offering top-tier short-term rehabilitation and skilled nursing care.
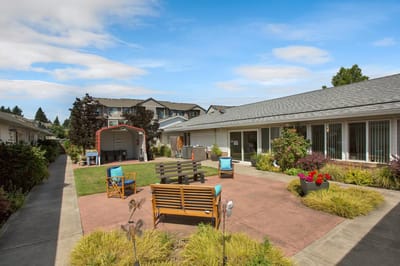
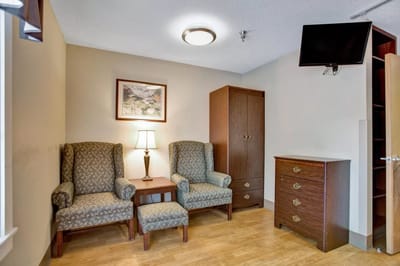
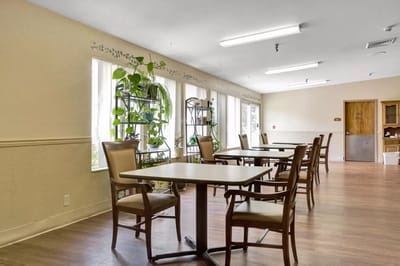
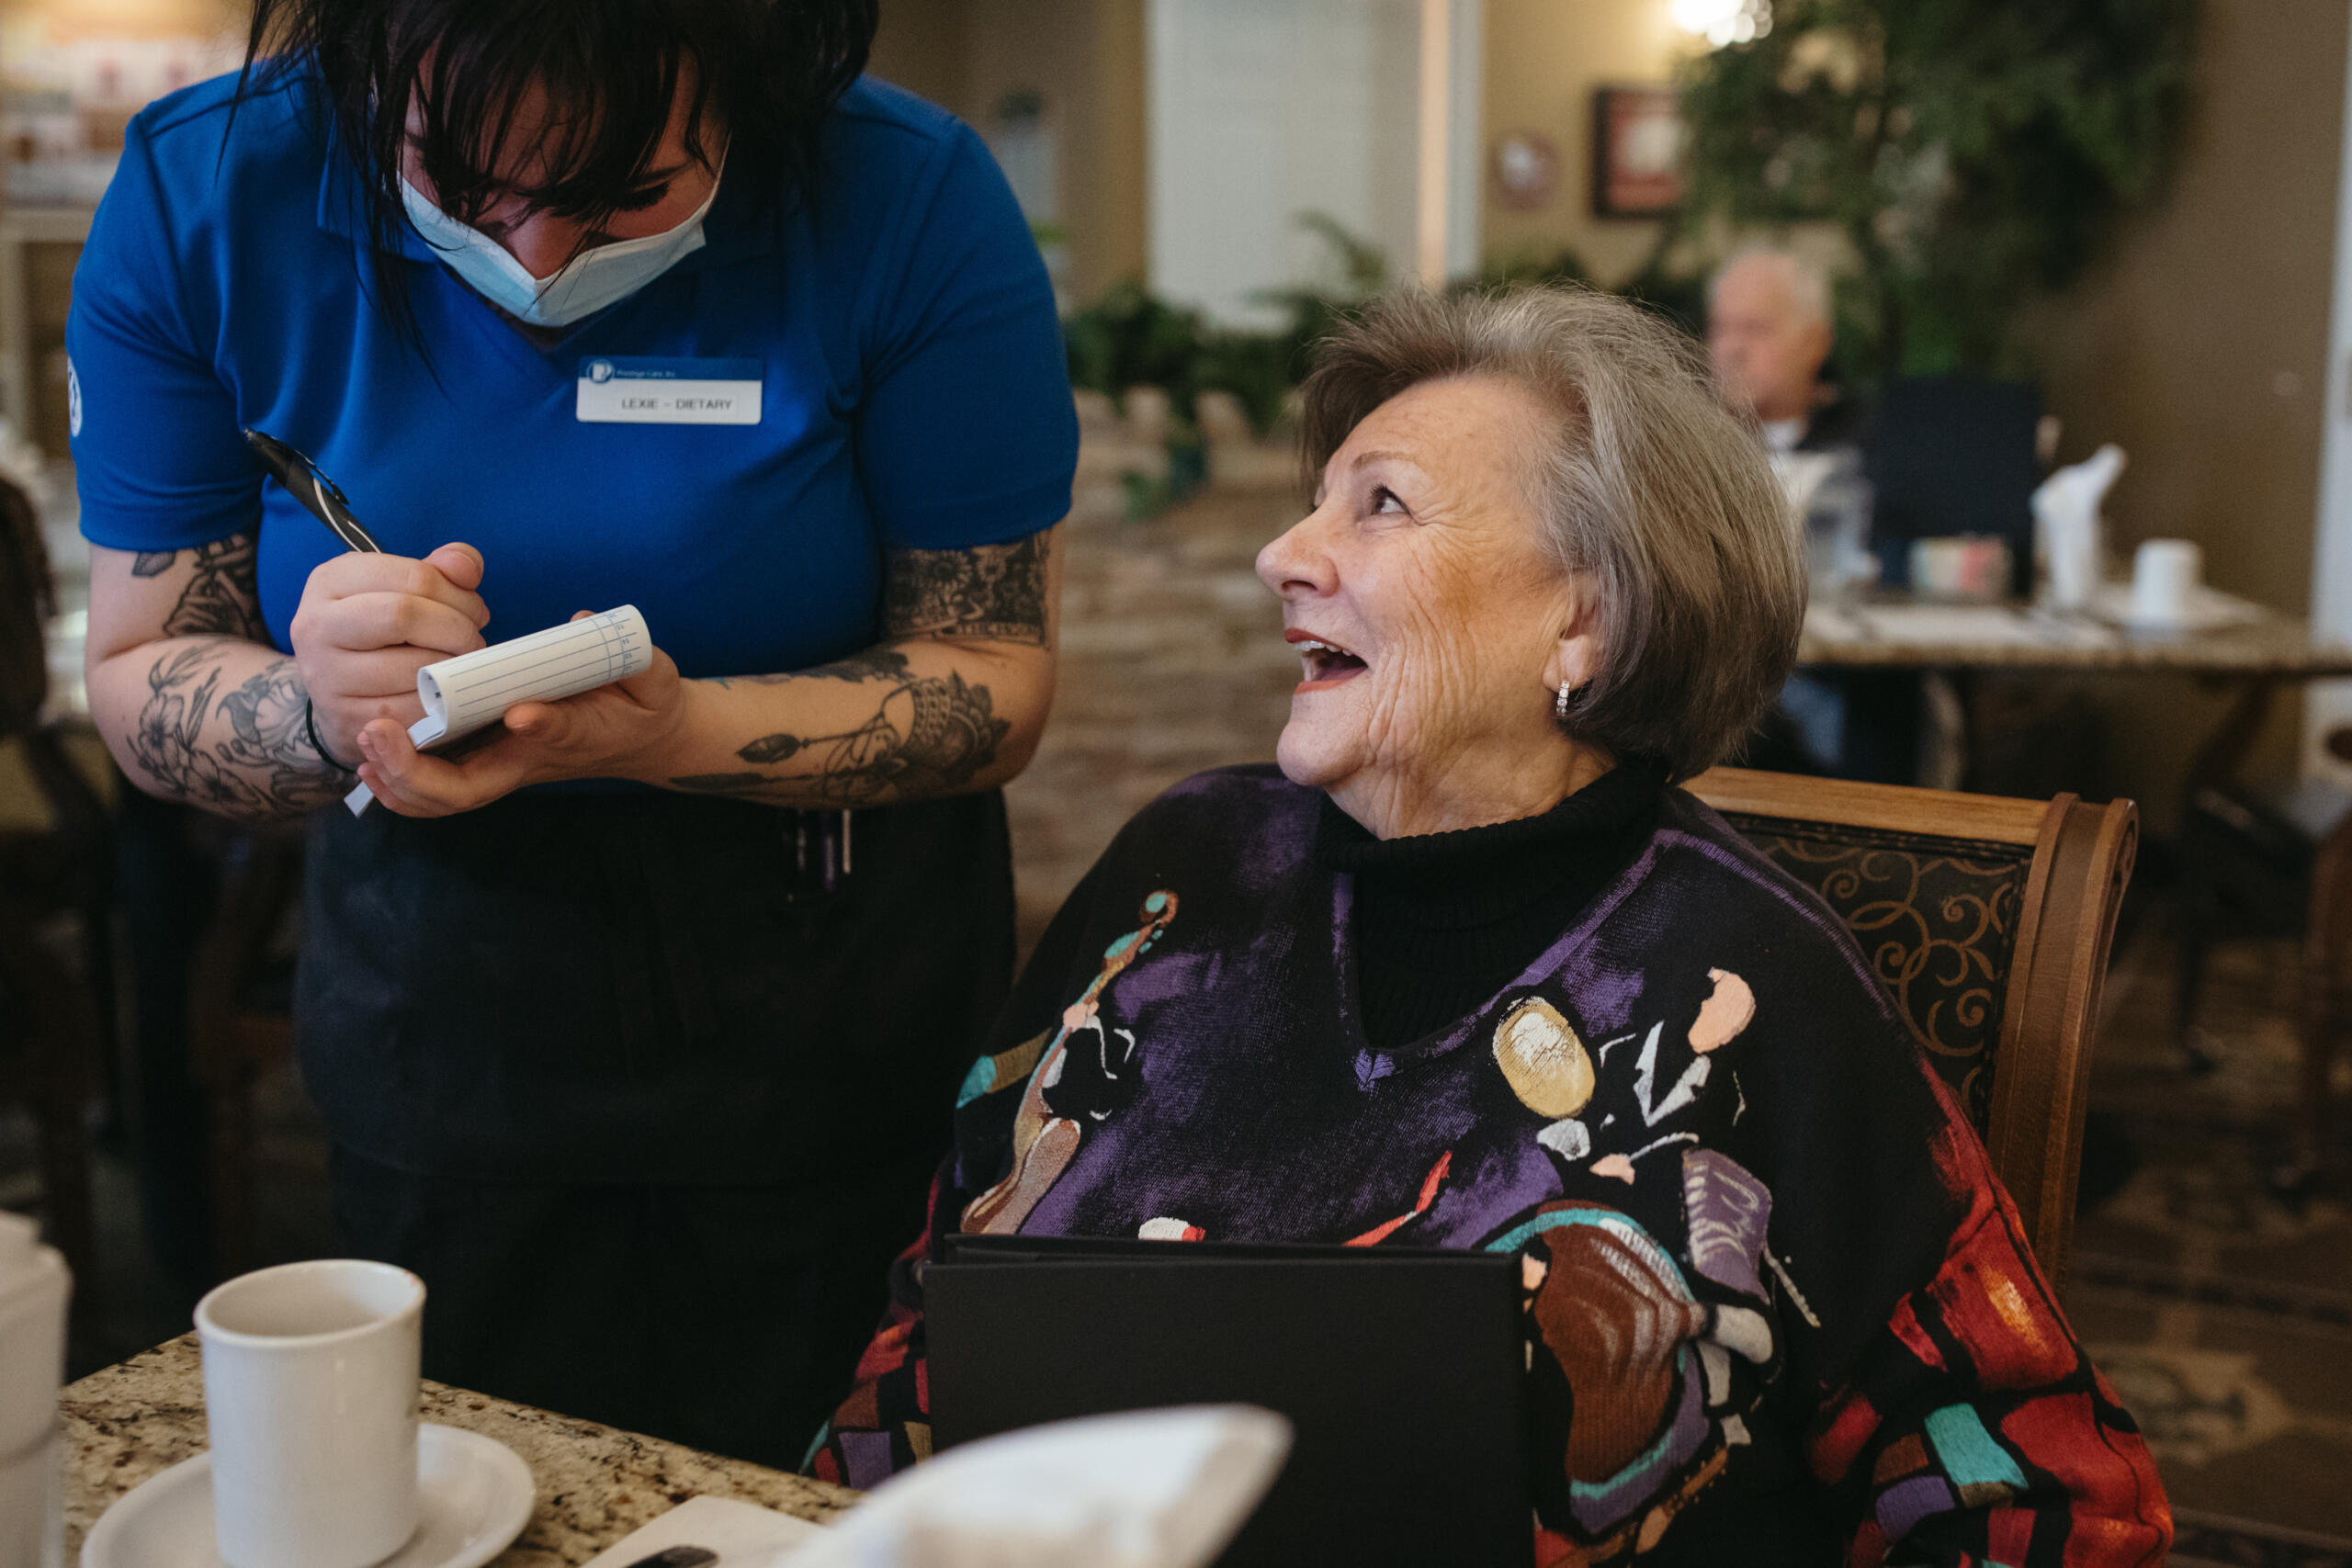
Amidst their offerings, Forest Grove Rehabilitation and Care Center serves as a beacon for those seeking short-term post-hospitalization care. Moreover, the center shines with its provision of specialty skilled nursing and long-term/ongoing care—an unwavering support system designed to meet the evolving needs of patients. Within this inviting haven, a bright and open home-like environment extends a warm welcome to residents. Here, a dedicated 24-hour care team stands steadfast, wholeheartedly embracing each patient’s unique and individual needs, ushering them toward optimal recovery. 

Quality ratings

Measured by Centers for Medicare & Medicaid Services (CMS)

Overall rating Info The Overall CMS Rating combines results from health inspections, staffing levels and quality measures. Health inspections carry the most weight. Staffing and quality scores can increase or decrease the final rating based on performance compared to state and national standards.
4/5 ▲ 1.0 Oregon average: 3.0/5
Health Inspection Info Based on the results of the facility's three most recent standard inspections and any complaint investigations. CMS reviews the number, scope, and severity of deficiencies, with more recent findings weighted more heavily.
4/5 ▲ 1.2 Oregon average: 2.8/5
Staffing Info Measures average nursing staff hours per resident per day, including Registered Nurses (RNs) and total nursing staff. Ratings are adjusted based on the level of care residents require and are compared to state and national benchmarks.
3/5 ▼ 0.7 Oregon average: 3.7/5
Quality Measures Info Based on clinical and physical health indicators reported to CMS, such as hospital readmissions, falls, pressure ulcers, and improvements in mobility. These measures reflect how well residents' health needs are being managed.
4/5 ▲ 0.6 Oregon average: 3.4/5

Staffing hours breakdown

Info Daily nursing hours per resident by staff type, reported to CMS. Higher is generally better — compare this facility to state and national averages to see where staffing stands.

Hours per resident per day — compared to Oregon state averages

Total nursing care / resident Info This home is ranked 62nd out of 84 homes in Oregon.

Total adjusted nursing hours per resident per day, combining RN, LPN, and aide time. CMS adjusts this for case-mix so facilities can be fairly compared.
4h 42m per day
Rank #62 / 84Nurse hours — state benchmarkedThis home is ranked 62nd out of 84 homes in Oregon.Shows adjusted nurse hours per resident per day benchmarked to the Oregon average, with a ranking across 84 Oregon SNFs. More hours mean more direct care. The national average is about 3.5 hrs; below 3.0 is a red flag.
This facility Oregon avg (5h 15m per day)
vs Oregon avg
-10%

5 of 6 metrics below state avg

Standout metric LPN / LVN is +28% above state avg
Staff typeHours / dayvs state avg
Registered Nurse (RN) Info RNs hold the highest nursing license and can assess residents, interpret test results, and direct care plans. More RN hours per day often signals stronger clinical oversight and faster response to health changes. 23m per day ▼ 44% State avg: 41m per day · National avg: 41m per day
LPN / LVN Info Licensed Practical Nurses (LPNs) or Licensed Vocational Nurses (LVNs) deliver routine hands-on care — medication administration, wound dressing, and monitoring vital signs. They work under RN supervision and make up a large share of daily bedside care. 1h 9m per day ▲ 28% State avg: 54m per day · National avg: 52m per day
Nurse Aide Info Certified Nurse Aides (CNAs) provide the most direct day-to-day assistance: bathing, dressing, feeding, and mobility. Nurse aide hours are typically the largest staffing category and directly affect residents' quality of life. 3h 0m per day ▼ 11% State avg: 3h 22m per day · National avg: 2h 21m per day
Total Nursing (Weekend) Info Combined nursing hours (RN + LPN + Nurse Aide) per resident per day on weekends. Staffing often drops on weekends — this figure reveals whether the facility maintains adequate coverage outside of weekday hours. 4h 8m per day ▼ 6% State avg: 4h 23m per day · National avg: 3h 26m per day
Physical Therapist Info Hours per resident per day provided by licensed Physical Therapists (PTs) or PT Assistants. PT services help residents recover mobility after injury or illness and are especially important for post-acute (short-stay) rehabilitation. 4m per day ▼ 20% State avg: 5m per day · National avg: 4m per day
RN (Weekend) Info Registered nurse hours specifically on weekends. Facilities sometimes reduce RN presence on Saturdays and Sundays — a low weekend RN figure compared to weekday hours can indicate reduced clinical oversight when most administrative staff are absent. 15m per day ▼ 42% State avg: 26m per day · National avg: 29m per day

Capacity and availability

This home usually has availability

Occupancy lower than 85% suggests more openings may be available.

Lower occupancy than the Oregon average: 65.7%
Occupancy rate 58.6% Rank #54 / 80Occupancy rate — state benchmarkedThis home is ranked 54th out of 80 homes in Oregon.Shows this facility's occupancy rate versus the Oregon average, with its statewide rank out of 80. Higher occupancy signals strong local demand and financial stability.
Avg. Length of Stay 57 days
Occupancy rate
58.6% Rank #54 / 80Occupancy rate — state benchmarkedThis home is ranked 54th out of 80 homes in Oregon.Shows this facility's occupancy rate versus the Oregon average, with its statewide rank out of 80. Higher occupancy signals strong local demand and financial stability.
Avg. Length of Stay
57 days

Who this home usually serves

TYPE OF STAY

Primarily short stays

Residents typically stay for brief periods, with frequent admissions and discharges throughout the year.

Might be optimal for
Post-acute recovery Temporary care Transitional stays

Breakdown by payment type

Medicare

25% of new residents, usually for short-term rehab.

Typical stay 26 days

Private pay

61% of new residents, often for short stays.

Typical stay 23 days

Medicaid

15% of new residents, often for long-term daily care.

Typical stay 7 - 8 months

Finances and operations

Privately-owned community
Operated by a business corporation.
Home revenue
$19.5M
Profit
$3.0M
Privately-owned community Operated by a business corporation.
Home revenue
$19.5M Rank #18 / 79Revenue — state benchmarkedThis home is ranked 18th out of 79 homes in Oregon.Shows this facility's annual revenue compared to the Oregon SNF average. Higher revenue generally means more resources for staffing and capital — read alongside Payroll %.
Profit
$3.0M
Payroll costs Info The portion of the home's budget spent on staff, including nurses, caregivers, and other employees who support care and operations. Rank #18 / 79Payroll — state benchmarkedThis home is ranked 18th out of 79 homes in Oregon.Shows total annual staff payroll benchmarked to the Oregon average. Higher payroll investment relative to peers often signals better staffing and less reliance on cheaper contract labor.
$5.7M
29.3% of revenue Rank #63 / 79Payroll % — state benchmarkedThis home is ranked 63rd out of 79 homes in Oregon.Shows payroll as a percentage of revenue versus the Oregon average. Well-run SNFs often land around 55–65%. Below 25% may signal understaffing or heavy agency use — read with Staffing ratings.
Other operating costs Info All remaining costs needed to run the home, such as food, utilities, building maintenance, supplies and administrative expenses.
$10.1M
Total costs $15.8M
Walk Score
Walk Score: 44 / 100 Rank #37 / 44Walk Score — state benchmarkedThis home is ranked 37th out of 44 homes in Oregon.Shows how walkable this facility's neighborhood is compared to the average Walk Score across Oregon SNFs. Higher scores benefit residents, families, and staff.
Somewhat walkable. A few nearby services may be reachable on foot, but most trips require transportation.

About this community

Types of Care at Forest Grove Rehabilitation and Care Center

Assisted Living Independent Living Memory Care Nursing Home Hospice Care

Contact Forest Grove Rehabilitation and Care Center

Health Inspection History

Inspections
Total health inspections 5

Oregon average 5.1


Last Health inspection on Jul 2025

Total health citations
21 Rank #27 / 82Health citations — state benchmarkedThis home is ranked 27th out of 82 homes in Oregon.Shows this facility's total health deficiency citations benchmarked to the Oregon state average, with a ranking across all 82 OR SNFs. Lower citation counts earn a better rank.

Oregon average 34

Citations per inspection
4.2

Oregon average 6.86


Health citations are formal notices following inspections when they fail to comply with safety and care standards.

12 of 21 citations resulted from standard inspections; 2 of 21 resulted from complaint investigations; and 7 of 21 came from combined inspections (standard and complaint).

Breakdown of citation severity (last 3 years)
Critical Health citations More info
1 Rank #42 / 50Severe citations — state benchmarkedThis home is ranked 42nd out of 50 homes in Oregon.Shows citations where actual resident harm occurred, compared to the Oregon average and ranked across 50 SNFs statewide. Even a single severe citation is significant — lower is always better.
100% worse than Oregon average

Oregon average: 0.5


Serious Health citations More info 3
150% worse than Oregon average

Oregon average: 1.2

1 critical citation More info Oregon average: 0.5

3 serious citations More info Oregon average: 1.2

17 moderate citations More info Oregon average: 32.1

0 minor citations More info Oregon average: 0.2
Citations history (last 3 years)
Abuse/Neglect moderate citation Info Issues related to protecting resident's from harm, including abuse, neglect, or mistreatment. Jul 25, 2025
Corrected

Quality of Care moderate citation Info Issues related to how well residents receive appropriate treatment and support for their medical and daily care needs. Jul 25, 2025
Corrected

Quality of Care moderate citation Info Issues related to how well residents receive appropriate treatment and support for their medical and daily care needs. Dec 18, 2024
Corrected

Nursing Services moderate citation Info Issues related to the availability and quality of nursing staff and the care they provide. Jun 14, 2024
Corrected

Compare Nursing Homes around Hillsboro The information below is reported by the Oregon Department of Human Services, Aging and People with Disabilities.

5 facilities compared · CMS & OR Dept. of Health data · Updated Apr 2026

Filter by care type
Avalon Care Center – Scappoose
NH

Nursing Home Licensed facility providing 24/7 skilled nursing care for residents with complex, ongoing medical needs. Staffed by RNs, LPNs, and CNAs. Inspected and star-rated annually by CMS. Accepts Medicare (short-term rehab) and Medicaid (long-term care).

AL

Assisted Living A licensed, long-term care setting for seniors or individuals with disabilities who need help with daily activities — like bathing, dressing, and medication management — but not 24-hour skilled nursing. Offers housing, meals, and around-the-clock support while aiming to maximize resident independence.

Scappoose40 63.5% -3%4.77 -1%-9%0123.0131--Eea Company---385283
Forest Grove Rehabilitation and Care Center
NH

Nursing Home Licensed facility providing 24/7 skilled nursing care for residents with complex, ongoing medical needs. Staffed by RNs, LPNs, and CNAs. Inspected and star-rated annually by CMS. Accepts Medicare (short-term rehab) and Medicaid (long-term care).

AL

Assisted Living A licensed, long-term care setting for seniors or individuals with disabilities who need help with daily activities — like bathing, dressing, and medication management — but not 24-hour skilled nursing. Offers housing, meals, and around-the-clock support while aiming to maximize resident independence.

Forest Grove114 58.6% -11%4.71 +34%-10%0214.2479- 44 -$19.5M$5.7M29.3%385155
Avamere Court at Keizer
NH

Nursing Home Licensed facility providing 24/7 skilled nursing care for residents with complex, ongoing medical needs. Staffed by RNs, LPNs, and CNAs. Inspected and star-rated annually by CMS. Accepts Medicare (short-term rehab) and Medicaid (long-term care).

AL

Assisted Living A licensed, long-term care setting for seniors or individuals with disabilities who need help with daily activities — like bathing, dressing, and medication management — but not 24-hour skilled nursing. Offers housing, meals, and around-the-clock support while aiming to maximize resident independence.

Keizer69 77.1% +17%4.47 -48%-15%0186.0052- 76 Ari Cbc Llc$14.3M$5.3M37.2%385233
Alpine House Senior Skilled Care Living -
NH

Nursing Home Licensed facility providing 24/7 skilled nursing care for residents with complex, ongoing medical needs. Staffed by RNs, LPNs, and CNAs. Inspected and star-rated annually by CMS. Accepts Medicare (short-term rehab) and Medicaid (long-term care).

AL

Assisted Living A licensed, long-term care setting for seniors or individuals with disabilities who need help with daily activities — like bathing, dressing, and medication management — but not 24-hour skilled nursing. Offers housing, meals, and around-the-clock support while aiming to maximize resident independence.

Portland---------000.00-A+ 41 -----
Avamere at Seaside Residential Care Facility -
NH

Nursing Home Licensed facility providing 24/7 skilled nursing care for residents with complex, ongoing medical needs. Staffed by RNs, LPNs, and CNAs. Inspected and star-rated annually by CMS. Accepts Medicare (short-term rehab) and Medicaid (long-term care).

AL

Assisted Living A licensed, long-term care setting for seniors or individuals with disabilities who need help with daily activities — like bathing, dressing, and medication management — but not 24-hour skilled nursing. Offers housing, meals, and around-the-clock support while aiming to maximize resident independence.

Seaside40--------000.00--------

Financial Assistance for
Nursing Home in Oregon

Get Financial aid guidance

Oregon Project Independence (OPI)

OPI

Age 60+
General Oregon resident, at risk of nursing home but not Medicaid-eligible.
Income Limits ~$2,000/month individual, varies
Asset Limits $5,000 individual
OR

Cost-sharing required; rural/urban balance.

Benefits
In-home care (3-5 hours/week) Respite (up to 10 days/year) Adult day care (~$70/day) Transportation (~5 trips/month)

Oregon Medicaid Community-Based Care

OR Medicaid CBC

Age 65+ or disabled
General Oregon resident, Medicaid-eligible, nursing home-level care need.
Income Limits (2025) ~$2,829/month 300% FBR, individual
Asset Limits $2,000 (individual), $3,000 (couple).
OR

High demand in urban areas (e.g., Portland).

Benefits
Personal care (5-7 hours/day) Respite (240 hours/year) Adult day care ($70/day) Home modifications ($1,500 avg.)

Program of All-Inclusive Care for the Elderly (PACE)

Oregon PACE (e.g., Providence ElderPlace)

Age 55+
General OR resident (specific counties), NFLOC, safe with PACE support.
Income Limits (2025) ~$2,829/month (Medicaid-eligible); private pay option available.
Asset Limits $2,000 (individual), $3,000 (couple) for Medicaid enrollees.
OR

Available in 11 counties (e.g., Multnomah, Washington); Providence ElderPlace dominant provider.

Benefits
Personal care (5-7 hours/day) Medical care Meals Transportation Respite Therapies

Medicare Savings Program (MSP)

Oregon Medicare Savings Program

Age 65+ or disabled
General OR resident, Medicare Part A/B.
Income Limits (2025) ~$2,510/month (QMB), ~$3,380/month (SLMB), ~$3,598/month (QI)—individual.
Asset Limits $9,430 (individual), $14,130 (couple).
OR

Three tiers; includes Extra Help for Part D; no waitlist.

Benefits
Covers Part B premiums ($174.70/month) Deductibles ($240/year) Copays (~20%)

Low-Income Home Energy Assistance Program (LIHEAP)

Oregon LIHEAP

Age 60+ prioritized
General OR resident, low-income household.
Income Limits (2025) ~$3,970/month individual, 185% FPL
Asset Limits Not assessed; income-focused.
OR

Covers gas, electric, oil; emergency aid via Oregon Energy Fund (OEF).

Benefits
Heating/cooling aid ($300-$1,000/season) Emergency aid ($500 max via OEF)

Family Caregiver Support Program (FCSP)

Oregon Family Caregiver Support Program

Age
General Caregivers of 60+ needing care or 55+ caregivers of others; OR resident; functional needs (2+ ADLs).
Income Limits (2025) No strict cap; prioritizes low-income ~$24,980/year
Asset Limits Not assessed; need-based.
OR

15 regions; rural priority; includes grandparent caregivers.

Benefits
Respite (4-6 hours/week or 5 days/year) Adult day care ($60/day) Training Supplies (~$500/year)

Senior Community Service Employment Program (SCSEP)

Oregon SCSEP

Age 55+
General unemployed, low-income, OR resident.
Income Limits (2025) ~$1,983/month 125% FPL
Asset Limits Not specified; income-focused.
OR

Priority for veterans, rural residents; Easterseals/AARP partnership.

Benefits
Paid training (~20 hours/week at ~$7.25/hour) Job placement

VA Aid and Attendance (A&A) and Housebound Benefits

Oregon VA Aid and Attendance/Housebound

Age 65+ or disabled veteran/spouse
General OR resident, wartime service, need for ADL help (A&A) or homebound.
Income Limits (2025) Net income < ~$1,984/month (veteran with dependent, A&A); pension offsets income.
Asset Limits ~$155,356 net worth limit
OR

High veteran demand; Oregon Veterans’ Homes option.

Benefits
Cash (~$1,433-$2,642/month veteran, ~$951-$1,318 spouse) for care costs (e.g., in-home, assisted living)

Senior Property Tax Deferral Program

Oregon Property Tax Deferral for Disabled and Senior Citizens

Age 62+
General OR resident, homeowner 5+ years, low-income.
Income Limits (2025) ~$58,000/year household, adjusted annually
Asset Limits Home value < county median; equity > 15%.
OR

Deferred taxes accrue 6% interest; repaid upon sale/death.

Benefits
Tax deferral (~$1,000-$3,000/year avg., varies by county)

Elderly Nutrition Program (ENP)

Oregon Elderly Nutrition Program

Age 60+
General OR resident (or spouse of any age); no income limit.
Income Limits (2025) None; donations encouraged.
Asset Limits Not assessed.
OR

Includes Meals on Wheels; prioritizes homebound/low-income.

Benefits
Home-delivered or congregate meals (~$5-$7/meal value, 5 meals/week avg.)

Places of interest near Forest Grove Rehabilitation and Care Center

Address 4.4 miles from city center Info Estimated distance in miles from Forest Grove's city center to Forest Grove Rehabilitation and Care Center's address, calculated via Google Maps. — 9.84 miles to nearest hospital (Kaiser Permanente Westside Medical Center)

Calculate Travel Distance to Forest Grove Rehabilitation and Care Center

Add your location

Address

Staffing Data (Q2 2025)

This data corresponds to Q2 2025 and is based on CMS Payroll-Based Journal.

Total staff 136
Employees 99
Contractors 37
Staff to resident ratio 1.74:1
40% worse than Oregon average

Oregon average ratio: 2.92:1

Avg staff/day 47
Average shift 8.6 hours
10% better than Oregon average

Oregon average: 7.8 hours

Total staff hours (quarter) 36,798
Nursing staff breakdown
Registered Nurse

Manages medical care and health needs.

Total count 16
Average shift length Info Average shift length. Calculated as total hours divided by days worked and average staff per day. 9.1 hours

This role is partially covered by contractors.

Licensed Practical Nurse

Assists with medical care and medications.

Total count 37
Average shift length Info Average shift length. Calculated as total hours divided by days worked and average staff per day. 10 hours

This role is partially covered by contractors.

Certified Nursing Assistant

Helps with daily care and mobility.

Total count 62
Average shift length Info Average shift length. Calculated as total hours divided by days worked and average staff per day. 8.5 hours

This role is partially covered by contractors.

Contractor staffing

Total hours from contractors

1.4%

520 contractor hours this quarter

Licensed Practical Nurse: 13 Registered Nurse: 12 Certified Nursing Assistant: 12
Staff by category
Certified Nursing Assistant50126219,90891100%8.5
Licensed Practical Nurse2413378,28991100%10
Registered Nurse412162,01891100%9.1
Medication Aide/Technician3031,63891100%9.5
Dental Services Staff2029127178%7.5
Physical Therapy Assistant2025936571%7.3
Nurse Practitioner1015806673%8.8
Administrator1015126470%8
Occupational Therapy Aide1015126470%8
Dietitian1014996571%7.7
Respiratory Therapy Technician6064937077%6.4
Speech Language Pathologist2024607077%6.5
Qualified Activities Professional1013234448%7.3
Qualified Social Worker101622426%2.6
62 Certified Nursing Assistant
% of Days 100%
37 Licensed Practical Nurse
% of Days 100%
16 Registered Nurse
% of Days 100%
3 Medication Aide/Technician
% of Days 100%
2 Dental Services Staff
% of Days 78%
2 Physical Therapy Assistant
% of Days 71%
1 Nurse Practitioner
% of Days 73%
1 Administrator
% of Days 70%
1 Occupational Therapy Aide
% of Days 70%
1 Dietitian
% of Days 71%
6 Respiratory Therapy Technician
% of Days 77%
2 Speech Language Pathologist
% of Days 77%
1 Qualified Activities Professional
% of Days 48%
1 Qualified Social Worker
% of Days 26%

Facility Characteristics

Source: CMS Long-Term Care Facility Characteristics (Data as of Jan 2026)

Total residents 78
Medicare
6
7.7% of residents
Medicaid
51
65.4% of residents
Private pay or other
21
26.9% of residents
Programs & Services
Residents Group

Residents meet regularly to discuss policies, care quality, and activities

Active Resident Council

Organized group of residents that meets regularly to discuss facility policies, quality of life, and activities.

Quality of care over time

These measures show how residents usually do over time at this home, based on health outcomes and preventive care.

High-risk clinical events score Info A composite score based on pressure ulcers, falls with injury, weight loss, walking ability decline, and activities of daily living decline. 13.5
28% worse than Oregon average

Oregon average: 10.5

Functional decline score Info A composite score based on activities of daily living decline, walking ability decline, and incontinence. 26.5
26% worse than Oregon average

Oregon average: 21.1

Long-stay resident measures
Average Oregon avg: 3.4 Info CMS star rating based on long-stay quality measure performance. 5 stars = significantly above average, 1 star = significantly below average.
Need for Help with Daily Activities Increased Info Percent of long-stay residents whose need for help with daily activities has increased 16.2%
In line with Oregon average

Oregon average: 16.3%

Walking Ability Worsened Info Percent of long-stay residents whose ability to move independently worsened 34.6%
39% worse than Oregon average

Oregon average: 24.9%

Low Risk Residents with Bowel/Bladder Incontinence Info Percent of low risk long-stay residents who lose control of their bowels or bladder 28.8%
27% worse than Oregon average

Oregon average: 22.6%

Falls with Major Injury Info Percent of long-stay residents experiencing one or more falls with major injury 1.6%
35% better than Oregon average

Oregon average: 2.4%

High Risk Residents with Pressure Ulcers Info Percent of long-stay high risk residents with pressure ulcers 7.5%
9% worse than Oregon average

Oregon average: 6.9%

Urinary Tract Infection Info Percent of long-stay residents with a urinary tract infection 4.2%
101% worse than Oregon average

Oregon average: 2.1%

Lost Too Much Weight Info Percent of long-stay residents who lose too much weight 7.7%
46% worse than Oregon average

Oregon average: 5.3%

Depressive Symptoms Info Percent of long-stay residents who have depressive symptoms 7.8%
68% worse than Oregon average

Oregon average: 4.6%

Antipsychotic Use Info Percent of long-stay residents who received an antipsychotic medication 11.8%
11% better than Oregon average

Oregon average: 13.2%

Pneumococcal Vaccine Info Percent of long-stay residents assessed and appropriately given the pneumococcal vaccine 97.9%
In line with Oregon average

Oregon average: 95.7%

Influenza Vaccine Info Percent of long-stay residents assessed and appropriately given the seasonal influenza vaccine 100.0%
5% better than Oregon average

Oregon average: 95.2%

Short-stay resident measures
Significantly above average Oregon avg: 3.2 Info CMS star rating based on short-stay quality measure performance. 5 stars = much above average, 1 star = much below average.
Pneumococcal Vaccine Info Percent of short-stay residents assessed and appropriately given the pneumococcal vaccine 90.2%
5% better than Oregon average

Oregon average: 86.2%

Antipsychotic medication increase Info Percent of short-stay residents who newly received an antipsychotic medication 1.6%
13% better than Oregon average

Oregon average: 1.8%

Influenza Vaccine Info Percent of short-stay residents assessed and appropriately given the seasonal influenza vaccine 88.1%
8% better than Oregon average

Oregon average: 81.2%

Re-hospitalized after SNF stay Info Percentage of short-stay residents who were re-hospitalized after their nursing home admission. 12.5%
42% better than Oregon average

Oregon average: 21.6%

Emergency department visits Info Percentage of short-stay residents who had an outpatient emergency department visit. 7.8%
48% better than Oregon average

Oregon average: 15.1%

Falls with major injury Info Percentage of SNF residents who experience falls with major injury during their stay. 0.0%
100% better than Oregon average

Oregon average: 0.8%

Ability to care for self at discharge Info Percentage of residents at or above expected ability to care for themselves at discharge. 42.2%
21% worse than Oregon average

Oregon average: 53.7%

Successful return to home or community Info Rate of successful return to home or community from a skilled nursing facility. 72.2%
43% better than Oregon average

Oregon average: 50.6%

Guides for Better Senior Living

Care Cost Calculator: See Prices in Your Area

Nursing Home Data Explorer

Don’t Wait Too Long: 7 Red Flag Signs Your Parent Needs Assisted Living Now

The True Cost of Assisted Living in 2025 – And How Families Are Paying For It

Understanding Senior Living Costs: Pricing Models, Discounts & Financial Assistance

Explore Open Rooms
1 Contact details
2 What type of senior care service are you looking for?
3 What budget do you have in mind for senior care?
4 How soon do you need to find care?
5 Additional details

Thank you for your interest!

Our team will be in touch shortly to help with next steps.