


Home Away From Home, LLC


Home Away From Home, LLC
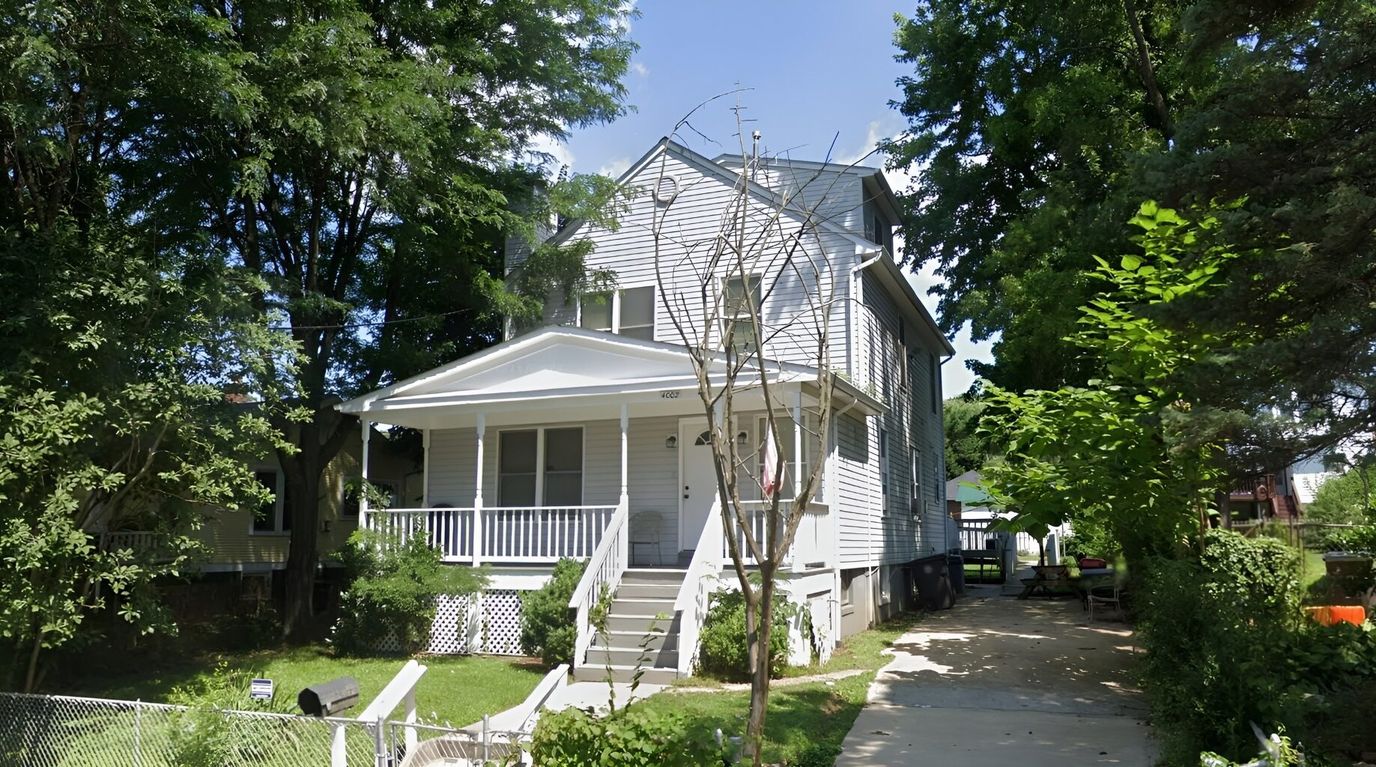
Make every moment count at Home Away From Home, a dedicated community at Hyattsville, MD, offering assisted living and memory care. Residents can ease their worries with a kind and highly skilled team helping with their daily living activities and personal needs around the clock. Beautifully furnished and cozy accommodations are provided in a nurturing and welcoming environment, ensuring residents are comfortable and safe.
Stimulating programs and exciting events are conducted, encouraging residents to live actively and make new friends. Mealtimes promote social interaction and satisfy dietary needs with delicious and healthy dining options. The community is a good option for those needing assistance to live comfortably in their golden years.
8-bed community Rank #308 / 690Bed count — State benchmarkedThis home is ranked 308th out of 690 homes in Maryland for Bed Count. Shows this facility's certified or reported bed count compared to other Maryland facilities. Larger communities may offer more amenities, programs, and on-site services for residents and families.Facilities with the same value for a metric share the same rank. Rankings are based only on facilities in Maryland that report data for that category. Facilities without available data are excluded from the ranking.Click the rank badge to see the full State ranking.Click here to see the full State ranking.
A smaller, more intimate setting that may offer a quieter environment and closer staff-resident interactions.
Walk Score: 72 / 100 Rank #160 / 985Walk Score — State benchmarkedThis home is ranked 160th out of 985 homes in Maryland for Walk Score. Shows how walkable this facility's neighborhood is compared to the average Walk Score across Maryland facilities. Higher scores benefit residents, families, and staff.Facilities with the same value for a metric share the same rank. Rankings are based only on facilities in Maryland that report data for that category. Facilities without available data are excluded from the ranking.Click the rank badge to see the full State ranking.Click here to see the full State ranking.
Very walkable. Most errands can be accomplished on foot, and many essentials are within a short walk.
About this community
Facility TypeAssisted Living
CountyPrince George's
Safety FeaturesMonitoring health issues, alerting primary care providers
Doctor on Staff
Nursing Services
No mild Alzheimer's level
No moderate Alzheimer's level
No severe Alzheimer's level
Home Care
Admission CriteriaAdvanced age, Dementia or Alzheimer's disease, Degenerative disorders, Chronic conditions
Specific ProgramsElderly Care Service, 24Hr/7 Days Support, Medical Care
What does this home offer?
Housing Options: Studio / Semi-Private / 1 Bed / 2 Bed
Building Type: 2-story
Housekeeping Services
Social and Recreational Activities
Places of interest near Home Away From Home, LLC
![]() 0.3 miles from city center
0.3 miles from city center
![]() Estimated distance in miles from Hyattsville's city center to Home Away From Home, LLC's address, calculated via Google Maps.
Estimated distance in miles from Hyattsville's city center to Home Away From Home, LLC's address, calculated via Google Maps.
Calculate Travel Distance to Home Away From Home, LLC
Add your location
Compare Assisted Living around Hyattsville
The information below is reported by the Maryland Department of Health, Office of Health Care Quality.
| Independence Court of Hyattsville | AL MC RC | Hyattsville (Queens Chapel Manor) | 130
Facility
130
MD AVG
43
Rank
#63 / 690 | Yes |
64
Facility
64
MD AVG
43
Rank
#261 / 985 | Suite / 1 Bed | 35
Facility
35
MD AVG
21
Rank
#18 / 210 |
44% Male Residents — State Benchmarked 44% of residents are male, compared to the Maryland average of 31%. A relatively balanced gender mix for assisted living, where facilities typically skew heavily female. |
56% Female Residents — State Benchmarked 56% of residents are female, compared to the Maryland average of 69%. Closer to an even gender split than most assisted living facilities, which typically have 65–75% female residents. |
24% White Residents — State Benchmarked 24% of residents are reported as White, compared to the Maryland average of 81%. A lower White share than the Maryland average — the community may draw a more diverse resident mix relative to other facilities in Maryland. |
68% African American Residents — State Benchmarked 68% of residents are reported as African American or Black, compared to the Maryland average of 13%. A higher African American share than the typical Maryland average — useful context when comparing cultural fit and community composition. |
8% Other Ethnicity Residents — State Benchmarked 8% of residents fall into categories other than White or African American (combined), compared to the Maryland average of 6%. This column aggregates Hispanic, Asian, multiracial, and any other labeled groups that are not classified as White or African American. Reported subgroups in this total: Other (6%), Asian (2%). |
18% Residents Age 65–74 — State Benchmarked 18% of residents are 65–74, compared to the Maryland average of 13%. A higher share of younger seniors often signals a more independent, active resident community with lower acuity care needs. |
42% Residents Age 75–84 — State Benchmarked 42% of residents are 75–84, compared to the Maryland average of 31%. A high concentration in this mid-range bracket, where residents typically need moderate support with daily activities. |
22% Residents Age 85–94 — State Benchmarked 22% of residents are 85–94, compared to the Maryland average of 44%. The population here skews younger than the statewide norm, which may indicate a more active, lower-acuity community. |
14% Residents Age 95+ — State Benchmarked 14% of residents are 95 or older, compared to the Maryland average of 16%. In line with the statewide profile for the oldest resident bracket. |
| The Terraces at Tuckerman Lane | AL MC NH RC SNF | North Bethesda | 101
Facility
101
MD AVG
43
Rank
#113 / 690 | No |
39
Facility
39
MD AVG
43
Rank
#534 / 985 | studio / suite / 1 bed | 28
Facility
28
MD AVG
21
Rank
#53 / 210 |
45% Male Residents — State Benchmarked 45% of residents are male, compared to the Maryland average of 31%. A relatively balanced gender mix for assisted living, where facilities typically skew heavily female. |
55% Female Residents — State Benchmarked 55% of residents are female, compared to the Maryland average of 69%. Closer to an even gender split than most assisted living facilities, which typically have 65–75% female residents. |
75% White Residents — State Benchmarked 75% of residents are reported as White, compared to the Maryland average of 81%. Close to the average for this category among assisted living facilities in Maryland with reported race/ethnicity data. |
15% African American Residents — State Benchmarked 15% of residents are reported as African American or Black, compared to the Maryland average of 13%. In line with the Maryland average for African American residents among facilities reporting this breakdown. |
9% Other Ethnicity Residents — State Benchmarked 9% of residents fall into categories other than White or African American (combined), compared to the Maryland average of 6%. This column aggregates Hispanic, Asian, multiracial, and any other labeled groups that are not classified as White or African American. Reported subgroups in this total: Asian (5%), Hispanic (3%), American Indian (2%). |
11% Residents Age 65–74 — State Benchmarked 11% of residents are 65–74, compared to the Maryland average of 13%. In line with the statewide profile for this youngest senior bracket in assisted living. |
26% Residents Age 75–84 — State Benchmarked 26% of residents are 75–84, compared to the Maryland average of 31%. Below the state norm — the resident mix may skew either younger or older than this typical middle bracket. |
48% Residents Age 85–94 — State Benchmarked 48% of residents are 85–94, compared to the Maryland average of 44%. This is typically the most common age bracket in assisted living — this facility is in line with the statewide norm. |
14% Residents Age 95+ — State Benchmarked 14% of residents are 95 or older, compared to the Maryland average of 16%. In line with the statewide profile for the oldest resident bracket. |
| Malta House | AL HOS PC | Chillum (Avondale Terrace) | 16
Facility
16
MD AVG
43
Rank
#253 / 690 | Yes |
43
Facility
43
MD AVG
43
Rank
#495 / 985 | Private Studio | 30
Facility
30
MD AVG
21
Rank
#44 / 210 |
25% Male Residents — State Benchmarked 25% of residents are male, compared to the Maryland average of 31%. This facility caters to a majority female resident pool (75% female), consistent with the broader assisted living trend where women significantly outnumber men. |
75% Female Residents — State Benchmarked 75% of residents are female, compared to the Maryland average of 69%. Women comprise the large majority, consistent with national assisted living demographics where women live longer and enter care facilities at higher rates. |
58% White Residents — State Benchmarked 58% of residents are reported as White, compared to the Maryland average of 81%. A lower White share than the Maryland average — the community may draw a more diverse resident mix relative to other facilities in Maryland. |
42% African American Residents — State Benchmarked 42% of residents are reported as African American or Black, compared to the Maryland average of 13%. A higher African American share than the typical Maryland average — useful context when comparing cultural fit and community composition. |
0% Other Ethnicity Residents — State Benchmarked 0% of residents fall into categories other than White or African American (combined), compared to the Maryland average of 6%. This column aggregates Hispanic, Asian, multiracial, and any other labeled groups that are not classified as White or African American. |
17% Residents Age 65–74 — State Benchmarked 17% of residents are 65–74, compared to the Maryland average of 13%. A higher share of younger seniors often signals a more independent, active resident community with lower acuity care needs. |
33% Residents Age 75–84 — State Benchmarked 33% of residents are 75–84, compared to the Maryland average of 31%. This is the second most common age bracket in assisted living, representing residents with moderate care needs. |
42% Residents Age 85–94 — State Benchmarked 42% of residents are 85–94, compared to the Maryland average of 44%. This is typically the most common age bracket in assisted living — this facility is in line with the statewide norm. |
8% Residents Age 95+ — State Benchmarked 8% of residents are 95 or older, compared to the Maryland average of 16%. Most residents here have not yet reached the oldest-old bracket, suggesting a younger overall community. |
| Home Away From Home, LLC | AL | Hyattsville | 8
Facility
8
MD AVG
43
Rank
#308 / 690 | No |
72
Facility
72
MD AVG
43
Rank
#160 / 985 | Studio / Semi-Private / 1 Bed / 2 Bed | - | - | - | - | - | - | - | - | - | - |
| Brightview Bethesda Woodmont | AL IL MC | Bethesda (Rugby Avenue) | - | Yes |
93
Facility
93
MD AVG
43
Rank
#13 / 985 | Deluxe Rooms | - | - | - | - | - | - | - | - | - | - |
Financial Assistance for
Assisted Living in Maryland
Home Away From Home, LLC is located in Hyattsville, Maryland.
Here are the financial assistance programs available to residents in Maryland.
Frequently Asked Questions about Home Away From Home, LLC
Is Home Away From Home, LLC in a walkable area?
Home Away From Home, LLC has a walk score of 72. Very walkable. Most errands can be accomplished on foot, and many essentials are within a short walk.
How many beds does Home Away From Home, LLC have?
Home Away From Home, LLC has 8 beds.
Are there photos of Home Away From Home, LLC?
Yes — there are 2 photos of Home Away From Home, LLC in the photo gallery on this page.
What is the address of Home Away From Home, LLC?
Home Away From Home, LLC is located at 4002 Ingraham Street, Hyattsville, MD 20781.
What is the phone number of Home Away From Home, LLC?
(301) 209-0333 will put you in contact with the team at Home Away From Home, LLC.
What county is Home Away From Home, LLC located in?
Home Away From Home, LLC is in Prince George's County.
Guides for Better Senior Living
Care Cost Calculator: See Prices in Your Area
Assisted Living Explorer
Don’t Wait Too Long: 7 Red Flag Signs Your Parent Needs Assisted Living Now
The True Cost of Assisted Living in 2025 – And How Families Are Paying For It
Understanding Senior Living Costs: Pricing Models, Discounts & Financial Assistance
Updated on
