


Total staff
117
Employees
104
Contractors
13
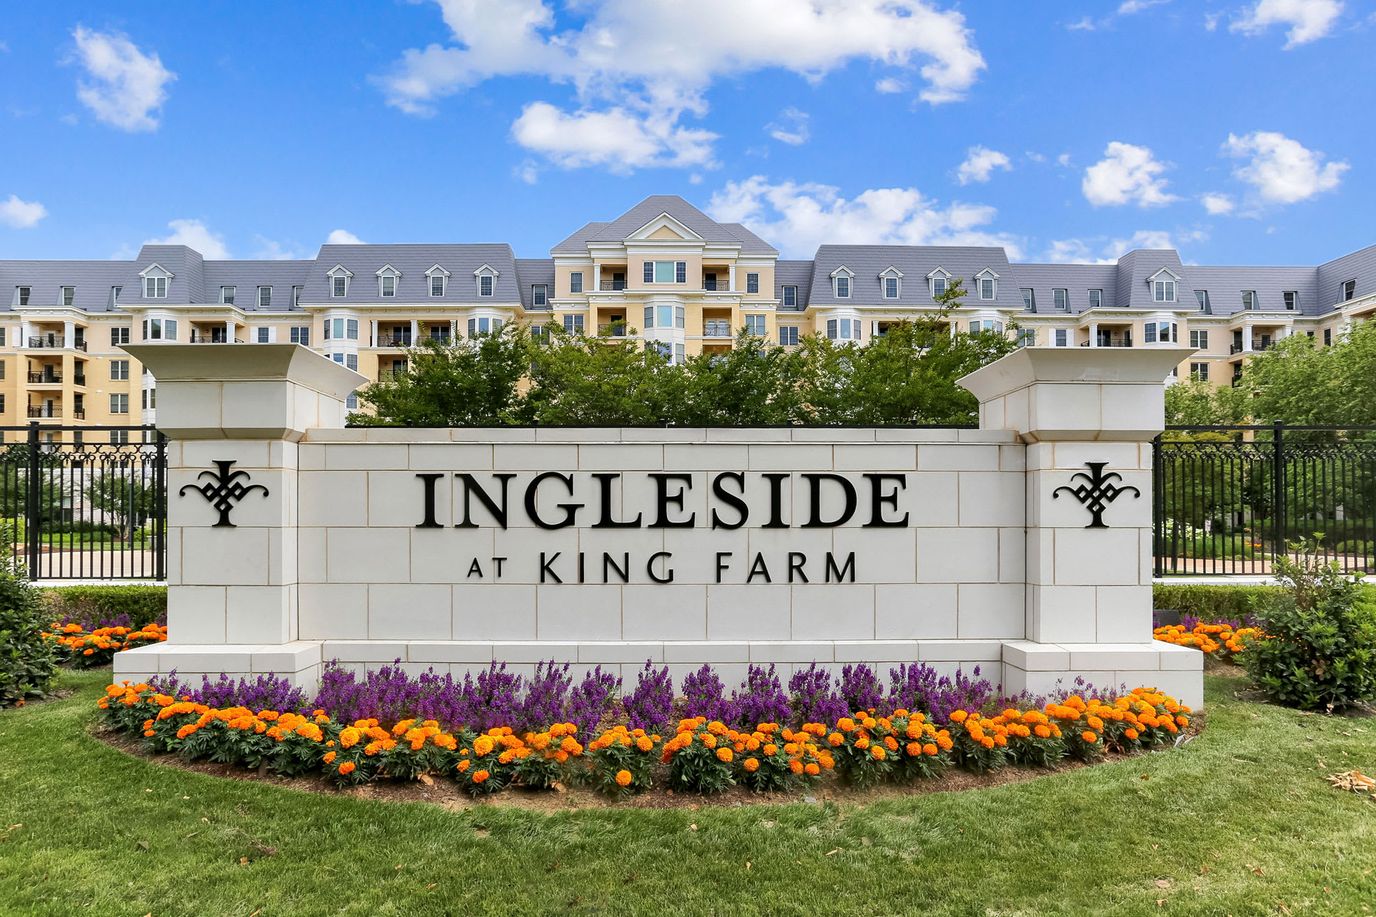


If you’re looking at Ingleside at King Farm in Rockville, you’re looking at a pretty well-organized facility. It’s located right in the King Farm neighborhood, and with a Walk Score of 73, it’s actually walkable; a rare and appreciated feature for a facility like this. Plus, it’s less than a mile and a half from Adventist HealthCare Shady Grove Medical Center, which is a major comfort factor if health needs shift suddenly.
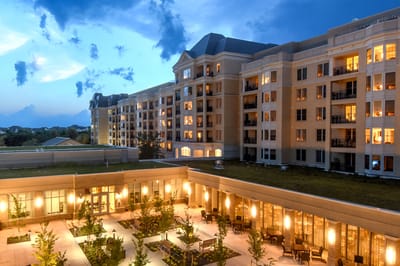
The facility itself is a 45-bed building managed by the Westminster Ingleside King Farm team. They handle everything from nursing and assisted living to memory care and independent living, which is helpful because you don’t have to move if your care needs change. Their occupancy is at 92.2%, and the average stay is 139 days, suggesting they balance short-term rehab with long-term residents.
Most telling are the care hours: they provide 6 hours and 21 minutes of nursing care per resident every day. That’s a significant amount of attention for a facility this size. Kenya Bryant, the Executive Director, is currently working toward her license as a nursing home administrator, which adds another layer of professional oversight.
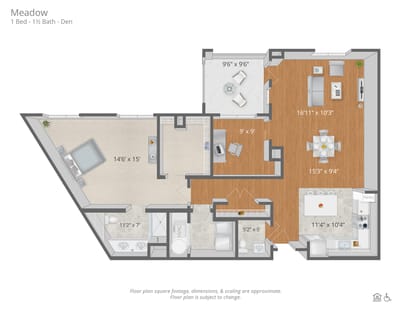
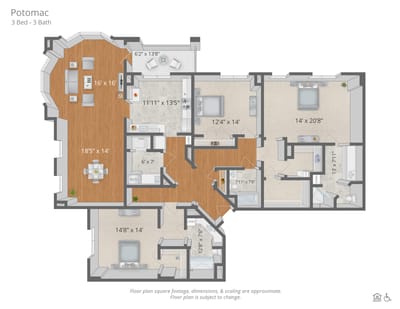
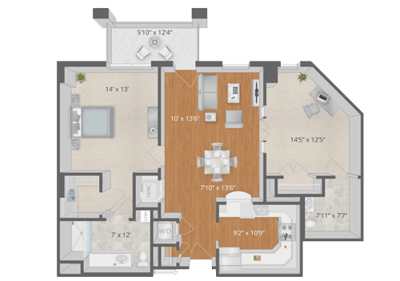
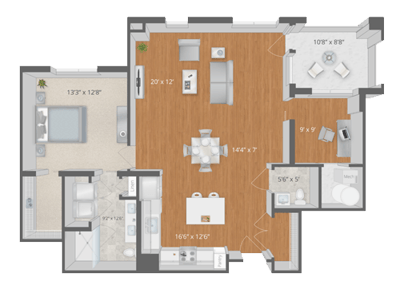
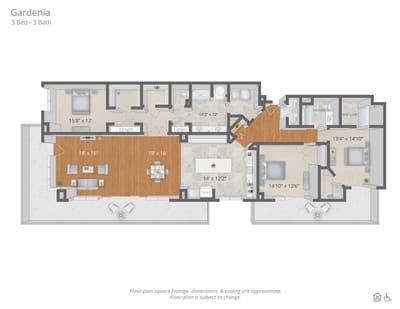
Financially, studios start at $3,638 per month, and you can scale up to $5,812 for a two-bedroom unit. They offer one-bedroom and one-bedroom-plus-den options in between, with units reaching up to 1,799 square feet. They accept both Medicare and private pay.
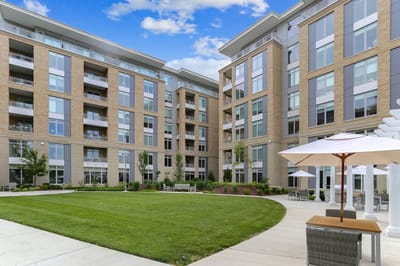
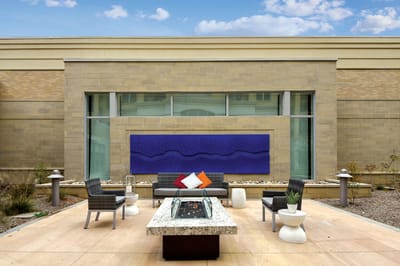
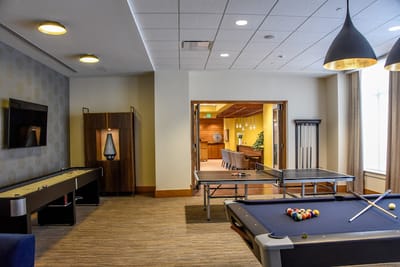
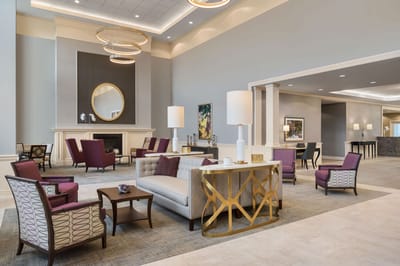
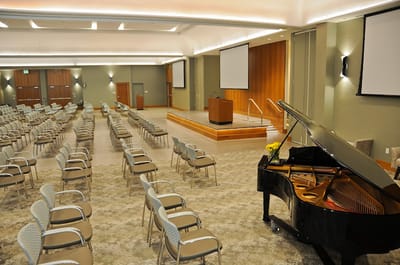
They have a heated indoor pool, a fitness center, and a cultural arts center. There’s an art studio, a library, and a dedicated meditation space. You’ll also find a coffee shop, a wellness center with an on-site doctor, and a courtyard with water features and a fire pit. It’s a pet-friendly community, and they even provide transportation and have a Social Day Program, which makes the whole living experience feel much more connected.
What really stands out, though, are the certifications. They have CARF accreditation, SageCare Platinum, and specific LGBTQ+ Long-Term Care Equality recognition. They’ve also landed on the “Great Place to Work” and “Fortune’s Best Workplaces in Aging Services” lists. If you’re prioritizing a place that has a full care continuum, keeps a dense amenity schedule, and has verified, institutional commitments to inclusive care, Ingleside is one of the more credible options in the Rockville area.
| Staff type | Hours / Day / Resident | vs state avg |
|---|---|---|
|
Registered Nurse (RN)
| 1h 15m per day | ▲ 54% State avg: 49m per day · National avg: 41m per day |
|
LPN / LVN
| 1h 7m per day | ▲ 22% State avg: 55m per day · National avg: 52m per day |
|
Nurse Aide
| 3h 5m per day | ▲ 43% State avg: 2h 9m per day · National avg: 2h 20m per day |
|
Weekend Total Nursing
| 5h 5m per day | ▲ 47% State avg: 3h 28m per day · National avg: 3h 26m per day |
|
Physical Therapist
| 3m per day | ▼ 41% State avg: 5m per day · National avg: 4m per day |
|
Weekend RN
| 1h 12m per day | ▲ 94% State avg: 37m per day · National avg: 28m per day |
Reporting period: October 1 – December 31, 2025 (Q4 2025). Source: CMS Payroll-Based Journal report.
Manages medical care and health needs.
Assists with medical care and medications.
Helps with daily care and mobility.
Total hours from contractors
1,467 contractor hours this quarter
| Certified Nursing Assistant | 55 | 0 | 55 | 9,405 | 92 | 100% | 7 |
| Licensed Practical Nurse | 16 | 0 | 16 | 3,058 | 91 | 99% | 7.9 |
| Registered Nurse | 17 | 0 | 17 | 2,468 | 92 | 100% | 7.9 |
| Other Dietary Services Staff | 9 | 0 | 9 | 1,057 | 88 | 96% | 7.9 |
| Clinical Nurse Specialist | 2 | 0 | 2 | 960 | 66 | 72% | 8.3 |
| Physical Therapy Assistant | 0 | 2 | 2 | 523 | 66 | 72% | 5 |
| Other Social Services Staff | 1 | 0 | 1 | 464 | 58 | 63% | 8 |
| Mental Health Service Worker | 1 | 0 | 1 | 456 | 57 | 62% | 8 |
| Nurse Practitioner | 1 | 0 | 1 | 404 | 51 | 55% | 7.9 |
| Administrator | 1 | 0 | 1 | 400 | 50 | 54% | 8 |
| RN Director of Nursing | 1 | 0 | 1 | 358 | 77 | 84% | 4.6 |
| Occupational Therapy Aide | 0 | 1 | 1 | 216 | 27 | 29% | 8 |
| Speech Language Pathologist | 0 | 2 | 2 | 216 | 62 | 67% | 2.3 |
| Qualified Social Worker | 0 | 1 | 1 | 153 | 49 | 53% | 3.1 |
| Respiratory Therapy Technician | 0 | 3 | 3 | 150 | 43 | 47% | 2.6 |
| Physical Therapy Aide | 0 | 2 | 2 | 95 | 14 | 15% | 6.8 |
| Medical Director | 0 | 1 | 1 | 67 | 27 | 29% | 2.5 |
| Occupational Therapy Assistant | 0 | 1 | 1 | 47 | 25 | 27% | 1.9 |
Federal penalties imposed by CMS for regulatory violations, including civil money penalties (fines) and denials of payment for new Medicare/Medicaid admissions.
Source: CMS Penalties Database
No penalties in the past 3 years
No civil money penalties or payment denials were reported in the last 3 years.
These measures show how residents usually do over time at this home, based on health outcomes and preventive care.
Maryland average: 12.9
Maryland average: 25.7
Maryland average: 23.7%
Maryland average: 27.7%
Maryland average: 25.9%
Maryland average: 2.3%
Maryland average: 6.5%
Maryland average: 1.6%
Maryland average: 5.8%
Maryland average: 20.2%
Maryland average: 12.9%
Maryland average: 92.0%
Maryland average: 96.6%
Maryland average: 1.32
Maryland average: 1.21
Maryland average: 78.4%
Maryland average: 1.4%
Maryland average: 80.6%
Maryland average: 21.2%
Maryland average: 9.9%
Maryland average: 0.8%
Maryland average: 53.7%
Maryland average: 50.6%
Quality measures are calculated from Minimum Data Set (MDS) assessments. For most measures, lower percentages indicate better care quality.
72% of new residents, usually for short-term rehab.
28% of new residents, often for short stays.
Source: CMS Long-Term Care Facility Characteristics (Data as of Jan 2026)
Residents meet regularly to discuss policies, care quality, and activities
Part of a Continuing Care Retirement Community offering multiple care levels
Organized group of residents that meets regularly to discuss facility policies, quality of life, and activities.
Data sourced from CMS Long-Term Care Facility Characteristics quarterly report. Payer mix reflects the current resident census by primary payment source.
Historical financial and operational data for Ingleside at King Farm from 2011–2023, based on CMS SNF Cost Reports.
Key figures below are for fiscal year ending in 12/2023.
Based on CMS SNF Cost Report for fiscal year ending in 12/2023.
Pets Allowed
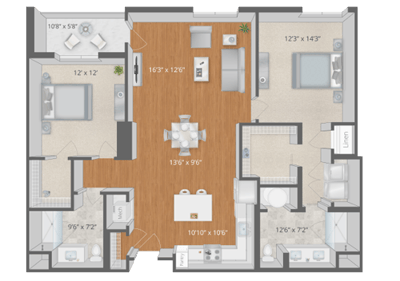
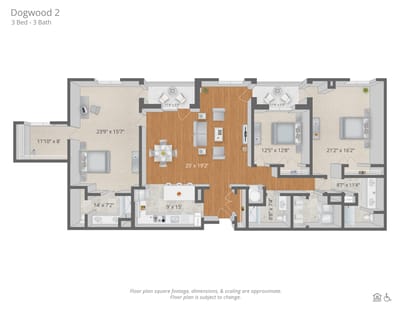
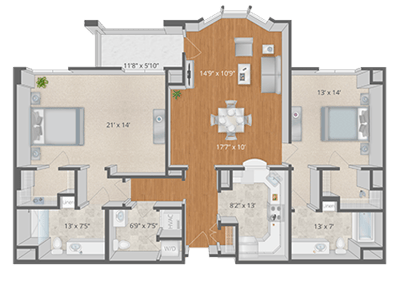
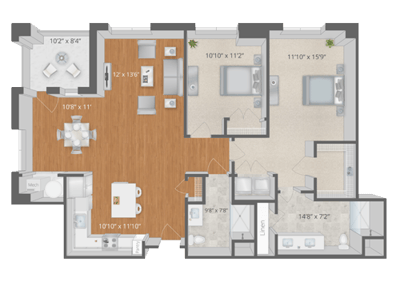
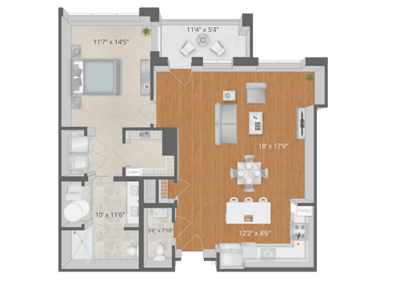
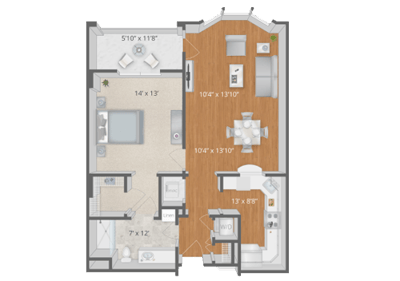
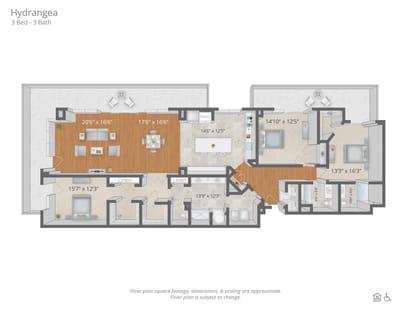
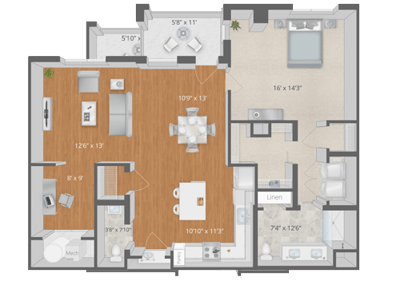
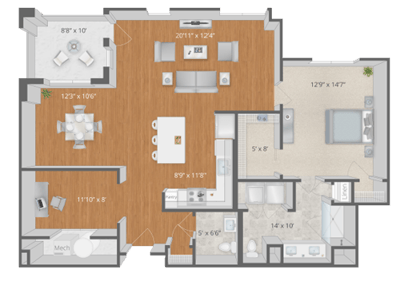
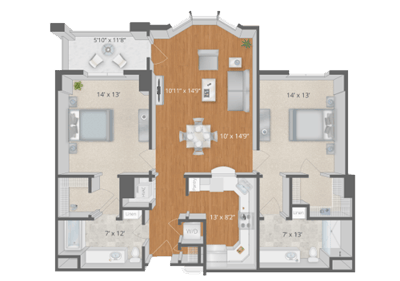
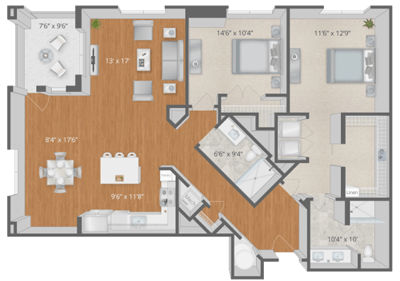
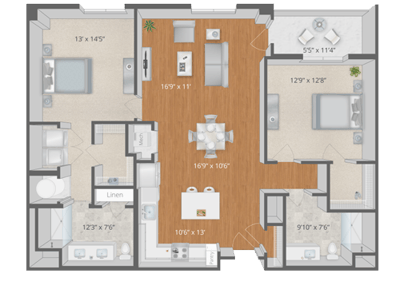
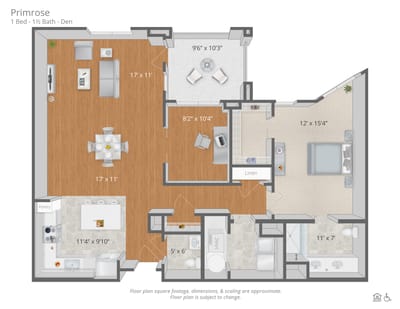
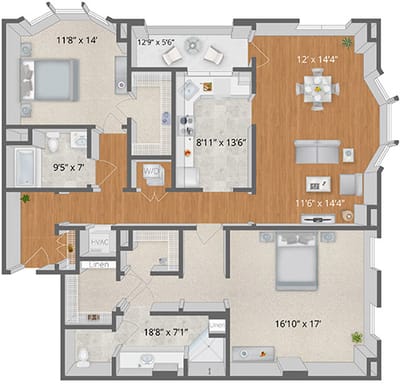
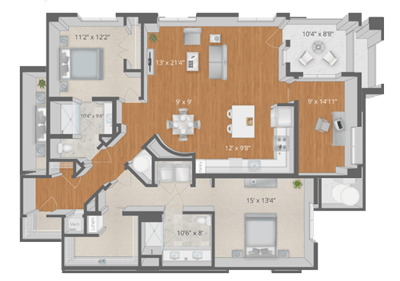
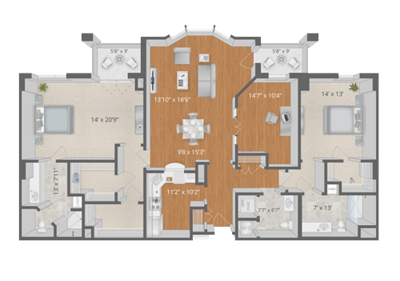
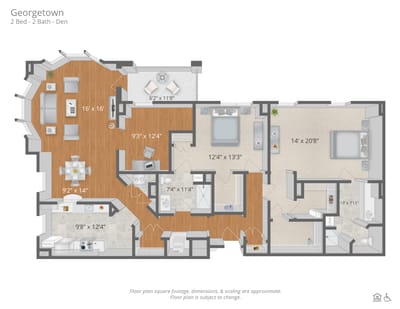
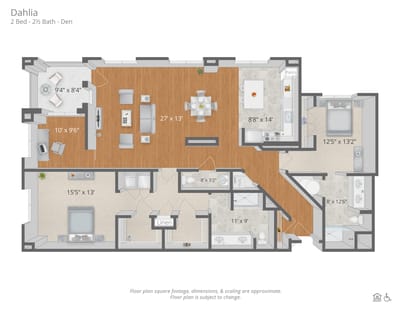
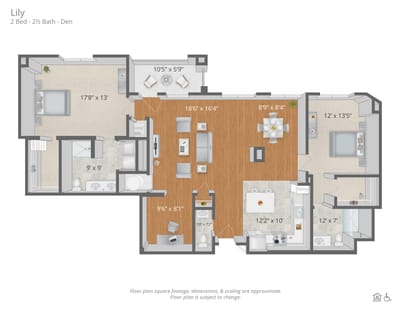
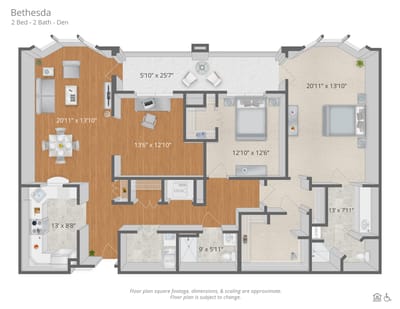
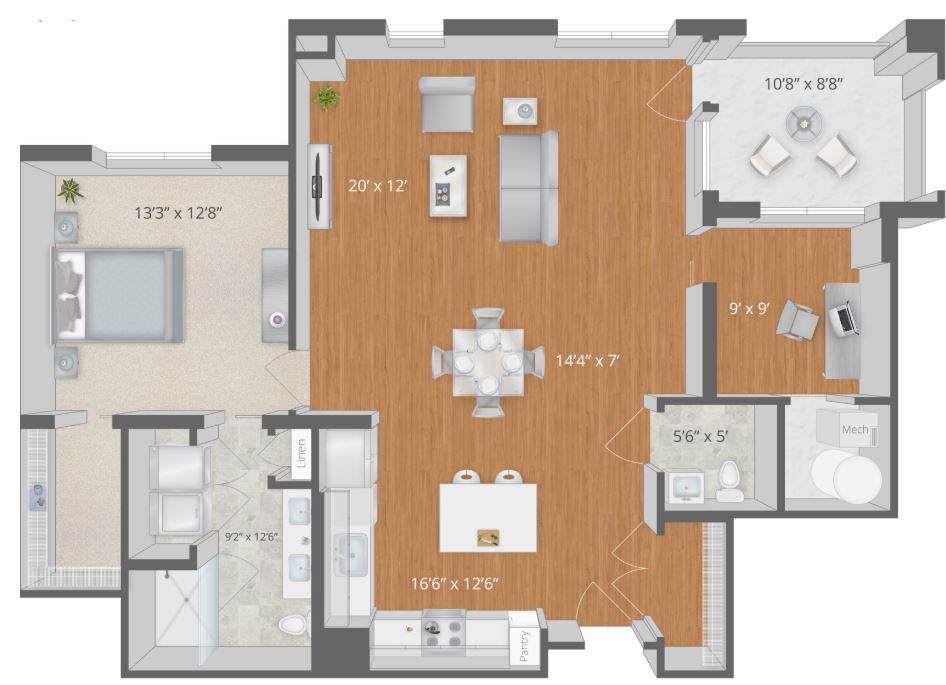
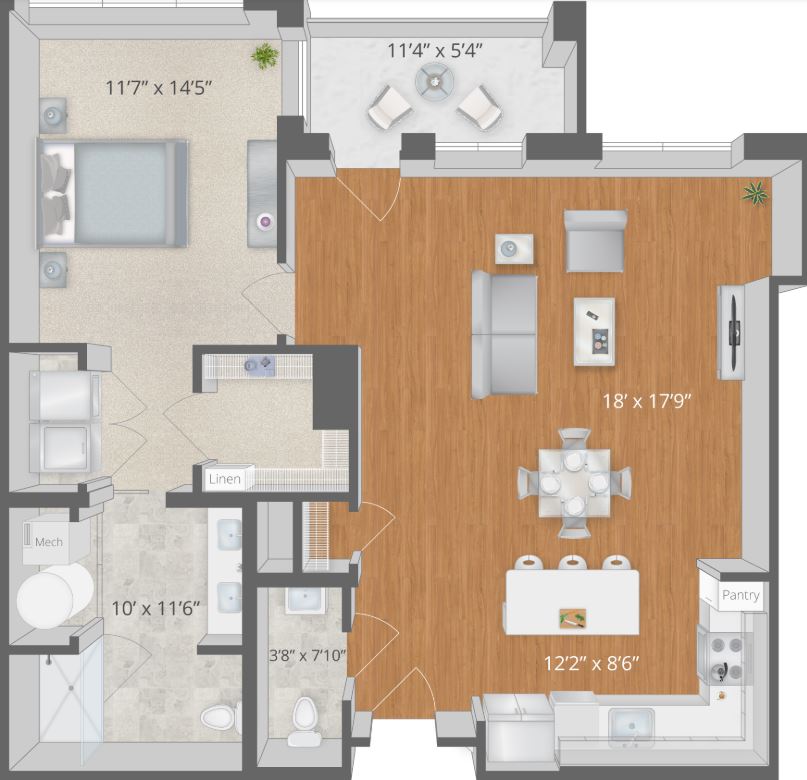
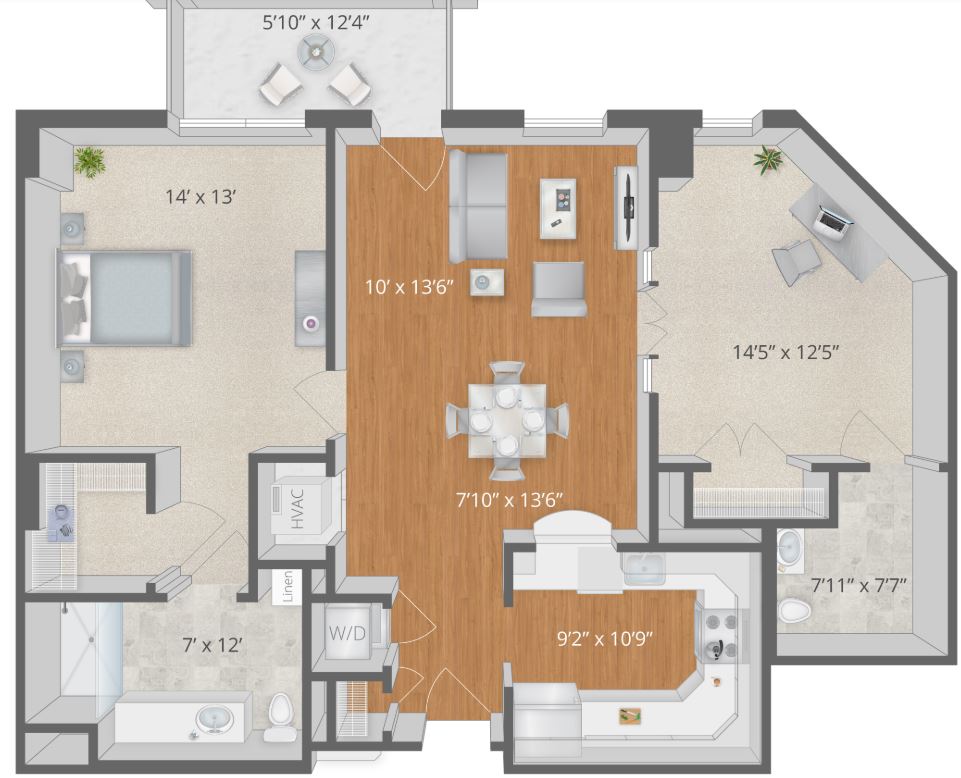
Room Sizes: 845 / 882 / 902 / 935 - 1,799 sq. ft
Housing Options: 1 Bed / 2 Bed
Building Type: Mid-rise
Transportation Services
Fitness and Recreation
Most residents typically stay for a few weeks or months before returning home or moving on.
Most new residents arrive under Medicare (72% of admissions), and a typical Medicare stay runs around 20 days.
Coverage residents most often arrive under.
Coverage residents most often leave under.
Kenya Bryant serves as Executive Director at Ingleside at King Farm, leading a thriving, engaging, and inclusive community. She holds a Bachelor of Science in Computer Information Systems and Business Administration and is completing an administrator in training program for her nursing home administrator license. Kenya is a certified Dementia Practitioner and trainer, and brings extensive leadership experience from previous roles including Interim Executive Director at The View at Alexandria.
![]() 2.4 miles from city center
2.4 miles from city center
![]() Estimated distance in miles from Rockville's city center to Ingleside at King Farm's address, calculated via Google Maps.
— 1.48 miles to nearest hospital (Adventist HealthCare Shady Grove Medical Center)
Estimated distance in miles from Rockville's city center to Ingleside at King Farm's address, calculated via Google Maps.
— 1.48 miles to nearest hospital (Adventist HealthCare Shady Grove Medical Center)
Add your location
Info below is compiled from CMS reports & the MD Dept. of Health (OHCQ), senior community websites & trusted data sources such as Walk Score & BBB.
Communities are listed from highest to lowest based on our ranking methodology.
| Ingleside at King Farm | NH AL IL MC SNF | Rockville (King Farm) | 45
Facility
45
MD AVG
42
Rank
#219 / 685 |
73.8%
Facility
73.8%
MD AVG
80.3
Rank
#75 / 97 | -8% | 6.36
Facility
6.36
MD AVG
3.77
Rank
#6 / 125 | +5% | +68% | $0
Facility
$0
MD AVG
$65.0k
Rank
#1 / 127 | 16
Facility
16
MD AVG
49.9
Rank
#7 / 127 | 8.0
Facility
8.0
MD AVG
12.8
Rank
#33 / 127 | - | 33 | - |
73
Facility
73
MD AVG
43
Rank
#152 / 985 | Westminster Ingleside King Farm Retirement Communities Inc | $44.3MFiscal year ending 12/2023
Facility
$44.3MFiscal year ending 12/2023
MD AVG
$18.7M
Rank
#7 / 126 | $14.8MFiscal year ending 12/2023
Facility
$14.8MFiscal year ending 12/2023
MD AVG
$6.5M
Rank
#19 / 126 | 33.4%Fiscal year ending 12/2023
Facility
33.4%Fiscal year ending 12/2023
MD AVG
38.5%
Rank
#121 / 126 | 215353 | ||||
| Tuckerman Rehabilitation & Healthcare Center | NH PC RC SNF | Rockville | 41
Facility
41
MD AVG
42
Rank
#224 / 685 |
90.7%
Facility
90.7%
MD AVG
80.3
Rank
#35 / 97 | +13% | 2.88
Facility
2.88
MD AVG
3.77
Rank
#118 / 125 | +43% | -24% | $0
Facility
$0
MD AVG
$65.0k
Rank
#1 / 127 | 23
Facility
23
MD AVG
49.9
Rank
#17 / 127 | 4.6
Facility
4.6
MD AVG
12.8
Rank
#6 / 127 | - | 37 | - |
39
Facility
39
MD AVG
43
Rank
#534 / 985 | Calanthia Green | $6.6M*Fiscal year ending 12/2022These figures are from this home's most recent complete cost report — an older period than most facilities report. Compare with that in mind.
Facility
$6.6M*Fiscal year ending 12/2022These figures are from this home's most recent complete cost report — an older period than most facilities report. Compare with that in mind.
MD AVG
$18.7M
Rank
#121 / 126 | $2.6M*Fiscal year ending 12/2022These figures are from this home's most recent complete cost report — an older period than most facilities report. Compare with that in mind.
Facility
$2.6M*Fiscal year ending 12/2022These figures are from this home's most recent complete cost report — an older period than most facilities report. Compare with that in mind.
MD AVG
$6.5M
Rank
#124 / 126 | 39.8%*Fiscal year ending 12/2022These figures are from this home's most recent complete cost report — an older period than most facilities report. Compare with that in mind.
Facility
39.8%*Fiscal year ending 12/2022These figures are from this home's most recent complete cost report — an older period than most facilities report. Compare with that in mind.
MD AVG
38.5%
Rank
#77 / 126 | 215320 | ||||
| Revitz House | NH AL HC IL MC SNF | Rockville | 558
Facility
558
MD AVG
42
Rank
#1 / 685 |
67.8%
Facility
67.8%
MD AVG
80.3
Rank
#80 / 97 | -16% | 3.91
Facility
3.91
MD AVG
3.77
Rank
#36 / 125 | -37% | +4% | $0
Facility
$0
MD AVG
$65.0k
Rank
#1 / 127 | 25
Facility
25
MD AVG
49.9
Rank
#21 / 127 | 8.3
Facility
8.3
MD AVG
12.8
Rank
#36 / 127 | - | 378 | - |
81
Facility
81
MD AVG
43
Rank
#86 / 985 | Alison Baraf | $57.8MFiscal year ending 12/2023
Facility
$57.8MFiscal year ending 12/2023
MD AVG
$18.7M
Rank
#4 / 126 | $42.1MFiscal year ending 12/2023
Facility
$42.1MFiscal year ending 12/2023
MD AVG
$6.5M
Rank
#4 / 126 | 72.9%Fiscal year ending 12/2023
Facility
72.9%Fiscal year ending 12/2023
MD AVG
38.5%
Rank
#29 / 126 | 215071 | ||||
| Autumn Lake Healthcare at Oak Manor | NH MC PC RC SNF | Burtonsville (Perrywood Estates) | 145
Facility
145
MD AVG
42
Rank
#45 / 685 |
90.6%
Facility
90.6%
MD AVG
80.3
Rank
#36 / 97 | +13% | 3.48
Facility
3.48
MD AVG
3.77
Rank
#61 / 125 | -48% | -8% | $11.4k
Facility
$11.4k
MD AVG
$65.0k
Rank
#86 / 127 | 36
Facility
36
MD AVG
49.9
Rank
#48 / 127 | 7.2
Facility
7.2
MD AVG
12.8
Rank
#22 / 127 | 1 | 131 | - |
18
Facility
18
MD AVG
43
Rank
#756 / 985 | 3415 Greencastle Road Holdco LLC | $19.0MFiscal year ending 12/2023
Facility
$19.0MFiscal year ending 12/2023
MD AVG
$18.7M
Rank
#55 / 126 | $3.2MFiscal year ending 12/2023
Facility
$3.2MFiscal year ending 12/2023
MD AVG
$6.5M
Rank
#36 / 126 | 16.6%Fiscal year ending 12/2023
Facility
16.6%Fiscal year ending 12/2023
MD AVG
38.5%
Rank
#19 / 126 | 215315 | ||||
| Sterling Care Rockville Nursing | NH HOS PC RC SNF | Rockville | 100
Facility
100
MD AVG
42
Rank
#109 / 685 |
83.9%
Facility
83.9%
MD AVG
80.3
Rank
#61 / 97 | +4% | 3.10
Facility
3.10
MD AVG
3.77
Rank
#104 / 125 | -36% | -18% | $0
Facility
$0
MD AVG
$65.0k
Rank
#1 / 127 | 21
Facility
21
MD AVG
49.9
Rank
#16 / 127 | 21.0
Facility
21.0
MD AVG
12.8
Rank
#114 / 127 | - | 84 | - |
16
Facility
16
MD AVG
43
Rank
#772 / 985 | - | $13.6MFiscal year ending 12/2023
Facility
$13.6MFiscal year ending 12/2023
MD AVG
$18.7M
Rank
#65 / 126 | $5.2MFiscal year ending 12/2023
Facility
$5.2MFiscal year ending 12/2023
MD AVG
$6.5M
Rank
#113 / 126 | 38.1%Fiscal year ending 12/2023
Facility
38.1%Fiscal year ending 12/2023
MD AVG
38.5%
Rank
#124 / 126 | 215107 |
Ingleside at King Farm is located in Rockville, Maryland.
Here are the financial assistance programs available to residents in Maryland.
Ingleside at King Farm is in the King Farm neighborhood of Rockville.
Ingleside at King Farm has a walk score of 73. Very walkable. Most errands can be accomplished on foot, and many essentials are within a short walk.
Ingleside at King Farm's occupancy is 92.2%.
Yes — see the floorplan options available at Ingleside at King Farm on this page.
Yes, Ingleside at King Farm allows residents to bring their pets.
Ingleside at King Farm is registered as a non-profit in MD.
Yes — there are 36 photos of Ingleside at King Farm in the photo gallery on this page.
Care Cost Calculator: See Prices in Your Area
Nursing Home Data Explorer
Don’t Wait Too Long: 7 Red Flag Signs Your Parent Needs Assisted Living Now
The True Cost of Assisted Living in 2025 – And How Families Are Paying For It
Understanding Senior Living Costs: Pricing Models, Discounts & Financial Assistance


