


Occupancy rate
93%
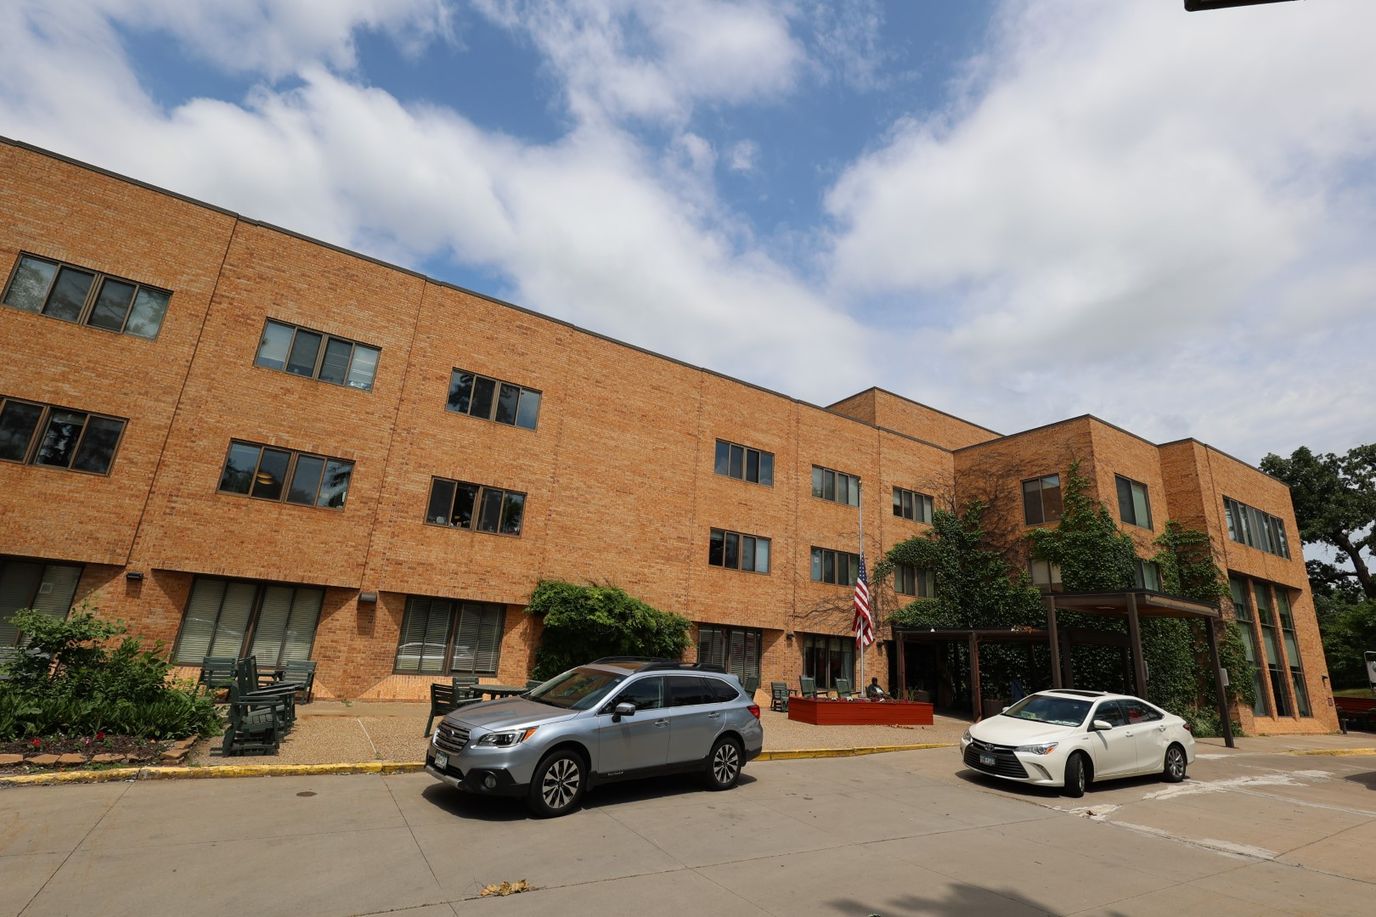


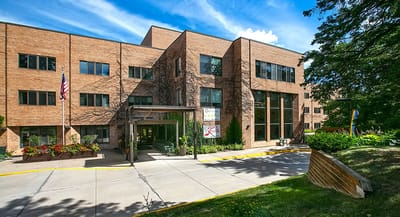


Jones-Harrison Senior Living in Minneapolis, MN is a boutique-style senior living community, offering various senior lifestyle options, including independent living, assisted living, memory care, and transitional care. The community also provides other services, such as long-term care, rehabilitation therapies, transitional care, and 24-hour nursing care – all designed to help seniors with specific needs to live an elevated living experience. Serving generations of families for over 136 years, the community warrants excellence in delivering senior living experiences founded on years of experience and knowledge.
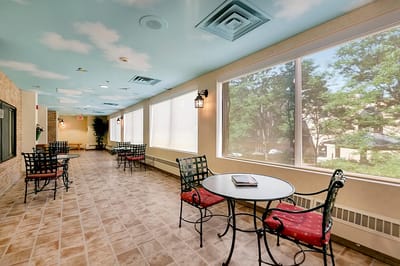
Residents here indulge in a relaxed lifestyle with all the comforts of home and the experiences they need to live a full, connected, and active life. A wide variety of dynamic and unique programs are available to enrich and nurture residents’ overall wellness, including physical, social, and emotional aspects. Here, residents’ individuality is considered in every aspect of their living experience, helping them live a lifestyle that’s tailored to their needs and preferences.
Staffing hours
![]() Daily nursing hours per resident by staff type, reported to CMS. Higher is generally better — compare this facility to state and national averages to see where staffing stands.
Daily nursing hours per resident by staff type, reported to CMS. Higher is generally better — compare this facility to state and national averages to see where staffing stands.
Hours per resident per day vs Minnesota averages
Total nursing care
![]() This home is ranked 21st out of 66 homes in Minnesota for nurse hours. Total adjusted nursing hours per resident per day, combining RN, LPN, and aide time. CMS adjusts this for case-mix so facilities can be fairly compared.
This home is ranked 21st out of 66 homes in Minnesota for nurse hours. Total adjusted nursing hours per resident per day, combining RN, LPN, and aide time. CMS adjusts this for case-mix so facilities can be fairly compared.
5h 6m
7% above state avg1 of 6 metrics below state avg
In Minnesota, the Department of Health, Health Regulation Division is the primary authority for conducting onsite inspections and reporting on the quality of care in residential facilities.
Deficiencies
| This Facility | MN Average | vs. MN Avg |
|---|---|---|---|
|
Total deficiencies
| 9 | 10 | This facility has 10% fewer total deficiencies than a typical Minnesota nursing home (9 vs. MN avg 10).↓ 10% better |
|
Deficiencies per inspection
| 9.0 | 10 | This facility has 10% fewer deficiencies per inspection than a typical Minnesota nursing home (9 vs. MN avg 10).↓ 10% better |
Inspections
| This Facility | MN Average | vs. MN Avg |
|---|---|---|---|
|
Total inspections
| 1 | 1 | This facility has total inspections in line with the Minnesota average (1 vs. MN avg 1).— At avg |
Minnesota average 6
Last Health inspection on Jul 2025
Minnesota average 23.2
Minnesota average 3.76
Health citations are formal notices following inspections when they fail to comply with safety and care standards.
28 of 35 citations resulted from standard inspections; 6 of 35 resulted from complaint investigations; and 1 of 35 came from combined inspections (standard and complaint).
Minnesota average: 0.7
Minnesota average: 0.5
Reporting period: October 1 – December 31, 2025 (Q4 2025). Source: CMS Payroll-Based Journal report.
Manages medical care and health needs.
Assists with medical care and medications.
Helps with daily care and mobility.
Total hours from contractors
2,712 contractor hours this quarter
| Certified Nursing Assistant | 80 | 0 | 80 | 26,192 | 92 | 100% | 7.4 |
| Registered Nurse | 36 | 0 | 36 | 11,197 | 92 | 100% | 8.4 |
| Licensed Practical Nurse | 20 | 0 | 20 | 6,303 | 92 | 100% | 7.9 |
| Clinical Nurse Specialist | 7 | 0 | 7 | 3,075 | 66 | 72% | 8 |
| Other Social Services Staff | 4 | 0 | 4 | 1,646 | 77 | 84% | 7.8 |
| Mental Health Service Worker | 3 | 0 | 3 | 1,162 | 64 | 70% | 7.9 |
| Speech Language Pathologist | 0 | 5 | 5 | 1,022 | 75 | 82% | 7.6 |
| Respiratory Therapy Technician | 0 | 8 | 8 | 533 | 53 | 58% | 7.2 |
| Physical Therapy Assistant | 0 | 7 | 7 | 501 | 54 | 59% | 5.8 |
| Administrator | 1 | 0 | 1 | 492 | 62 | 67% | 7.9 |
| Occupational Therapy Aide | 1 | 0 | 1 | 464 | 58 | 63% | 8 |
| Dental Services Staff | 1 | 0 | 1 | 450 | 60 | 65% | 7.5 |
| Nurse Practitioner | 1 | 0 | 1 | 440 | 55 | 60% | 8 |
| Other Dietary Services Staff | 1 | 0 | 1 | 392 | 52 | 57% | 7.5 |
| Physical Therapy Aide | 0 | 3 | 3 | 378 | 54 | 59% | 6.7 |
| Qualified Social Worker | 0 | 4 | 4 | 200 | 54 | 59% | 3.4 |
| Occupational Therapy Assistant | 0 | 1 | 1 | 49 | 14 | 15% | 3.5 |
| Medical Director | 0 | 1 | 1 | 30 | 14 | 15% | 2.1 |
Federal penalties imposed by CMS for regulatory violations, including civil money penalties (fines) and denials of payment for new Medicare/Medicaid admissions.
Source: CMS Penalties Database
No penalties in the past 3 years
No civil money penalties or payment denials were reported in the last 3 years.
These measures show how residents usually do over time at this home, based on health outcomes and preventive care.
Minnesota average: 11.1
Minnesota average: 22.6
Minnesota average: 18.9%
Minnesota average: 23.8%
Minnesota average: 25.0%
Minnesota average: 3.7%
Minnesota average: 5.4%
Minnesota average: 2.7%
Minnesota average: 4.1%
Minnesota average: 4.4%
Minnesota average: 17.2%
Minnesota average: 97.3%
Minnesota average: 96.0%
Minnesota average: 88.9%
Minnesota average: 1.9%
Minnesota average: 82.6%
Quality measures are calculated from Minimum Data Set (MDS) assessments. For most measures, lower percentages indicate better care quality.
36% of new residents, usually for short-term rehab.
60% of new residents, often for short stays.
4% of new residents, often for long-term daily care.
Source: CMS Long-Term Care Facility Characteristics (Data as of Jan 2026)
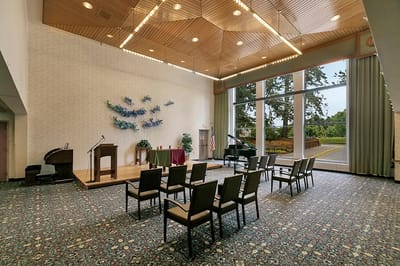
Residents meet regularly to discuss policies, care quality, and activities
Organized group of residents that meets regularly to discuss facility policies, quality of life, and activities.
Data sourced from CMS Long-Term Care Facility Characteristics quarterly report. Payer mix reflects the current resident census by primary payment source.
Historical financial and operational data for Jones-Harrison Senior Living from 2012–2023, based on CMS SNF Cost Reports.
Key figures below are for fiscal year ending in 09/2023.
Based on CMS SNF Cost Report for fiscal year ending in 09/2023.
No pets allowed
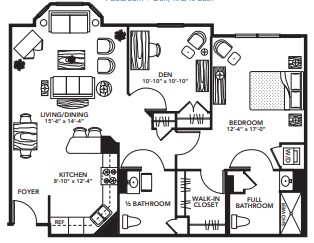
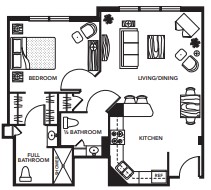
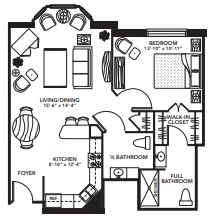
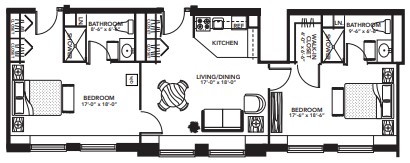
Room Sizes: 365-379 / 416 / 630-650 / 764 / 785 / 825 / 1029-1050 / 1085 sq. ft
Housing Options: Studio / 1 Bed / 2 Bed
Building Type: 3-story
Residents typically stay for brief periods, with frequent admissions and discharges throughout the year.
Most new residents arrive under private pay (60% of admissions), and a typical private pay stay runs around 3 - 4 months.
Coverage residents most often arrive under.
Coverage residents most often leave under.
![]() 3.4 miles from city center
3.4 miles from city center
![]() Estimated distance in miles from Minneapolis's city center to Jones-Harrison Senior Living's address, calculated via Google Maps.
Estimated distance in miles from Minneapolis's city center to Jones-Harrison Senior Living's address, calculated via Google Maps.
Add your location
Info below is compiled from CMS reports & the MN Dept. of Health, senior community websites & trusted data sources such as Walk Score & BBB.
Communities are listed from highest to lowest based on our ranking methodology.
| Redeemer Health Care Center | NH HOS PC RC SNF | Minneapolis (Powderhorn) | 119 | 93.9% | - | 5.23
Facility
5.23
MN AVG
4.77
Rank
#17 / 66 | -28% | +10% | $0
Facility
$0
MN AVG
$47.9k
Rank
#1 / 66 | 25
Facility
25
MN AVG
23.2
Rank
#30 / 66 | 5.0
Facility
5.0
MN AVG
3.8
Rank
#45 / 66 | - | 112 | - | 95 | Danny Colgan | $15.5MFiscal year ending 12/2023
Facility
$15.5MFiscal year ending 12/2023
MN AVG
$11.0M
Rank
#13 / 62 | $9.9MFiscal year ending 12/2023
Facility
$9.9MFiscal year ending 12/2023
MN AVG
$7.2M
Rank
#13 / 62 | 63.5%Fiscal year ending 12/2023
Facility
63.5%Fiscal year ending 12/2023
MN AVG
70.4%
Rank
#27 / 62 | 245520 | ||||
| Jones-Harrison Senior Living | NH AL MC SNF | Minneapolis (Calhoun Isles) | 53 | 92.5% | - | 5.11
Facility
5.11
MN AVG
4.77
Rank
#21 / 66 | +38% | +7% | $0
Facility
$0
MN AVG
$47.9k
Rank
#1 / 66 | 35
Facility
35
MN AVG
23.2
Rank
#45 / 66 | 4.4
Facility
4.4
MN AVG
3.8
Rank
#39 / 66 | - | 49 | - | 56 | Marcia Diracles | $13.5MFiscal year ending 09/2023
Facility
$13.5MFiscal year ending 09/2023
MN AVG
$11.0M
Rank
#20 / 62 | $12.2MFiscal year ending 09/2023
Facility
$12.2MFiscal year ending 09/2023
MN AVG
$7.2M
Rank
#9 / 62 | 90.4%Fiscal year ending 09/2023
Facility
90.4%Fiscal year ending 09/2023
MN AVG
70.4%
Rank
#8 / 62 | 245460 | ||||
| Mount Olivet Careview Home | NH AL MC RESC SNF | Minneapolis (Southwest Minneapolis) | 155 | - | - | 5.39
Facility
5.39
MN AVG
4.77
Rank
#13 / 66 | +20% | +13% | $55.0k
Facility
$55.0k
MN AVG
$47.9k
Rank
#53 / 66 | 18
Facility
18
MN AVG
23.2
Rank
#19 / 66 | 2.3
Facility
2.3
MN AVG
3.8
Rank
#7 / 66 | 1 | 14 | - | 76 | Sharon Flack | $25.6MFiscal year ending 12/2023
Facility
$25.6MFiscal year ending 12/2023
MN AVG
$11.0M
Rank
#4 / 62 | $16.5MFiscal year ending 12/2023
Facility
$16.5MFiscal year ending 12/2023
MN AVG
$7.2M
Rank
#3 / 62 | 64.3%Fiscal year ending 12/2023
Facility
64.3%Fiscal year ending 12/2023
MN AVG
70.4%
Rank
#24 / 62 | 245071 | ||||
| Catholic Eldercare | NH ADC AL IL MC RC SNF | Minneapolis (St. Anthony West) | 164 | 89.6% | - | 4.82
Facility
4.82
MN AVG
4.77
Rank
#28 / 66 | +31% | +1% | $24.3k
Facility
$24.3k
MN AVG
$47.9k
Rank
#43 / 66 | 29
Facility
29
MN AVG
23.2
Rank
#37 / 66 | 4.8
Facility
4.8
MN AVG
3.8
Rank
#43 / 66 | 1 | 147 | - | 82 | John Bauer | $21.0MFiscal year ending 09/2023
Facility
$21.0MFiscal year ending 09/2023
MN AVG
$11.0M
Rank
#7 / 62 | $14.1MFiscal year ending 09/2023
Facility
$14.1MFiscal year ending 09/2023
MN AVG
$7.2M
Rank
#6 / 62 | 67.4%Fiscal year ending 09/2023
Facility
67.4%Fiscal year ending 09/2023
MN AVG
70.4%
Rank
#21 / 62 | 245439 | ||||
| Lakehouse Healthcare and Rehabilitation Center | NH HOS MC RC SNF | S Minneapolis (Southwest Minneapolis) | 260 | 86.1% | - | 3.91
Facility
3.91
MN AVG
4.77
Rank
#50 / 66 | -24% | -18% | $0
Facility
$0
MN AVG
$47.9k
Rank
#1 / 66 | 76
Facility
76
MN AVG
23.2
Rank
#64 / 66 | 5.1
Facility
5.1
MN AVG
3.8
Rank
#48 / 66 | 1 | 224 | - | 81 | Lake Harriet Operator Holdings LLC | $27.1M*Fiscal year ending 12/2022These figures are from this home's most recent complete cost report — an older period than most facilities report. Compare with that in mind. | $18.0M*Fiscal year ending 12/2022These figures are from this home's most recent complete cost report — an older period than most facilities report. Compare with that in mind. | 66.6%*Fiscal year ending 12/2022These figures are from this home's most recent complete cost report — an older period than most facilities report. Compare with that in mind. | 245055 |
Jones-Harrison Senior Living is located in Minneapolis, Minnesota.
Here are the financial assistance programs available to residents in Minnesota.
Jones-Harrison Senior Living is in the Calhoun Isles neighborhood of Minneapolis.
Jones-Harrison Senior Living has a walk score of 56. Moderately walkable. Some errands can be accomplished on foot, with a mix of nearby amenities.
Jones-Harrison Senior Living's occupancy is 93%.
No, Jones-Harrison Senior Living has a no-pet policy.
Jones-Harrison Senior Living is registered as a non-profit in MN.
Jones-Harrison Senior Living has 53 beds.
Jones-Harrison Senior Living has had 9 reported deficiencies since 2025 according to records from Minnesota Dept. of Human Services (DHS).
Care Cost Calculator: See Prices in Your Area
Nursing Home Data Explorer
Don’t Wait Too Long: 7 Red Flag Signs Your Parent Needs Assisted Living Now
The True Cost of Assisted Living in 2025 – And How Families Are Paying For It
Understanding Senior Living Costs: Pricing Models, Discounts & Financial Assistance


