


Total staff
416
Employees
361
Contractors
55
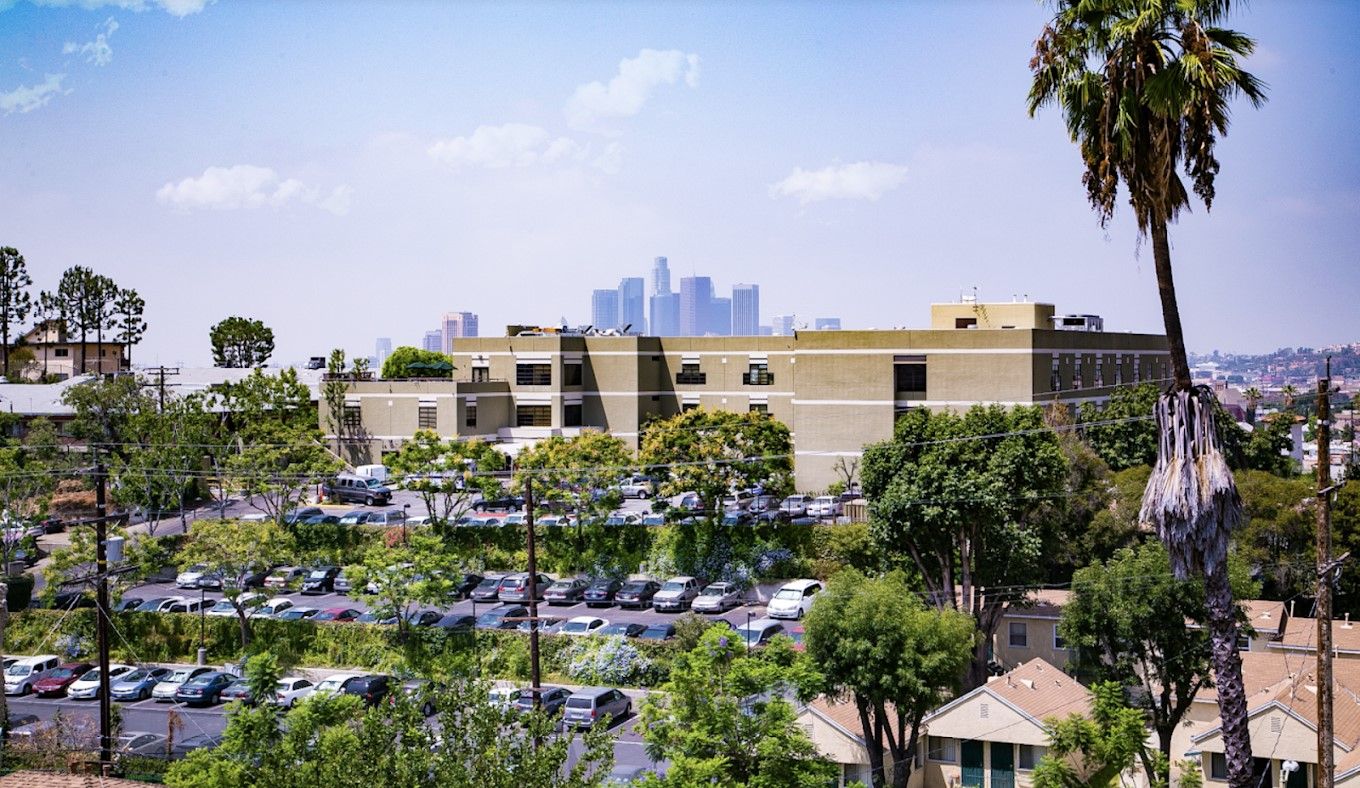
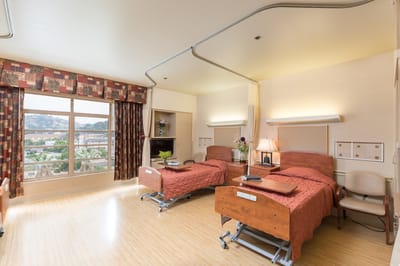
Kei Ai Los Angeles healthcare center is located in close proximity to LAC+USC medical center, providing a reassuring sense of safety and convenience for its residents. This distinguished healthcare center takes pride in providing exceptional care that surpasses the ordinary, with a luxurious standard that sets them apart from the rest. The facility has exceptional customized care plans, meticulously crafted to meet the unique and specific needs of each resident. A range of therapies, including physical therapy, occupational therapy, speech therapy, and caregiver training, are available to ensure comprehensive and holistic care.
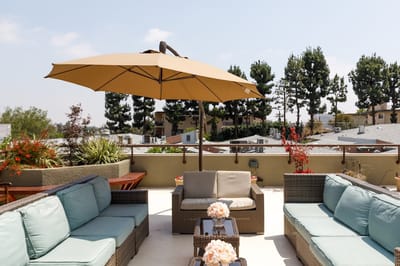
Apart from these therapies, Kei Ai Los Angeles healthcare center offers an array of services such as wound care, IV therapy, dementia care, laboratory testing, bowel and bladder programs, off-site dialysis, nutrition and hydration programs, and more. They also provide an array of engaging activities, such as board games, social events, art therapy, outings, and needlework. At Kei Ai Los Angeles healthcare center, residents can find comfort in the knowledge that they are under the care of compassionate and dedicated professionals.
Staffing hours
![]() Daily nursing hours per resident by staff type, reported to CMS. Higher is generally better — compare this facility to state and national averages to see where staffing stands.
Daily nursing hours per resident by staff type, reported to CMS. Higher is generally better — compare this facility to state and national averages to see where staffing stands.
Hours per resident per day vs California averages
Total nursing care
![]() This home is ranked 73rd out of 289 homes in California for nurse hours. Total adjusted nursing hours per resident per day, combining RN, LPN, and aide time. CMS adjusts this for case-mix so facilities can be fairly compared.
This home is ranked 73rd out of 289 homes in California for nurse hours. Total adjusted nursing hours per resident per day, combining RN, LPN, and aide time. CMS adjusts this for case-mix so facilities can be fairly compared.
4h 33m
8% above state avg3 of 6 metrics below state avg
Reporting period: October 1 – December 31, 2025 (Q4 2025). Source: CMS Payroll-Based Journal report.
Manages medical care and health needs.
Assists with medical care and medications.
Helps with daily care and mobility.
Total hours from contractors
671 contractor hours this quarter
| Certified Nursing Assistant | 187 | 4 | 191 | 71,855 | 92 | 100% | 7.9 |
| Licensed Practical Nurse | 75 | 51 | 126 | 27,623 | 92 | 100% | 8.4 |
| Registered Nurse | 21 | 0 | 21 | 7,611 | 92 | 100% | 7.9 |
| Other Dietary Services Staff | 13 | 0 | 13 | 4,852 | 92 | 100% | 7.4 |
| Clinical Nurse Specialist | 10 | 0 | 10 | 4,460 | 92 | 100% | 8.1 |
| Speech Language Pathologist | 11 | 0 | 11 | 4,321 | 86 | 93% | 6.9 |
| RN Director of Nursing | 7 | 0 | 7 | 3,568 | 92 | 100% | 7.9 |
| Physical Therapy Assistant | 9 | 0 | 9 | 3,113 | 91 | 99% | 7.5 |
| Respiratory Therapy Technician | 8 | 0 | 8 | 3,016 | 81 | 88% | 7.3 |
| Physical Therapy Aide | 7 | 0 | 7 | 2,165 | 80 | 87% | 7.8 |
| Dental Services Staff | 3 | 0 | 3 | 1,337 | 74 | 80% | 7.8 |
| Qualified Social Worker | 3 | 0 | 3 | 1,040 | 89 | 97% | 6.8 |
| Respiratory Therapist | 1 | 0 | 1 | 520 | 72 | 78% | 7.2 |
| Administrator | 1 | 0 | 1 | 512 | 64 | 70% | 8 |
| Nurse Practitioner | 1 | 0 | 1 | 512 | 64 | 70% | 8 |
| Dietitian | 1 | 0 | 1 | 512 | 64 | 70% | 8 |
| Mental Health Service Worker | 1 | 0 | 1 | 512 | 64 | 70% | 8 |
| Therapeutic Recreation Specialist | 1 | 0 | 1 | 477 | 61 | 66% | 7.8 |
| Occupational Therapy Aide | 1 | 0 | 1 | 472 | 60 | 65% | 7.9 |
Includes penalties issued in 2023-2025
Federal penalties imposed by CMS for regulatory violations, including civil money penalties (fines) and denials of payment for new Medicare/Medicaid admissions.
Source: CMS Penalties Database (Data as of Jan 2026)
California average: $55K
California average: 2.4
California average: 0.5
Penalties are imposed by CMS for violations of federal nursing home regulations.
3 penalties in the past 3 years
Multiple penalties were reported in the last 3 years.
Last updated: Jan 2026
These measures show how residents usually do over time at this home, based on health outcomes and preventive care.
California average: 6.6
California average: 11.3
California average: 11.1%
California average: 12.0%
California average: 11.3%
California average: 1.7%
California average: 5.0%
California average: 1.2%
California average: 4.2%
California average: 6.7%
California average: 10.1%
California average: 98.5%
California average: 98.2%
California average: 2.25
California average: 1.59
California average: 94.0%
California average: 1.5%
California average: 93.2%
California average: 23.2%
California average: 11.2%
California average: 0.8%
California average: 53.7%
California average: 50.6%
Quality measures are calculated from Minimum Data Set (MDS) assessments. For most measures, lower percentages indicate better care quality.
18% of new residents, usually for short-term rehab.
61% of new residents, often for short stays.
21% of new residents, often for long-term daily care.
Source: CMS Long-Term Care Facility Characteristics (Data as of Jan 2026)
Residents meet regularly to discuss policies, care quality, and activities
Organized group of residents that meets regularly to discuss facility policies, quality of life, and activities.
Data sourced from CMS Long-Term Care Facility Characteristics quarterly report. Payer mix reflects the current resident census by primary payment source.
Historical financial and operational data for Kei-Ai Los Angeles Healthcare Center from 2012–2023, based on CMS SNF Cost Reports.
Key figures below are for fiscal year ending in 12/2023.
Based on CMS SNF Cost Report for fiscal year ending in 12/2023.
No pets allowed
Building Type: 3-story
Most residents stay long-term, while a smaller portion are admitted for short-term rehab.
Most new residents arrive under private pay (61% of admissions), and a typical private pay stay runs around 2 - 3 months.
Coverage residents most often arrive under.
Coverage residents most often leave under.
![]() 3.1 miles from city center
3.1 miles from city center
![]() Estimated distance in miles from Los Angeles's city center to Kei-Ai Los Angeles Healthcare Center's address, calculated via Google Maps.
— 3.71 miles to nearest hospital (PIH Health Good Samaritan Hospital)
Estimated distance in miles from Los Angeles's city center to Kei-Ai Los Angeles Healthcare Center's address, calculated via Google Maps.
— 3.71 miles to nearest hospital (PIH Health Good Samaritan Hospital)
Add your location
Info below is compiled from CMS reports & the CA Dept. of Social Services (CDSS), senior community websites & trusted data sources such as Walk Score & BBB.
Communities are listed from highest to lowest based on our ranking methodology.
| Angels Nursing Center | NH SNF | Los Angeles (Westlake) | 41
Facility
41
CA AVG
104
Rank
#1196 / 1646 |
90.2%
Facility
90.2%
CA AVG
73.9
Rank
#338 / 1492 | +22% | 4.73
Facility
4.73
CA AVG
4.22
Rank
#53 / 289 | -54% | +12% | $71.6k
Facility
$71.6k
CA AVG
$56.5k
Rank
#267 / 294 | 60
Facility
60
CA AVG
81
Rank
#1332 / 1475 | 42
Facility
42
CA AVG
50.2
Rank
#151 / 291 | 3.8
Facility
3.8
CA AVG
4.6
Rank
#129 / 291 | 4 | 37 | A+ |
92
Facility
92
CA AVG
59
Rank
#137 / 2058 | Aret Akian | $5.8MFiscal year ending 12/2023
Facility
$5.8MFiscal year ending 12/2023
CA AVG
$15.7M
Rank
#251 / 260 | $3.8MFiscal year ending 12/2023
Facility
$3.8MFiscal year ending 12/2023
CA AVG
$8.9M
Rank
#246 / 260 | 65.6%Fiscal year ending 12/2023
Facility
65.6%Fiscal year ending 12/2023
CA AVG
61.1%
Rank
#44 / 260 | 55704 | ||||
| Palazzo Post Acute | NH SNF | Los Angeles (East Hollywood) | 99
Facility
99
CA AVG
104
Rank
#725 / 1646 |
94.0%
Facility
94.0%
CA AVG
73.9
Rank
#237 / 1492 | +27% | 4.46
Facility
4.46
CA AVG
4.22
Rank
#73 / 289 | -25% | +6% | $0
Facility
$0
CA AVG
$56.5k
Rank
#1 / 294 | 62
Facility
62
CA AVG
81
Rank
#1297 / 1475 | 47
Facility
47
CA AVG
50.2
Rank
#173 / 291 | 2.5
Facility
2.5
CA AVG
4.6
Rank
#29 / 291 | 1 | 93 | A+ |
91
Facility
91
CA AVG
59
Rank
#155 / 2058 | Serrano Licensee 1 LLC | $13.0MFiscal year ending 12/2023
Facility
$13.0MFiscal year ending 12/2023
CA AVG
$15.7M
Rank
#147 / 260 | $8.5MFiscal year ending 12/2023
Facility
$8.5MFiscal year ending 12/2023
CA AVG
$8.9M
Rank
#125 / 260 | 65.1%Fiscal year ending 12/2023
Facility
65.1%Fiscal year ending 12/2023
CA AVG
61.1%
Rank
#46 / 260 | 56456 | ||||
| Hollenbeck Palms | NH AL IL MC SNF | Los Angeles (Central La) | 185
Facility
185
CA AVG
104
Rank
#196 / 1646 |
85.4%
Facility
85.4%
CA AVG
73.9
Rank
#443 / 1492 | +16% | 4.84
Facility
4.84
CA AVG
4.22
Rank
#44 / 289 | -11% | +15% | $0
Facility
$0
CA AVG
$56.5k
Rank
#1 / 294 | 89
Facility
89
CA AVG
81
Rank
#521 / 1475 | 39
Facility
39
CA AVG
50.2
Rank
#137 / 291 | 6.5
Facility
6.5
CA AVG
4.6
Rank
#256 / 291 | 1 | 158 | - | 62 | Casey Adams | $21.4MFiscal year ending 06/2024
Facility
$21.4MFiscal year ending 06/2024
CA AVG
$15.7M
Rank
#55 / 260 | $15.8MFiscal year ending 06/2024
Facility
$15.8MFiscal year ending 06/2024
CA AVG
$8.9M
Rank
#21 / 260 | 73.6%Fiscal year ending 06/2024
Facility
73.6%Fiscal year ending 06/2024
CA AVG
61.1%
Rank
#25 / 260 | 55115 | ||||
| Fountainview at Eisenberg Village | NH AL IL SNF | Reseda | 216
Facility
216
CA AVG
104
Rank
#127 / 1646 |
48.1%
Facility
48.1%
CA AVG
73.9
Rank
#1350 / 1492 | -35% | 2.96
Facility
2.96
CA AVG
4.22
Rank
#287 / 289 | +1% | -30% | $0
Facility
$0
CA AVG
$56.5k
Rank
#1 / 294 | 89
Facility
89
CA AVG
81
Rank
#521 / 1475 | 66
Facility
66
CA AVG
50.2
Rank
#236 / 291 | 3.9
Facility
3.9
CA AVG
4.6
Rank
#136 / 291 | - | 104 | - | 49 | Karen Pham | $16.7MFiscal year ending 12/2023
Facility
$16.7MFiscal year ending 12/2023
CA AVG
$15.7M
Rank
#96 / 260 | $8.5MFiscal year ending 12/2023
Facility
$8.5MFiscal year ending 12/2023
CA AVG
$8.9M
Rank
#126 / 260 | 50.6%Fiscal year ending 12/2023
Facility
50.6%Fiscal year ending 12/2023
CA AVG
61.1%
Rank
#176 / 260 | 555716 | ||||
| Kei-Ai Los Angeles Healthcare Center | NH HOS MC RC SNF | Los Angeles (Lincoln Heights) | 300
Facility
300
CA AVG
104
Rank
#55 / 1646 |
97.0%
Facility
97.0%
CA AVG
73.9
Rank
#168 / 1492 | +31% | 4.55
Facility
4.55
CA AVG
4.22
Rank
#73 / 289 | -44% | +8% | $185.0k
Facility
$185.0k
CA AVG
$56.5k
Rank
#293 / 294 | - | 145
Facility
145
CA AVG
50.2
Rank
#288 / 291 | 3.0
Facility
3.0
CA AVG
4.6
Rank
#54 / 291 | 11 | 291 | - |
71
Facility
71
CA AVG
59
Rank
#701 / 2058 | Alal LLC | $33.8MFiscal year ending 12/2023
Facility
$33.8MFiscal year ending 12/2023
CA AVG
$15.7M
Rank
#12 / 260 | $24.9MFiscal year ending 12/2023
Facility
$24.9MFiscal year ending 12/2023
CA AVG
$8.9M
Rank
#2 / 260 | 73.6%Fiscal year ending 12/2023
Facility
73.6%Fiscal year ending 12/2023
CA AVG
61.1%
Rank
#25 / 260 | 555438 |
Kei-Ai Los Angeles Healthcare Center is located in Los Angeles, California.
Here are the financial assistance programs available to residents in California.
Kei-Ai Los Angeles Healthcare Center is in the Lincoln Heights neighborhood.
Kei-Ai Los Angeles Healthcare Center has a walk score of 71. Very walkable. Most errands can be accomplished on foot, and many essentials are within a short walk.
Kei-Ai Los Angeles Healthcare Center's occupancy is 83.3%.
No, Kei-Ai Los Angeles Healthcare Center has a no-pet policy.
Kei-Ai Los Angeles Healthcare Center is registered as a for-profit.
Yes — there are 4 photos of Kei-Ai Los Angeles Healthcare Center in the photo gallery on this page.
Kei-Ai Los Angeles Healthcare Center is located at 2221 Lincoln Park Ave, Los Angeles, CA 90031.
Care Cost Calculator: See Prices in Your Area
Nursing Home Data Explorer
Don’t Wait Too Long: 7 Red Flag Signs Your Parent Needs Assisted Living Now
The True Cost of Assisted Living in 2025 – And How Families Are Paying For It
Understanding Senior Living Costs: Pricing Models, Discounts & Financial Assistance


