Kokomo Healthcare Center
CMS overall rating Info CMS (the Centers for Medicare & Medicaid Services) is the federal agency that rates nursing home quality. Its Overall Rating runs from 1 to 5 stars, combining health inspections, staffing, and quality measures, with inspections weighted most heavily.

Kokomo Healthcare Center

CMS overall rating Info CMS (the Centers for Medicare & Medicaid Services) is the federal agency that rates nursing home quality. Its Overall Rating runs from 1 to 5 stars, combining health inspections, staffing, and quality measures, with inspections weighted most heavily.
Calculator: See prices in your area
Kokomo Healthcare Center accepts Medicare, Medicaid, and private pay.

Overview of Kokomo Healthcare Center

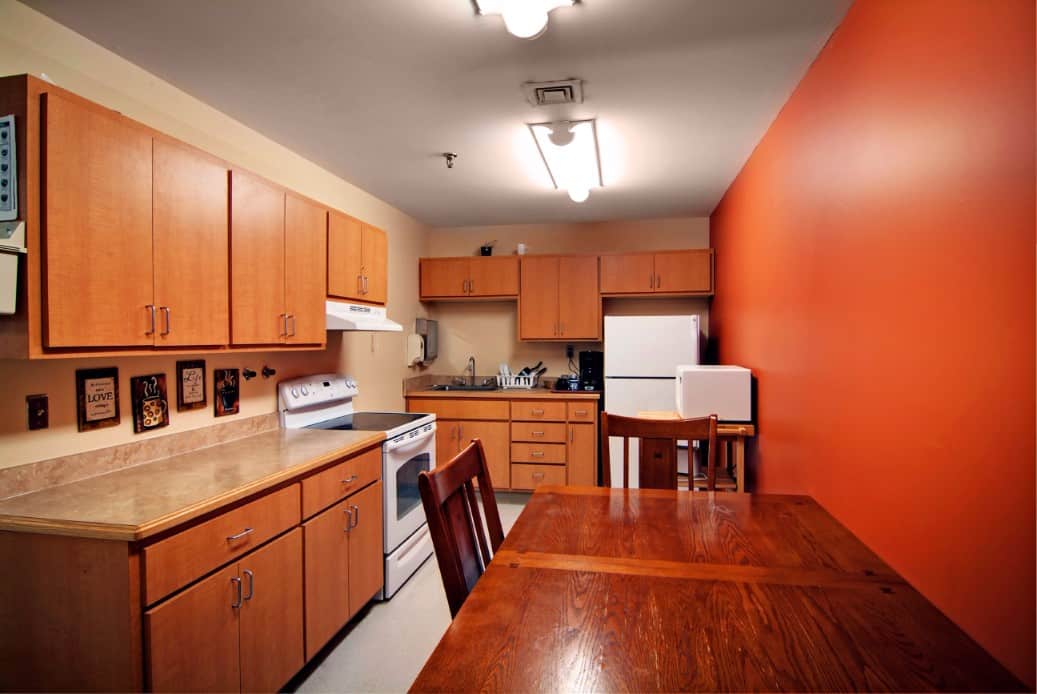
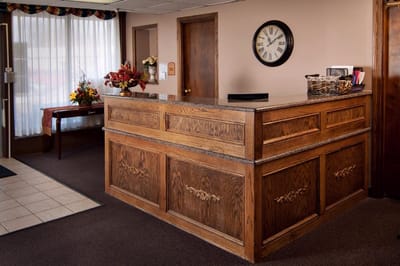
Kokomo Healthcare Center is a nursing home in Kokomo, IN, offering long-term care and rehabilitation. The community also promotes a nurturing and welcoming environment, ensuring older adults are treated well throughout their stay. Residents also experience a worry-free lifestyle with 24-hour care, nutritious meals, and recreational opportunities. Dedicated to understanding residents’ unique needs and habits, the community also follows a person-centered approach to care.

Bingo nights, music performances, and cosmetic parties ensure residents have fun and gain meaningful experiences. With cozy living areas and lively gathering spaces, residents can rest and focus on their recovery. Restaurants, shops, and bus stops are also available in the area, providing residents with quick access to their necessities and leisure. This nursing home has exceptional standards of care and a clean setting, making it one of the trusted options for senior living in Indiana.

(765) 453-5600

Quality ratings

Measured by Centers for Medicare & Medicaid Services (CMS)

Overall rating Info The Overall CMS Rating combines results from health inspections, staffing levels and quality measures. Health inspections carry the most weight. Staffing and quality scores can increase or decrease the final rating based on performance compared to state and national standards.
▼ 2.8% Below IN avg. ▼ 2.8% Below IN avg.IN average: 3.1Click the badge to see the full State ranking.Click here to see the full State ranking.
Health Inspection Info Based on the results of the facility's three most recent standard inspections and any complaint investigations. CMS reviews the number, scope, and severity of deficiencies, with more recent findings weighted more heavily.
▲ 6.8% Above IN avg. ▲ 6.8% Above IN avg.IN average: 2.8Click the badge to see the full State ranking.Click here to see the full State ranking.
Staffing Info Measures average nursing staff hours per resident per day, including Registered Nurses (RNs) and total nursing staff. Ratings are adjusted based on the level of care residents require and are compared to state and national benchmarks.
▼ 59.3% Below IN avg. ▼ 59.3% Below IN avg.IN average: 2.5Click the badge to see the full State ranking.Click here to see the full State ranking.
Quality Measures Info Based on clinical and physical health indicators reported to CMS, such as hospital readmissions, falls, pressure ulcers, and improvements in mobility. These measures reflect how well residents' health needs are being managed.
▲ 22.3% Above IN avg. ▲ 22.3% Above IN avg.IN average: 4.1Click the badge to see the full State ranking.Click here to see the full State ranking.

Staffing hours breakdown

Info Daily nursing hours per resident by staff type, reported to CMS. Higher is generally better — compare this facility to state and national averages to see where staffing stands.

Hours per resident per day — compared to Indiana state averages

Total nursing care / resident Info This home is ranked 188th out of 291 homes in Indiana for nurse hours. Total adjusted nursing hours per resident per day, combining RN, LPN, and aide time. CMS adjusts this for case-mix so facilities can be fairly compared.
3h 9m per day
Rank #188 / 291Nurse hours — State benchmarkedThis home is ranked 188th out of 291 homes in Indiana. Shows adjusted nurse hours per resident per day benchmarked to the Indiana average, with a ranking across 291 Indiana facilities. More hours mean more direct care. The national average is about 3.5 hrs; below 3.0 is a red flag.Ranking totals vary by category as each rank only includes facilities that report data for that metric. Homes missing that data point aren't included in the ranking.Click the rank badge to see the full State ranking.Click here to see the full State ranking.
This facility Indiana avg (3h 26m per day)
vs Indiana avg
-8%

4 of 6 metrics below state avg

Standout metric Physical Therapist is +66% above state avg
Staff typeHours / Day / Residentvs state avg
Registered Nurse (RN) Info RNs hold the highest nursing license and can assess residents, interpret test results, and direct care plans. More RN hours per day often signals stronger clinical oversight and faster response to health changes. 23m per day ▼ 41% State avg: 39m per day · National avg: 41m per day
LPN / LVN Info Licensed Practical Nurses (LPNs) or Licensed Vocational Nurses (LVNs) deliver routine hands-on care — medication administration, wound dressing, and monitoring vital signs. They work under RN supervision and make up a large share of daily bedside care. 1h 4m per day ▲ 35% State avg: 47m per day · National avg: 52m per day
Nurse Aide Info Certified Nurse Aides (CNAs) provide the most direct day-to-day assistance: bathing, dressing, feeding, and mobility. Nurse aide hours are typically the largest staffing category and directly affect residents' quality of life. 2h 6m per day ▼ 7% State avg: 2h 15m per day · National avg: 2h 20m per day
Weekend Total Nursing Info Combined nursing hours (RN + LPN + Nurse Aide) per resident per day on weekends. Staffing often drops on weekends — this figure reveals whether the facility maintains adequate coverage outside of weekday hours. 3h 1m per day ▼ 8% State avg: 3h 16m per day · National avg: 3h 27m per day
Physical Therapist Info Hours per resident per day provided by licensed Physical Therapists (PTs) or PT Assistants. PT services help residents recover mobility after injury or illness and are especially important for post-acute (short-stay) rehabilitation. 6m per day ▲ 66% State avg: 4m per day · National avg: 4m per day
Weekend RN Info Registered nurse hours specifically on weekends. Facilities sometimes reduce RN presence on Saturdays and Sundays — a low weekend RN figure compared to weekday hours can indicate reduced clinical oversight when most administrative staff are absent. 20m per day ▼ 26% State avg: 27m per day · National avg: 29m per day

Capacity and availability

This home usually has limited availability

Higher occupancy than the Indiana average: 69.4%
Occupancy rate
87% Rank #47 / 434Occupancy rate — State benchmarkedThis home is ranked 47th out of 434 homes in Indiana. Shows this facility's occupancy rate versus the Indiana average, with its Statewide rank out of 434. Higher occupancy signals strong local demand and financial stability.Ranking totals vary by category as each rank only includes facilities that report data for that metric. Homes missing that data point aren't included in the ranking.Click the rank badge to see the full State ranking.Click here to see the full State ranking.
Avg. Length of Stay
190 days
Bed community size
80-bed community Rank #328 / 437Bed count — State benchmarkedThis home is ranked 328th out of 437 homes in Indiana. Shows this facility's certified or reported bed count compared to other Indiana facilities. Larger communities may offer more amenities, programs, and on-site services for residents and families.Ranking totals vary by category as each rank only includes facilities that report data for that metric. Homes missing that data point aren't included in the ranking.Click the rank badge to see the full State ranking.Click here to see the full State ranking.
A larger shared setting that may offer more common spaces and organized community services.
Walk Score
Walk Score: 57 / 100 Rank #167 / 587Walk Score — State benchmarkedThis home is ranked 167th out of 587 homes in Indiana. Shows how walkable this facility's neighborhood is compared to the average Walk Score across Indiana facilities. Higher scores benefit residents, families, and staff.Ranking totals vary by category as each rank only includes facilities that report data for that metric. Homes missing that data point aren't included in the ranking.Click the rank badge to see the full State ranking.Click here to see the full State ranking.
Moderately walkable. Some errands can be accomplished on foot, with a mix of nearby amenities.

About this community

Contact Kokomo Healthcare Center

Staffing Data

Reporting period: October 1 – December 31, 2025 (Q4 2025). Source: CMS Payroll-Based Journal report.

Total staff 99
Employees 88
Contractors 11
Staff to resident ratio 1.65 : 1
1649900% more staff per resident than Indiana average
Indiana average ratio: 0.00 : 1 Indiana average ratio: 0.00 : 1See full Indiana ranking
Avg staff/day 39
Average shift 7.2 hours
6% worse than Indiana average
Indiana average: 7.7 hours Indiana average shift: 7.7 hoursSee full Indiana ranking
Total staff hours (quarter) 25,854

Nursing staff breakdown

Q4 2025 · Oct 1 – Dec 31 More info This data comes from the CMS Payroll-Based Journal report covering October 1 – December 31, 2025.
Registered Nurse

Manages medical care and health needs.

RN Staff Info All 9 RN Staff are full-time employees. No contractors work on this role. 9
Average shift length Info Average shift length. Calculated as total hours divided by days worked and average staff per day. 7.9 hours
Licensed Practical Nurse

Assists with medical care and medications.

LPN Staff Info All 15 LPN Staff are full-time employees. No contractors work on this role. 15
Average shift length Info Average shift length. Calculated as total hours divided by days worked and average staff per day. 9.5 hours
Certified Nursing Assistant

Helps with daily care and mobility.

CNA Staff Info All 42 CNA Staff are full-time employees. No contractors work on this role. 42
Average shift length Info Average shift length. Calculated as total hours divided by days worked and average staff per day. 7.1 hours

Contractor staffing

Q4 2025 · Oct 1 – Dec 31 More info This data comes from the CMS Payroll-Based Journal report covering October 1 – December 31, 2025.

Total hours from contractors

7.6%

1,953 contractor hours this quarter

Physical Therapy Aide: 3 Physical Therapy Assistant: 2 Respiratory Therapy Technician: 2 Speech Language Pathologist: 2 Medical Director: 1 Qualified Social Worker: 1

Staff by category

Q4 2025 · Oct 1 – Dec 31 More info This data comes from the CMS Payroll-Based Journal report covering October 1 – December 31, 2025.
Certified Nursing Assistant4204211,23292100%7.1
Licensed Practical Nurse150155,55292100%9.5
Registered Nurse9091,89292100%7.9
Medication Aide/Technician6061,74192100%8.8
RN Director of Nursing2029936874%7.9
Respiratory Therapy Technician0226317885%4.7
Physical Therapy Aide0336017076%5.5
Dietitian1015126470%8
Mental Health Service Worker1014806065%8
Nurse Practitioner1014495762%7.9
Administrator1014485661%8
Speech Language Pathologist0224186368%6.4
Other Dietary Services Staff2023184650%6.9
Occupational Therapy Aide2021892325%7.9
Physical Therapy Assistant0221666975%1.7
Qualified Social Worker011855054%1.7
Medical Director011531415%3.8
Clinical Nurse Specialist505496166%0.6
Occupational Therapy Assistant1014867%8
42 Certified Nursing Assistant
% of Days 100%
15 Licensed Practical Nurse
% of Days 100%
9 Registered Nurse
% of Days 100%
6 Medication Aide/Technician
% of Days 100%
2 RN Director of Nursing
% of Days 74%
2 Respiratory Therapy Technician
% of Days 85%
3 Physical Therapy Aide
% of Days 76%
1 Dietitian
% of Days 70%
1 Mental Health Service Worker
% of Days 65%
1 Nurse Practitioner
% of Days 62%
1 Administrator
% of Days 61%
2 Speech Language Pathologist
% of Days 68%
2 Other Dietary Services Staff
% of Days 50%
2 Occupational Therapy Aide
% of Days 25%
2 Physical Therapy Assistant
% of Days 75%
1 Qualified Social Worker
% of Days 54%
1 Medical Director
% of Days 15%
5 Clinical Nurse Specialist
% of Days 66%
1 Occupational Therapy Assistant
% of Days 7%

Penalties and fines

Federal penalties imposed by CMS for regulatory violations, including civil money penalties (fines) and denials of payment for new Medicare/Medicaid admissions.

Source: CMS Penalties Database

No penalties in the past 3 years

No civil money penalties or payment denials were reported in the last 3 years.

Quality of care over time

These measures show how residents usually do over time at this home, based on health outcomes and preventive care.

High-risk clinical events score Info A composite score based on pressure ulcers, falls with injury, weight loss, walking ability decline, and activities of daily living decline. 3.3
59% better than Indiana average

Indiana average: 8.0

Functional decline score Info A composite score based on activities of daily living decline, walking ability decline, and incontinence. 9.1
46% better than Indiana average

Indiana average: 17.1

Long-stay resident measures
Need for Help with Daily Activities Increased Info Percent of long-stay residents whose need for help with daily activities has increased 3.1%
74% better than Indiana average

Indiana average: 12.0%

Walking Ability Worsened Info Percent of long-stay residents whose ability to move independently worsened 1.7%
88% better than Indiana average

Indiana average: 14.4%

Low Risk Residents with Bowel/Bladder Incontinence Info Percent of low risk long-stay residents who lose control of their bowels or bladder 22.6%
8% better than Indiana average

Indiana average: 24.6%

Falls with Major Injury Info Percent of long-stay residents experiencing one or more falls with major injury 2.8%
29% better than Indiana average

Indiana average: 3.9%

High Risk Residents with Pressure Ulcers Info Percent of long-stay high risk residents with pressure ulcers 4.5%
In line with Indiana average

Indiana average: 4.4%

Urinary Tract Infection Info Percent of long-stay residents with a urinary tract infection 0.0%
100% better than Indiana average

Indiana average: 1.2%

Lost Too Much Weight Info Percent of long-stay residents who lose too much weight 4.4%
23% better than Indiana average

Indiana average: 5.7%

Depressive Symptoms Info Percent of long-stay residents who have depressive symptoms 31.8%
32% worse than Indiana average

Indiana average: 24.1%

Antipsychotic Use Info Percent of long-stay residents who received an antipsychotic medication 5.5%
56% better than Indiana average

Indiana average: 12.4%

Pneumococcal Vaccine Info Percent of long-stay residents assessed and appropriately given the pneumococcal vaccine 97.3%
In line with Indiana average

Indiana average: 93.7%

Influenza Vaccine Info Percent of long-stay residents assessed and appropriately given the seasonal influenza vaccine 98.3%
In line with Indiana average

Indiana average: 95.4%

Short-stay resident measures
Pneumococcal Vaccine Info Percent of short-stay residents assessed and appropriately given the pneumococcal vaccine 63.8%
22% worse than Indiana average

Indiana average: 81.7%

Antipsychotic medication increase Info Percent of short-stay residents who newly received an antipsychotic medication 0.0%
100% better than Indiana average

Indiana average: 1.4%

Influenza Vaccine Info Percent of short-stay residents assessed and appropriately given the seasonal influenza vaccine 70.7%
11% worse than Indiana average

Indiana average: 79.0%

Breakdown by payment type

Medicare

19% of new residents, usually for short-term rehab.

Typical stay 1 - 2 months

Private pay

36% of new residents, often for short stays.

Typical stay 2 - 3 months

Medicaid

45% of new residents, often for long-term daily care.

Typical stay 11 - 12 months

Facility Characteristics

Source: CMS Long-Term Care Facility Characteristics (Data as of Jan 2026)

Total residents 60
Medicare
2
3.3% of residents
Medicaid
55
91.7% of residents
Private pay or other
3
5% of residents
Programs & Services
Residents Group

Residents meet regularly to discuss policies, care quality, and activities

Active Resident Council

Organized group of residents that meets regularly to discuss facility policies, quality of life, and activities.

Finances and operations

Based on CMS SNF Cost Report for fiscal year ending in 06/2024.

Voluntary non-profit community
Operated by a church.
Net patient revenue Info Net patient revenue — what the home actually collects for resident care, after contractual allowances, bad debt and discounts are subtracted from its gross charges (CMS cost report, Worksheet G-3). It covers resident care only; money the home earns from other sources is shown separately as "Other income."
$11.0M
Net patient income Info Net patient income: net patient revenue minus the home's total operating expenses. A positive figure means it earns more from resident care than it spends to deliver it; a negative figure means the opposite. It excludes non-operating "other income."
$337.2K
Voluntary non-profit community Operated by a church.
Net patient revenue Info Net patient revenue — what the home actually collects for resident care, after contractual allowances, bad debt and discounts are subtracted from its gross charges (CMS cost report, Worksheet G-3). It covers resident care only; money the home earns from other sources is shown separately as "Other income."
$11.0M Rank #98 / 294Revenue — State benchmarkedThis home is ranked 98th out of 294 homes in Indiana. Shows this facility's annual revenue compared to the Indiana average. Higher revenue generally means more resources for staffing and capital — read alongside Payroll %.Ranking totals vary by category as each rank only includes facilities that report data for that metric. Homes missing that data point aren't included in the ranking.Click the rank badge to see the full State ranking.Click here to see the full State ranking.
Net patient income Info Net patient income: net patient revenue minus the home's total operating expenses. A positive figure means it earns more from resident care than it spends to deliver it; a negative figure means the opposite. It excludes non-operating "other income."
$337.2K
Other income Info Money the home earns outside of resident care — such as investments, grants, rentals and other non-operating sources (CMS cost report, Worksheet G-3). It is tracked separately from net patient revenue: it is not part of that figure, and it is not included in net patient income.
$45.5K
Payroll costs Info Staff salaries plus wage-related costs — benefits such as payroll taxes, health insurance and retirement — from the home's own accounting records (CMS cost report, Worksheet A). Contract or agency labor is counted separately, under other operating costs. Rank #171 / 294Payroll — State benchmarkedThis home is ranked 171st out of 294 homes in Indiana. Shows total annual staff payroll benchmarked to the Indiana average. Higher payroll investment relative to peers often signals better staffing and less reliance on cheaper contract labor.Ranking totals vary by category as each rank only includes facilities that report data for that metric. Homes missing that data point aren't included in the ranking.Click the rank badge to see the full State ranking.Click here to see the full State ranking.
$4.2M 38.5% of net patient revenue Info Payroll as a share of revenue: staff salaries and wage-related benefits divided by net patient revenue. A higher figure means more of each revenue dollar goes to staff pay. Rank #278 / 294Payroll % — State benchmarkedThis home is ranked 278th out of 294 homes in Indiana. Shows payroll as a percentage of revenue versus the Indiana average. Well-run Indiana facilities typically land around 54–68% — the top third Statewide. Below 25% may signal understaffing or heavy agency use — read with Staffing ratings.Ranking totals vary by category as each rank only includes facilities that report data for that metric. Homes missing that data point aren't included in the ranking.Click the rank badge to see the full State ranking.Click here to see the full State ranking.
Other operating costs Info Everything it costs to run the home apart from payroll — food, utilities, supplies, maintenance, contract labor and administration. Calculated as total operating expense minus payroll (staff salaries and wage-related benefits).
$6.4M
Total costs Info The home's total operating expense for the year — all the costs of running it, salaries included (CMS cost report, Worksheet G-3).
$10.7M

What does this home offer?

Building type icon
Building type icon

Building Type: Single-story

On-site medical care and health services icon

On-site Medical Care and Health Services

Rehabilitative support icon

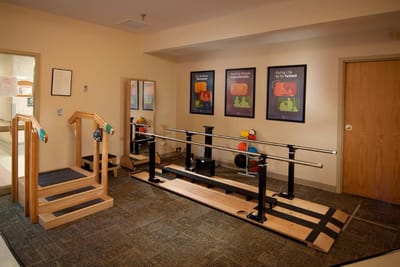
Rehabilitative Support

Who this home usually serves

TYPE OF STAY

Mostly long-term care residents

Most residents stay for extended periods and receive ongoing daily care.

New residents most often arrive under Medicaid (45% of admissions), and a typical Medicaid stay runs around 11 - 12 months.

Admissions
131 total

Coverage residents most often arrive under.

Medicare 19%
Private pay 36%
Medicaid 45%
Discharges
134 total

Coverage residents most often leave under.

Medicare 11%
Private pay 22%
Medicaid 67%

Places of interest near Kokomo Healthcare Center

Address 2.4 miles from city center Info Estimated distance in miles from Kokomo's city center to Kokomo Healthcare Center's address, calculated via Google Maps.

Calculate Travel Distance to Kokomo Healthcare Center

Add your location

Address

Compare Nursing Home around Kokomo

The information below is reported by the Indiana Department of Health, Division of Long Term Care.

4 facilities compared · CMS & IN Dept. of Health data

Wellbrooke of Kokomo
NH
ADC
AL
RC
Kokomo (Orleans Southwest)
118
Facility 118
IN AVG 116
Rank #177 / 437
70.3%
Facility 70.3%
IN AVG 69.4%
Rank #186 / 434
+1%
2.97
Facility 2.97
IN AVG 3.44
Rank #213 / 291
+52%-14%
$8.8k
Facility $8.8k
IN AVG $31.4k
Rank #250 / 293
72
Facility 72
IN AVG 83
Rank #297 / 384
36
Facility 36
IN AVG 25.0
Rank #215 / 292
6.0
Facility 6.0
IN AVG 4.1
Rank #230 / 292
283-
25
Facility 25
IN AVG 37
Rank #359 / 587
Frances Jenkins
$12.2M
Facility $12.2M
IN AVG $10.7M
Rank #78 / 294
$5.7M
Facility $5.7M
IN AVG $4.2M
Rank #87 / 294
46.9%
Facility 46.9%
IN AVG 42%
Rank #202 / 294
155819
Waterford Place Health Campus
NH
AL
IL
MC
Kokomo
151
Facility 151
IN AVG 116
Rank #85 / 437
48.3%
Facility 48.3%
IN AVG 69.4%
Rank #359 / 434
-30%
3.04
Facility 3.04
IN AVG 3.44
Rank #213 / 291
-31%-12%
$0
Facility $0
IN AVG $31.4k
Rank #1 / 293
-
23
Facility 23
IN AVG 25.0
Rank #149 / 292
7.7
Facility 7.7
IN AVG 4.1
Rank #276 / 292
171-
44
Facility 44
IN AVG 37
Rank #249 / 587
Trilogy Healthcare Of Kokomo LLC
$15.0M
Facility $15.0M
IN AVG $10.7M
Rank #54 / 294
$7.1M
Facility $7.1M
IN AVG $4.2M
Rank #51 / 294
47.6%
Facility 47.6%
IN AVG 42%
Rank #168 / 294
155678
Kokomo Healthcare Center
NH
Kokomo
80
Facility 80
IN AVG 116
Rank #328 / 437
87.0%
Facility 87.0%
IN AVG 69.4%
Rank #47 / 434
+25%
3.15
Facility 3.15
IN AVG 3.44
Rank #188 / 291
-7%-8%
$0
Facility $0
IN AVG $31.4k
Rank #1 / 293
-
25
Facility 25
IN AVG 25.0
Rank #158 / 292
3.1
Facility 3.1
IN AVG 4.1
Rank #98 / 292
-67-
57
Facility 57
IN AVG 37
Rank #167 / 587
Lincoln Mgt Co LLC
$11.0M
Facility $11.0M
IN AVG $10.7M
Rank #98 / 294
$4.2M
Facility $4.2M
IN AVG $4.2M
Rank #171 / 294
38.5%
Facility 38.5%
IN AVG 42%
Rank #278 / 294
155222
Aperion Care Kokomo
NH
AL
IL
MC
Kokomo
105
Facility 105
IN AVG 116
Rank #221 / 437
49.5%
Facility 49.5%
IN AVG 69.4%
Rank #351 / 434
-29%
2.26
Facility 2.26
IN AVG 3.44
Rank #286 / 291
-43%-34%
$15.6k
Facility $15.6k
IN AVG $31.4k
Rank #261 / 293
74
Facility 74
IN AVG 83
Rank #270 / 384
40
Facility 40
IN AVG 25.0
Rank #236 / 292
6.7
Facility 6.7
IN AVG 4.1
Rank #257 / 292
154A-
60
Facility 60
IN AVG 37
Rank #145 / 587
Aperion Care Kokomo, LLC
$8.4M
Facility $8.4M
IN AVG $10.7M
Rank #225 / 294
$3.6M
Facility $3.6M
IN AVG $4.2M
Rank #213 / 294
43.6%
Facility 43.6%
IN AVG 42%
Rank #66 / 294
155064

Financial Assistance for
Nursing Home in Indiana

Kokomo Healthcare Center is located in Kokomo, Indiana.
Here are the financial assistance programs available to residents in Indiana.

Get Financial aid guidance

Aged and Disabled Waiver

Indiana Medicaid A&D Waiver

Age 65+ or disabled
General Indiana resident, Medicaid-eligible, nursing home-level care need.
Income Limits (2025) ~$2,829/month 300% FBR, individual
Asset Limits $2,000 (individual), $3,000 (couple).
IN

Requires level-of-care determination.

Benefits
Personal care (5-7 hours/day) Respite (240 hours/year) Adult day care (~$60/day) Home health services

CHOICE Program

Indiana CHOICE

Age 60+
General Indiana resident, at risk of nursing home.
Income Limits ~$2,000/month varies
Asset Limits $10,000 individual
IN

Limited funding; regional variation.

Benefits
In-home care (3-5 hours/week) Respite (up to 10 days/year) Transportation (~5 trips/month)

Residential Care Assistance Program (RCAP)

Indiana Residential Care Assistance Program

Age 65+
General or blind, or disabled, Indiana resident, in approved facility, low-income or SSI recipient.
Income Limits (2025) ~$1,004/month including SSI
Asset Limits $2,000 (individual), $3,000 (couple).
IN

~50 facilities statewide; per diem rate set by FSSA.

Benefits
Room/board Laundry Minimal care coordination (~$20-$50/day subsidy)

Medicare Savings Program (MSP)

Indiana Medicare Savings Program

Age 65+ or disabled
General Indiana resident, Medicare Part A/B.
Income Limits (2025) ~$2,510/month (QMB), ~$3,380/month (SLMB), ~$3,598/month (QI)—individual.
Asset Limits $9,430 (individual), $14,130 (couple).
IN

Three tiers; no waitlist.

Benefits
Covers Part B premiums ($174.70/month) Deductibles ($240/year) Copays (~20%)

National Family Caregiver Support Program (NFCSP) Respite

Indiana NFCSP Respite Care

Age
General Caregivers of 60+ needing care or 55+ caregivers of others; Indiana resident; functional needs (2+ ADLs).
Income Limits (2025) Prioritizes ~$24,980/year (individual); no strict cap.
Asset Limits Not assessed; need-based.
IN

16 AAAs; prioritizes low-income, rural caregivers.

Benefits
Respite (4-6 hours/week or 5 days/year) Adult day care ($60/day) Caregiver training

VA Aid and Attendance (A&A) and Housebound Benefits

Indiana VA Aid and Attendance/Housebound

Age 65+ or disabled veteran/spouse
General Indiana resident, wartime service, need for ADL help (A&A) or homebound.
Income Limits (2025) Net income < ~$1,984/month (veteran with dependent, A&A); pension offsets income.
Asset Limits ~$155,356 net worth limit
IN

High veteran demand statewide.

Benefits
Cash (~$1,433-$2,642/month veteran, ~$951-$1,318 spouse) for care costs (e.g., in-home, assisted living)

Frequently Asked Questions about Kokomo Healthcare Center

Is Kokomo Healthcare Center in a walkable area?

Kokomo Healthcare Center has a walk score of 57. Moderately walkable. Some errands can be accomplished on foot, with a mix of nearby amenities.

What is the occupancy rate at Kokomo Healthcare Center?

Kokomo Healthcare Center's occupancy is 87.0%.

Are there photos of Kokomo Healthcare Center?

Yes — there are 5 photos of Kokomo Healthcare Center in the photo gallery on this page.

What is the address of Kokomo Healthcare Center?

Kokomo Healthcare Center is located at 429 W Lincoln Rd, Kokomo, IN 46902.

What is the phone number of Kokomo Healthcare Center?

(765) 453-5600 will put you in contact with the team at Kokomo Healthcare Center.

Is Kokomo Healthcare Center Medicare or Medicaid certified?

Yes — Kokomo Healthcare Center is a CMS-certified provider of Medicare and Medicaid.

Guides for Better Senior Living

Care Cost Calculator: See Prices in Your Area

Nursing Home Data Explorer

Don’t Wait Too Long: 7 Red Flag Signs Your Parent Needs Assisted Living Now

The True Cost of Assisted Living in 2025 – And How Families Are Paying For It

Understanding Senior Living Costs: Pricing Models, Discounts & Financial Assistance