Lakes at Litchfield Assisted Living
Nursing Home, Assisted Living, Independent Living, Memory Care & Skilled Nursing · Pawleys Island, SC
CMS overall rating Info CMS (the Centers for Medicare & Medicaid Services) is the federal agency that rates nursing home quality. Its Overall Rating runs from 1 to 5 stars, combining health inspections, staffing, and quality measures, with inspections weighted most heavily.

Lakes at Litchfield Assisted Living

Nursing Home, Assisted Living, Independent Living, Memory Care & Skilled Nursing · Pawleys Island, SC
CMS overall rating Info CMS (the Centers for Medicare & Medicaid Services) is the federal agency that rates nursing home quality. Its Overall Rating runs from 1 to 5 stars, combining health inspections, staffing, and quality measures, with inspections weighted most heavily.
Calculator: See prices in your area
Lakes at Litchfield Assisted Living accepts Medicare and private pay.

Overview of Lakes at Litchfield Assisted Living

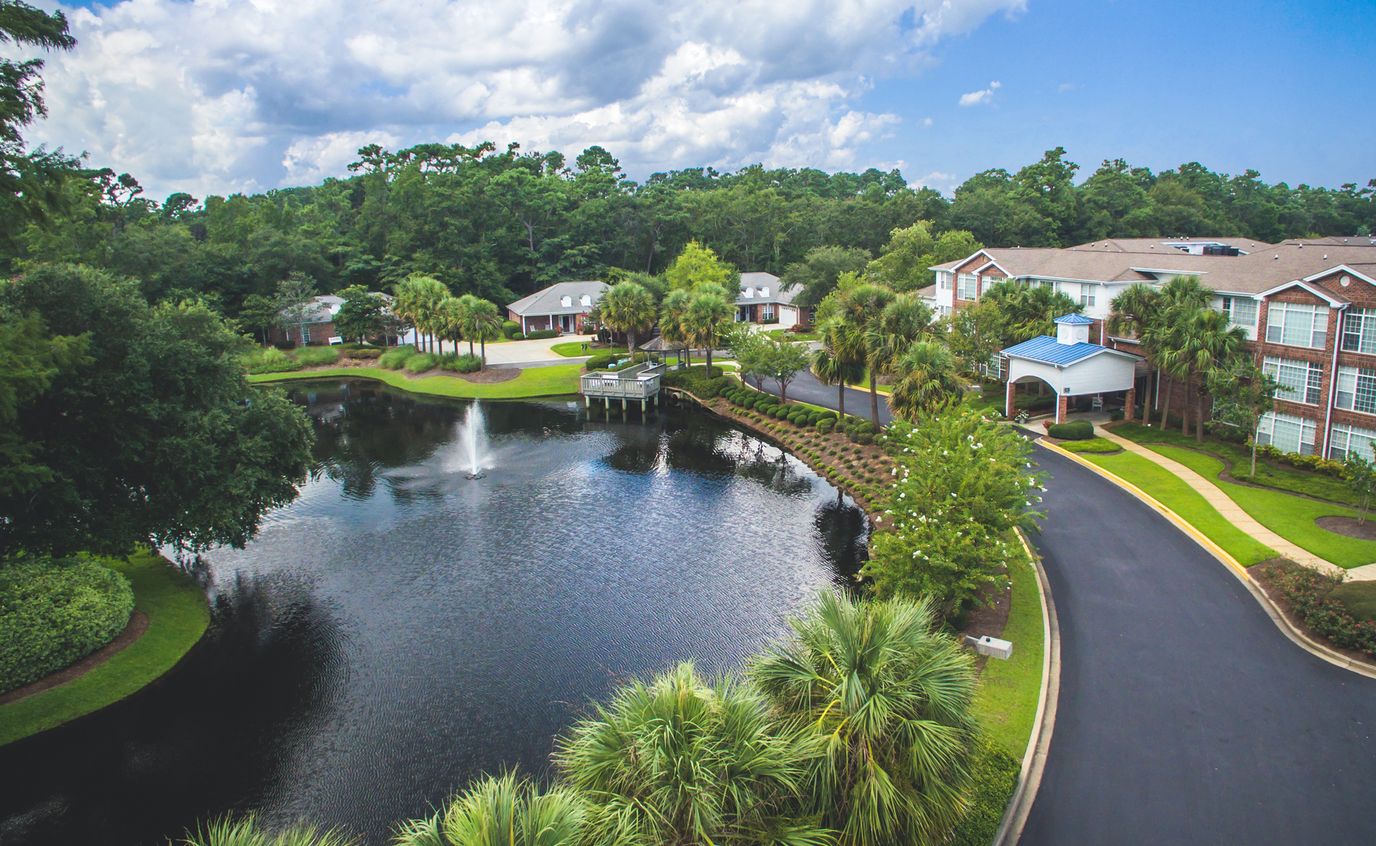
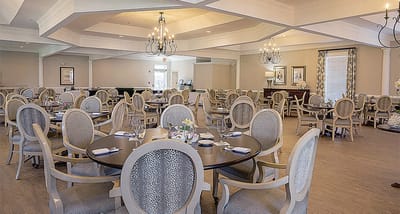
Serving residents in Pawleys Island, South Carolina, Lakes at Litchfield Assisted Living is an assisted living community operated by Litchfield Retirement LLC and administered by Joseph Mason. The 79-bed community has been serving the area for 27 years. It has a strong occupancy of 87%. Medicare and private pay are accepted, giving families coverage options to explore with admissions.

The community mainly serves active and engaged residents. There’s a specific program and schedule built around that lifestyle. Short-term rehabilitation and respite care are available alongside full-time assisted living. This makes the community a flexible option for families whose needs may change over time.

Total nurse staffing averages 4 hours and 50 minutes per resident each day. Also, 24-hour staffing and daily assistance are available.

Residents stay an average of 43 days, including short-stay rehabilitation clients and longer-term assisted living residents. With this population, the community can serve people recovering from health events as well as those who need ongoing support with daily activities, as they stay as independent as possible.

Families considering Lakes at Litchfield Assisted Living should take a tour of the community to see how the daily schedule, activity programs, and care services support residents’ needs and lifestyles.

Quality ratings

Measured by Centers for Medicare & Medicaid Services (CMS)

Overall rating Info The Overall CMS Rating combines results from health inspections, staffing levels and quality measures. Health inspections carry the most weight. Staffing and quality scores can increase or decrease the final rating based on performance compared to state and national standards.
Health Inspection Info Based on the results of the facility's three most recent standard inspections and any complaint investigations. CMS reviews the number, scope, and severity of deficiencies, with more recent findings weighted more heavily.
Staffing Info Measures average nursing staff hours per resident per day, including Registered Nurses (RNs) and total nursing staff. Ratings are adjusted based on the level of care residents require and are compared to state and national benchmarks.
Quality Measures Info Based on clinical and physical health indicators reported to CMS, such as hospital readmissions, falls, pressure ulcers, and improvements in mobility. These measures reflect how well residents' health needs are being managed.

Staffing hours breakdown

Info Daily nursing hours per resident by staff type, reported to CMS. Higher is generally better — compare this facility to state and national averages to see where staffing stands.

Hours per resident per day — compared to state averages

Total nursing care / resident Info Total adjusted nursing hours per resident per day, combining RN, LPN, and aide time. CMS adjusts this for case-mix so facilities can be fairly compared.
4h 50m per day
Rank #21 / 121Nurse hours — State benchmarkedThis home is ranked 21st out of 121 homes in South Carolina. Shows adjusted nurse hours per resident per day benchmarked to the South Carolina average, with a ranking across 121 South Carolina facilities. More hours mean more direct care. The national average is about 3.5 hrs; below 3.0 is a red flag.Rankings are based only on facilities in South Carolina that report data for that category. Facilities without available data are excluded from the ranking.Click the rank badge to see the full State ranking.Click here to see the full State ranking.
vs avg
Staff typeHours / Day / Residentvs state avg
Registered Nurse (RN) Info RNs hold the highest nursing license and can assess residents, interpret test results, and direct care plans. More RN hours per day often signals stronger clinical oversight and faster response to health changes. 1h 22m per day
LPN / LVN Info Licensed Practical Nurses (LPNs) or Licensed Vocational Nurses (LVNs) deliver routine hands-on care — medication administration, wound dressing, and monitoring vital signs. They work under RN supervision and make up a large share of daily bedside care. 1h 31m per day
Nurse Aide Info Certified Nurse Aides (CNAs) provide the most direct day-to-day assistance: bathing, dressing, feeding, and mobility. Nurse aide hours are typically the largest staffing category and directly affect residents' quality of life. 3h 1m per day
Weekend Total Nursing Info Combined nursing hours (RN + LPN + Nurse Aide) per resident per day on weekends. Staffing often drops on weekends — this figure reveals whether the facility maintains adequate coverage outside of weekday hours. 5h 11m per day
Physical Therapist Info Hours per resident per day provided by licensed Physical Therapists (PTs) or PT Assistants. PT services help residents recover mobility after injury or illness and are especially important for post-acute (short-stay) rehabilitation. 13m per day
Weekend RN Info Registered nurse hours specifically on weekends. Facilities sometimes reduce RN presence on Saturdays and Sundays — a low weekend RN figure compared to weekday hours can indicate reduced clinical oversight when most administrative staff are absent. 40m per day

Capacity and availability

Avg. Length of Stay Info Average number of days residents stay at this facility, based on CMS cost report data. Shorter stays often reflect post-acute or rehab care; longer stays reflect long-term care.
43 days
Bed community size
79-bed community Rank #173 / 309Bed count — State benchmarkedThis home is ranked 173rd out of 309 homes in South Carolina. Shows this facility's certified or reported bed count compared to other South Carolina facilities. Larger communities may offer more amenities, programs, and on-site services for residents and families.Rankings are based only on facilities in South Carolina that report data for that category. Facilities without available data are excluded from the ranking.Click the rank badge to see the full State ranking.Click here to see the full State ranking.
A larger shared setting that may offer more common spaces and organized community services.
Years in operation
27 years in operation
A longer operating history, which may indicate experience navigating regulations and delivering ongoing care.
BBB Rating
BBB Rating: A+ (Not Accredited)
An independent rating from the Better Business Bureau based on factors such as complaint history, transparency, and business practices.
How BBB ratings work

About this community

Occupancy

Occupancy rate
87%
Rank #52 / 131Occupancy rate — State benchmarkedThis home is ranked 52nd out of 131 homes in South Carolina. Shows this facility's occupancy rate versus the South Carolina average, with its Statewide rank out of 131. Higher occupancy signals strong local demand and financial stability.Rankings are based only on facilities in South Carolina that report data for that category. Facilities without available data are excluded from the ranking.Click the rank badge to see the full State ranking.Click here to see the full State ranking.
Higher than the South Carolina average: 82.1%
Occupied beds
69 / 79
Average occupied beds in South Carolina homes 90 beds

Awards

6X National Award Winner for innovation in wellness programming
social programming
person-centered care
team member advancement.

License Details

Facility TypeHl- Community Residential Care Facility
StatusActive
CountyGeorgetown
License NumberCRC-1116
Business TypeLtd. Liability
CMS Certification Number425380

Ownership & Operating Entity

Lakes at Litchfield Assisted Living is legally operated by Litchfield Retirement LLC, and administered by Joseph Mason.

Owner NameLitchfield Retirement LLC

Staffing

Key information about the people who lead and staff this community.

Leadership

ContactMs. Nancy McKinstry

Payment & Insurance

1 service
Accept Medicare

Therapy & Rehabilitation

3 services
Rehabilitation Services
Respite Care
Short-Term Rehab

Staffing & Medical

1 service
24-Hour Staffing

Memory & Specialized Care

1 service
Dedicated Alzheimer's Unit

Contact Information

Amenities & Lifestyle

Specific ProgramsActive Adult

Contact Lakes at Litchfield Assisted Living

Health Inspection History

Inspections since 2021
Total health inspections 4

State average N/A


Last Health inspection on Mar 2025

Total health citations
9 Rank #44 / 122Health citations — State benchmarkedThis home is ranked 44th out of 122 homes in South Carolina. Shows this facility's total health deficiency citations benchmarked to the South Carolina State average, with a ranking across all 122 SC facilities. Lower citation counts earn a better rank.Rankings are based only on facilities in South Carolina that report data for that category. Facilities without available data are excluded from the ranking.Click the rank badge to see the full State ranking.Click here to see the full State ranking.

State average N/A

Citations per inspection
2.25 Rank #30 / 122Citations per inspection — State benchmarkedThis home is ranked 30th out of 122 homes in South Carolina. Shows average deficiency citations per CMS inspection for this facility versus the South Carolina mean across 122 facilities with citation data. Lower is better.Rankings are based only on facilities in South Carolina that report data for that category. Facilities without available data are excluded from the ranking.Click the rank badge to see the full State ranking.Click here to see the full State ranking.

State average N/A


Health citations are formal notices following inspections when they fail to comply with safety and care standards.

6 of 9 citations resulted from standard inspections; and 3 of 9 resulted from complaint investigations.

Breakdown of citation severity (last 5 years)
Critical health citations
0
In line with State average

State average: N/A


Serious health citations
0
In line with State average

State average: N/A

0 critical citations State average: N/A

0 serious citations State average: N/A

9 moderate citations State average: N/A

0 minor citations State average: N/A
Citations history (last 5 years)
Resident Rights moderate citation Mar 11, 2025
Corrected

Pharmacy moderate citation Nov 28, 2023
Corrected

Abuse/Neglect moderate citation Jul 26, 2023
Corrected

Resident Rights moderate citation Jul 26, 2023
Corrected

Staffing Data

Reporting period: October 1 – December 31, 2025 (Q4 2025). Source: CMS Payroll-Based Journal report.

Total staff 101
Employees 32
Contractors 69
Staff to resident ratio 6.73 : 1
0% compared with State average

State average ratio: 0 : 0

Avg staff/day 21
Average shift 6 hours
0% compared with State average

State average: 0 hours

Total staff hours (quarter) 11,528

Nursing staff breakdown

Q4 2025 · Oct 1 – Dec 31 More info This data comes from the CMS Payroll-Based Journal report covering October 1 – December 31, 2025.
Registered Nurse

Manages medical care and health needs.

RN Staff Info All 4 RN Staff are full-time employees. No contractors work on this role. 4
Average shift length Info Average shift length. Calculated as total hours divided by days worked and average staff per day. 5.3 hours
Licensed Practical Nurse

Assists with medical care and medications.

LPN Staff Info 22 total: 6 full-time employees and 16 contractors. 22
Average shift length Info Average shift length. Calculated as total hours divided by days worked and average staff per day. 7.2 hours
Certified Nursing Assistant

Helps with daily care and mobility.

CNA Staff Info 44 total: 15 full-time employees and 29 contractors. 44
Average shift length Info Average shift length. Calculated as total hours divided by days worked and average staff per day. 7 hours

Contractor staffing

Q4 2025 · Oct 1 – Dec 31 More info This data comes from the CMS Payroll-Based Journal report covering October 1 – December 31, 2025.

Total hours from contractors

30.9%

3,557 contractor hours this quarter

Certified Nursing Assistant: 29 Licensed Practical Nurse: 16 Respiratory Therapy Technician: 7 Speech Language Pathologist: 6 Physical Therapy Aide: 3 Physical Therapy Assistant: 2 Qualified Social Worker: 2 Medical Director: 1 Feeding Assistant: 1 Therapeutic Recreation Specialist: 1 Occupational Therapy Assistant: 1

Staff by category

Q4 2025 · Oct 1 – Dec 31 More info This data comes from the CMS Payroll-Based Journal report covering October 1 – December 31, 2025.
Certified Nursing Assistant1529443,77592100%7
Licensed Practical Nurse616221,89192100%7.2
Other Dietary Services Staff2021,0318188%7.7
Registered Nurse4048179098%5.3
Speech Language Pathologist0665867986%4.4
Clinical Nurse Specialist2025406571%5.7
Administrator1015066571%7.8
Dental Services Staff1014806065%8
Physical Therapy Aide0334086672%4.8
Nurse Practitioner1013586368%5.7
Physical Therapy Assistant0222726975%3.8
Respiratory Therapy Technician0772646874%3.2
Feeding Assistant0112283841%6
Qualified Social Worker0222206571%3.4
Medical Director0111143841%3
Therapeutic Recreation Specialist011251314%1.9
Occupational Therapy Assistant0111489%1.8
44 Certified Nursing Assistant
% of Days 100%
22 Licensed Practical Nurse
% of Days 100%
2 Other Dietary Services Staff
% of Days 88%
4 Registered Nurse
% of Days 98%
6 Speech Language Pathologist
% of Days 86%
2 Clinical Nurse Specialist
% of Days 71%
1 Administrator
% of Days 71%
1 Dental Services Staff
% of Days 65%
3 Physical Therapy Aide
% of Days 72%
1 Nurse Practitioner
% of Days 68%
2 Physical Therapy Assistant
% of Days 75%
7 Respiratory Therapy Technician
% of Days 74%
1 Feeding Assistant
% of Days 41%
2 Qualified Social Worker
% of Days 71%
1 Medical Director
% of Days 41%
1 Therapeutic Recreation Specialist
% of Days 14%
1 Occupational Therapy Assistant
% of Days 9%

Penalties and fines

Federal penalties imposed by CMS for regulatory violations, including civil money penalties (fines) and denials of payment for new Medicare/Medicaid admissions.

Source: CMS Penalties Database (Data as of Jan 2026)

Total fines amount $5K Rank #61 / 123Federal fines — State benchmarkedThis home is ranked 61st out of 123 homes in South Carolina. Shows this facility's cumulative CMS federal fine dollars versus the South Carolina average among facilities with fines, and where it ranks among 123 facilities in the pool. Lower total dollars mean a better rank.Rankings are based only on facilities in South Carolina that report data for that category. Facilities without available data are excluded from the ranking.Click the rank badge to see the full State ranking.Click here to see the full State ranking.
84% lower than State average

State average: $34K

Number of fines 1
59% fewer fines than State average

State average: 2.4

Payment Denials Info Serious action where Medicare and/or Medicaid temporarily stops payments for new residents until issues are fixed. 0
100% fewer payment denials than State average

State average: 0.1

Fines amount comparison
This facility $5K
State average $34K

No penalties in the past 3 years

No civil money penalties or payment denials were reported in the last 3 years.

Quality of care over time

These measures show how residents usually do over time at this home, based on health outcomes and preventive care.

Short-stay resident measures
Pneumococcal Vaccine Info Percent of short-stay residents assessed and appropriately given the pneumococcal vaccine 79.4%
In line with State average

State average: 79.5%

Antipsychotic medication increase Info Percent of short-stay residents who newly received an antipsychotic medication 1.1%
33% better than State average

State average: 1.7%

Influenza Vaccine Info Percent of short-stay residents assessed and appropriately given the seasonal influenza vaccine 90.3%
16% better than State average

State average: 78.0%

Breakdown by payment type

Medicare

53% of new residents, usually for short-term rehab.

Typical stay 26 days

Private pay

47% of new residents, often for short stays.

Typical stay 2 - 3 months

Facility Characteristics

Source: CMS Long-Term Care Facility Characteristics (Data as of Jan 2026)

Total residents 15
Medicare
15
100% of residents
Programs & Services
Residents Group

Residents meet regularly to discuss policies, care quality, and activities

CCRC

Part of a Continuing Care Retirement Community offering multiple care levels

Active Resident Council

Organized group of residents that meets regularly to discuss facility policies, quality of life, and activities.

Finances and operations

Based on CMS SNF Cost Report for fiscal year ending in 12/2023.

For-profit
Operated by a single business entity.
Net patient revenue Info Net patient revenue — what the home actually collects for resident care, after contractual allowances, bad debt and discounts are subtracted from its gross charges (CMS cost report, Worksheet G-3). It covers resident care only; money the home earns from other sources is shown separately as "Other income."
$3.9M
Net patient income Info Net patient income: net patient revenue minus the home's total operating expenses. A positive figure means it earns more from resident care than it spends to deliver it; a negative figure means the opposite. It excludes non-operating "other income."
-$12.8M
For-profit Operated by a single business entity.
Net patient revenue Info Net patient revenue — what the home actually collects for resident care, after contractual allowances, bad debt and discounts are subtracted from its gross charges (CMS cost report, Worksheet G-3). It covers resident care only; money the home earns from other sources is shown separately as "Other income."
$3.9M Rank #33 / 125Revenue — State benchmarkedThis home is ranked 33rd out of 125 homes in South Carolina. Shows this facility's annual revenue compared to the South Carolina average. Higher revenue generally means more resources for staffing and capital — read alongside Payroll %.Rankings are based only on facilities in South Carolina that report data for that category. Facilities without available data are excluded from the ranking.Click the rank badge to see the full State ranking.Click here to see the full State ranking.
Net patient income Info Net patient income: net patient revenue minus the home's total operating expenses. A positive figure means it earns more from resident care than it spends to deliver it; a negative figure means the opposite. It excludes non-operating "other income."
-$12.8M
Other income Info Money the home earns outside of resident care — such as investments, grants, rentals and other non-operating sources (CMS cost report, Worksheet G-3). It is tracked separately from net patient revenue: it is not part of that figure, and it is not included in net patient income.
$13.3M
Payroll costs Info Staff salaries plus wage-related costs — benefits such as payroll taxes, health insurance and retirement — from the home's own accounting records (CMS cost report, Worksheet A). Contract or agency labor is counted separately, under other operating costs. Rank #75 / 125Payroll — State benchmarkedThis home is ranked 75th out of 125 homes in South Carolina. Shows total annual staff payroll benchmarked to the South Carolina average. Higher payroll investment relative to peers often signals better staffing and less reliance on cheaper contract labor.Rankings are based only on facilities in South Carolina that report data for that category. Facilities without available data are excluded from the ranking.Click the rank badge to see the full State ranking.Click here to see the full State ranking.
$5.5M 141.7% of net patient revenue Info Payroll as a share of revenue: staff salaries and wage-related benefits divided by net patient revenue. A higher figure means more of each revenue dollar goes to staff pay. Rank #116 / 125Payroll % — State benchmarkedThis home is ranked 116th out of 125 homes in South Carolina. Shows payroll as a percentage of revenue versus the South Carolina average. Well-run South Carolina facilities typically land around 53–64% — the top third Statewide. Below 25% may signal understaffing or heavy agency use — read with Staffing ratings.Rankings are based only on facilities in South Carolina that report data for that category. Facilities without available data are excluded from the ranking.Click the rank badge to see the full State ranking.Click here to see the full State ranking.
Other operating costs Info Everything it costs to run the home apart from payroll — food, utilities, supplies, maintenance, contract labor and administration. Calculated as total operating expense minus payroll (staff salaries and wage-related benefits).
$11.2M
Total costs Info The home's total operating expense for the year — all the costs of running it, salaries included (CMS cost report, Worksheet G-3).
$16.7M

Who this home usually serves

TYPE OF STAY

Mostly short-term rehab stays

Most residents typically stay for a few weeks or months before returning home or moving on.

Most new residents arrive under Medicare (53% of admissions), and a typical Medicare stay runs around 26 days.

Admissions
148 total

Coverage residents most often arrive under.

Medicare 53%
Private pay 47%
Discharges
145 total

Coverage residents most often leave under.

Medicare 50%
Private pay 50%

Places of interest near Lakes at Litchfield Assisted Living

Address 120 Lakes At Litchfield Dr, Pawleys Island, SC 29585-5515

Calculate Travel Distance to Lakes at Litchfield Assisted Living

Add your location

Address

Compare Nursing Homes around the area

The information below is reported by the South Carolina Department of Public Health, Bureau of Healthcare Quality.

The Village at Summerville
NH
AL
IL
MC
RC
SNF
Summerville (Palmetto Park) -48 - 45 1 Bed / 2 Bed / 3 Bed
Lakes at Litchfield Assisted Living
NH
AL
IL
MC
SNF
Pawleys Island -79 A+--
Myrtle Beach Manor
NH
AL
MC
RC
SNF
Myrtle Beach -111 - 41 Studio / 1 Bed
Cypress Square
NH
AL
Summerville -44 - 52 Studio / 1 Bed
Brookdale Anderson
NH
AL
IL
MC
SNF
Anderson (Windsor Place) -160 - 43 Studio / 1 Bed / 2 Bed

Frequently Asked Questions about Lakes at Litchfield Assisted Living

Who is the owner of Lakes at Litchfield Assisted Living?

Lakes at Litchfield Assisted Living is legally operated by Litchfield Retirement LLC, and administered by Joseph Mason.

What is the license number of Lakes at Litchfield Assisted Living?

According to SC state health department records, Lakes at Litchfield Assisted Living's license number is CRC-1116.

What is the occupancy rate at Lakes at Litchfield Assisted Living?

Lakes at Litchfield Assisted Living's occupancy is 87%.

What is the best email address for Lakes at Litchfield Assisted Living?

The team at Lakes at Litchfield Assisted Living can be reached at WMASON@LAKES-LITCHFIELD.COM.

Does Lakes at Litchfield Assisted Living operate as a for-profit or non-profit?

Lakes at Litchfield Assisted Living is registered as a for-profit in SC.

Who is the administrator of Lakes at Litchfield Assisted Living?

Joseph Mason is the administrator of Lakes at Litchfield Assisted Living.

How many beds does Lakes at Litchfield Assisted Living have?

Lakes at Litchfield Assisted Living has 79 beds.

Guides for Better Senior Living

Care Cost Calculator: See Prices in Your Area

Nursing Home Data Explorer

Don’t Wait Too Long: 7 Red Flag Signs Your Parent Needs Assisted Living Now

The True Cost of Assisted Living in 2025 – And How Families Are Paying For It

Understanding Senior Living Costs: Pricing Models, Discounts & Financial Assistance