Lakewood Therapy and Living Center
CMS overall rating Info CMS (the Centers for Medicare & Medicaid Services) is the federal agency that rates nursing home quality. Its Overall Rating runs from 1 to 5 stars, combining health inspections, staffing, and quality measures, with inspections weighted most heavily.

Lakewood Therapy and Living Center

CMS overall rating Info CMS (the Centers for Medicare & Medicaid Services) is the federal agency that rates nursing home quality. Its Overall Rating runs from 1 to 5 stars, combining health inspections, staffing, and quality measures, with inspections weighted most heavily.
Calculator: See prices in your area
Lakewood Therapy and Living Center accepts Medicare, Medicaid, and private pay.

Overview of Lakewood Therapy and Living Center

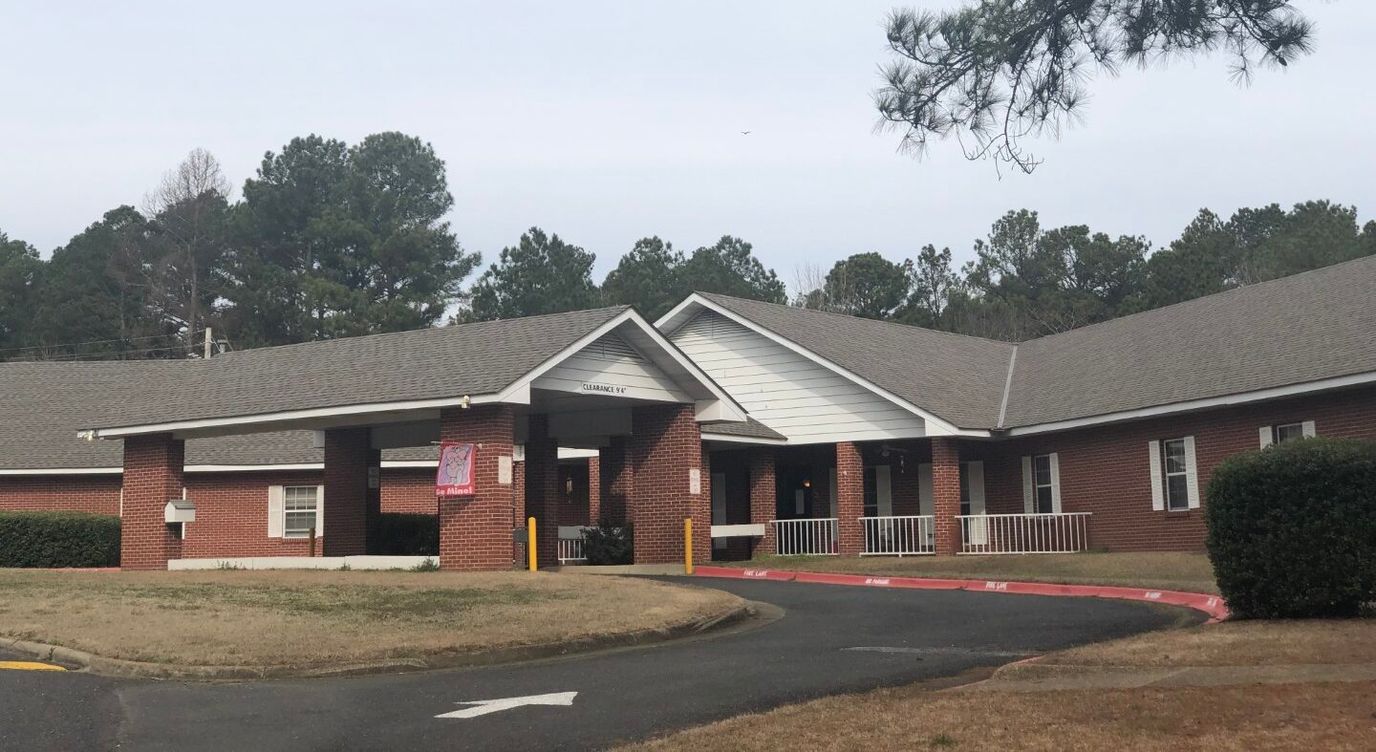
Find the care you need at Lakewood Therapy and Living Center, an outstanding community in Hot Springs, AR, offering post-hospital care, skilled nursing, and rehabilitation. Committed to residents’ welfare, a kind and highly skilled team provides the highest quality of care tailored to their unique needs around the clock. The community also promotes a nurturing and welcoming environment, ensuring residents feel at ease during their stay.

To ease financial burdens, Medicaid and Medicare are accepted. Therapy services, including physical, occupational, and speech therapy, are also provided to enhance residents’ living experiences. Striving to meet residents’ dietary needs and preferences, delicious and healthy dining options are served. With top-notch services and well-maintained amenities, the community ensures residents have the finest retirement experience.

Quality ratings

Measured by Centers for Medicare & Medicaid Services (CMS)

Overall rating Info The Overall CMS Rating combines results from health inspections, staffing levels and quality measures. Health inspections carry the most weight. Staffing and quality scores can increase or decrease the final rating based on performance compared to state and national standards.
▼ 36.3% Below AR avg. ▼ 36.3% Below AR avg.AR average: 3.1Click the badge to see the full State ranking.Click here to see the full State ranking.
Health Inspection Info Based on the results of the facility's three most recent standard inspections and any complaint investigations. CMS reviews the number, scope, and severity of deficiencies, with more recent findings weighted more heavily.
▼ 30.8% Below AR avg. ▼ 30.8% Below AR avg.AR average: 2.9Click the badge to see the full State ranking.Click here to see the full State ranking.
Staffing Info Measures average nursing staff hours per resident per day, including Registered Nurses (RNs) and total nursing staff. Ratings are adjusted based on the level of care residents require and are compared to state and national benchmarks.
▼ 37.2% Below AR avg. ▼ 37.2% Below AR avg.AR average: 3.2Click the badge to see the full State ranking.Click here to see the full State ranking.
Quality Measures Info Based on clinical and physical health indicators reported to CMS, such as hospital readmissions, falls, pressure ulcers, and improvements in mobility. These measures reflect how well residents' health needs are being managed.
▼ 18.0% Below AR avg. ▼ 18.0% Below AR avg.AR average: 3.7Click the badge to see the full State ranking.Click here to see the full State ranking.

Staffing hours breakdown

Info Daily nursing hours per resident by staff type, reported to CMS. Higher is generally better — compare this facility to state and national averages to see where staffing stands.

Hours per resident per day — compared to Arkansas state averages

Total nursing care / resident Info Total adjusted nursing hours per resident per day, combining RN, LPN, and aide time. CMS adjusts this for case-mix so facilities can be fairly compared.
4h 56m per day
This facility Arkansas avg (4h 40m per day)
vs Arkansas avg
+6%

2 of 6 metrics below state avg

Standout metric Weekend Total Nursing is +6% above state avg
Staff typeHours / Day / Residentvs state avg
Registered Nurse (RN) Info RNs hold the highest nursing license and can assess residents, interpret test results, and direct care plans. More RN hours per day often signals stronger clinical oversight and faster response to health changes. 20m per day ▼ 18% State avg: 24m per day · National avg: 41m per day
LPN / LVN Info Licensed Practical Nurses (LPNs) or Licensed Vocational Nurses (LVNs) deliver routine hands-on care — medication administration, wound dressing, and monitoring vital signs. They work under RN supervision and make up a large share of daily bedside care. 59m per day ▲ 3% State avg: 57m per day · National avg: 52m per day
Nurse Aide Info Certified Nurse Aides (CNAs) provide the most direct day-to-day assistance: bathing, dressing, feeding, and mobility. Nurse aide hours are typically the largest staffing category and directly affect residents' quality of life. 2h 52m per day ▲ 5% State avg: 2h 44m per day · National avg: 2h 21m per day
Weekend Total Nursing Info Combined nursing hours (RN + LPN + Nurse Aide) per resident per day on weekends. Staffing often drops on weekends — this figure reveals whether the facility maintains adequate coverage outside of weekday hours. 3h 41m per day ▲ 6% State avg: 3h 29m per day · National avg: 3h 26m per day
Physical Therapist Info Hours per resident per day provided by licensed Physical Therapists (PTs) or PT Assistants. PT services help residents recover mobility after injury or illness and are especially important for post-acute (short-stay) rehabilitation. 1m per day ▼ 61% State avg: 2m per day · National avg: 4m per day
Weekend RN Info Registered nurse hours specifically on weekends. Facilities sometimes reduce RN presence on Saturdays and Sundays — a low weekend RN figure compared to weekday hours can indicate reduced clinical oversight when most administrative staff are absent. 17m per day ▲ 5% State avg: 16m per day · National avg: 29m per day

Capacity and availability

This home usually has availability

Lower occupancy than the Arkansas average: 71.3%
Occupancy rate
57.5%
Avg. Length of Stay
80 days
Bed community size
80-bed community Rank #186 / 330Bed count — State benchmarkedThis home is ranked 186th out of 330 homes in Arkansas. Shows this facility's certified or reported bed count compared to other Arkansas facilities. Larger communities may offer more amenities, programs, and on-site services for residents and families.Rankings are based only on facilities in Arkansas that report data for that category. Facilities without available data are excluded from the ranking.Click the rank badge to see the full State ranking.Click here to see the full State ranking.
A larger shared setting that may offer more common spaces and organized community services.
Years in operation
54 years in operation
A longer operating history, which may indicate experience navigating regulations and delivering ongoing care.
Walk Score
Walk Score: 4 / 100 Rank #373 / 419Walk Score — State benchmarkedThis home is ranked 373rd out of 419 homes in Arkansas. Shows how walkable this facility's neighborhood is compared to the average Walk Score across Arkansas facilities. Higher scores benefit residents, families, and staff.Rankings are based only on facilities in Arkansas that report data for that category. Facilities without available data are excluded from the ranking.Click the rank badge to see the full State ranking.Click here to see the full State ranking.
Car-dependent. Most errands require a car, with limited nearby walkable options.
BBB Rating
BBB Rating: A+ (Not Accredited)
An independent rating from the Better Business Bureau based on factors such as complaint history, transparency, and business practices.
How BBB ratings work

About this community

License Details

CMS Certification Number45404

Contact Lakewood Therapy and Living Center

Inspection History

In Arkansas, the Department of Human Services, Office of Long Term Care is authorized to conduct unannounced inspections and issue official quality of care reports for all senior living providers.

Since 2022 · 4 years of data 39 deficiencies

Inspection Scorecard Info This scorecard compares key inspection, deficiency, and complaint metrics at this facility against the Arkansas state average. Metrics rated ≥15% worse than average are highlighted in red; those ≥15% better are highlighted in green.

Since 2022 vs. Arkansas state average
Overall vs. AR average 2 Worse Metrics worse than Arkansas average:
• Total deficiencies (86% above)
• Deficiencies per year (85% above)
0 Better No metrics in this bucket.
Latest Inspection January 9, 2025 Routine

Deficiencies Info Deficiencies are formal regulatory issues recorded during state inspections.

This FacilityAR Averagevs. AR Avg
Total deficiencies Info Formal regulatory issues recorded by inspectors across all inspection types. 3921 This facility has 86% more total deficiencies than a typical Arkansas nursing home (39 vs. AR avg 21).↑ 86% worse
Deficiencies per year Info Average deficiencies per year since 2022. 9.85.3 This facility has 85% more deficiencies per year than a typical Arkansas nursing home (9.8 vs. AR avg 5.3).↑ 85% worse

Inspection Reports Summary Info An editor-reviewed summary of the themes and findings across this facility's recent inspection reports.

  • February 8, 2024 complaint investigation found Immediate Jeopardy for unsafe off-loading causing a resident fall with major injury and failure to timely report the incident.
  • January 9, 2025 annual inspection cited 8 deficiencies including failure to maintain resident dignity, protect confidentiality, coordinate PASARR, and document wound care and psychotropic medication reductions.
  • February 23, 2024 routine inspections identified 5 deficiencies related to infection risk from catheter care, oxygen therapy errors, expired medications, lack of water management, and missing pneumococcal vaccination documentation.

Health Inspection History

Inspections since 2022
Total health inspections 6

Arkansas average 4.2


Last Health inspection on Jan 2025

Total health citations
24

Arkansas average 21.8

Citations per inspection
4

Arkansas average 5.32


Health citations are formal notices following inspections when they fail to comply with safety and care standards.

19 of 24 citations resulted from standard inspections; and 5 of 24 resulted from complaint investigations.

Breakdown of citation severity (last 4 years)
Critical health citations
1
150% worse than Arkansas average

Arkansas average: 0.4


Serious health citations
0
100% better than Arkansas average

Arkansas average: 0.2

1 critical citation Arkansas average: 0.4

0 serious citations Arkansas average: 0.2

23 moderate citations Arkansas average: 20.9

0 minor citations Arkansas average: 0.4
Citations history (last 4 years)
Nursing Services moderate citation Jan 09, 2025
Corrected

Pharmacy moderate citation Jan 09, 2025
Corrected

Quality of Care moderate citation Jan 09, 2025
Corrected

Care Planning moderate citation Jan 09, 2025
Corrected

Staffing Data

Reporting period: October 1 – December 31, 2025 (Q4 2025). Source: CMS Payroll-Based Journal report.

Total staff 81
Employees 74
Contractors 7
Staff to resident ratio 1.33 : 1
16% fewer staff per resident than Arkansas average
Arkansas average ratio: 1.59 : 1 Arkansas average ratio: 1.59 : 1See full Arkansas ranking
Avg staff/day 31
Average shift 7.7 hours
0% compared with Arkansas average
Arkansas average: 8 hours Arkansas average shift: 8 hoursSee full Arkansas ranking
Total staff hours (quarter) 22,023

Nursing staff breakdown

Q4 2025 · Oct 1 – Dec 31 More info This data comes from the CMS Payroll-Based Journal report covering October 1 – December 31, 2025.
Registered Nurse

Manages medical care and health needs.

RN Staff Info All 2 RN Staff are full-time employees. No contractors work on this role. 2
Average shift length Info Average shift length. Calculated as total hours divided by days worked and average staff per day. 9.5 hours
Licensed Practical Nurse

Assists with medical care and medications.

LPN Staff Info 16 total: 12 full-time employees and 4 contractors. 16
Average shift length Info Average shift length. Calculated as total hours divided by days worked and average staff per day. 9.5 hours
Certified Nursing Assistant

Helps with daily care and mobility.

CNA Staff Info All 36 CNA Staff are full-time employees. No contractors work on this role. 36
Average shift length Info Average shift length. Calculated as total hours divided by days worked and average staff per day. 7.8 hours

Contractor staffing

Q4 2025 · Oct 1 – Dec 31 More info This data comes from the CMS Payroll-Based Journal report covering October 1 – December 31, 2025.

Total hours from contractors

0.7%

144 contractor hours this quarter

Licensed Practical Nurse: 4 Occupational Therapy Assistant: 1 Occupational Therapy Aide: 1 Medical Director: 1

Staff by category

Q4 2025 · Oct 1 – Dec 31 More info This data comes from the CMS Payroll-Based Journal report covering October 1 – December 31, 2025.
Certified Nursing Assistant3603612,25892100%7.8
Licensed Practical Nurse124163,79292100%9.5
Medication Aide/Technician2021,0579199%11.2
RN Director of Nursing2027656773%8.2
Physical Therapy Aide3035567076%6
Other Dietary Services Staff1015456672%8.3
Registered Nurse2025365257%9.5
Nurse Practitioner2025346571%8
Clinical Nurse Specialist2024475054%8.9
Administrator2024125257%7.9
Mental Health Service Worker1013334145%8.1
Qualified Social Worker2022665762%3.9
Dental Services Staff2021982527%7.9
Speech Language Pathologist3031313841%3
Respiratory Therapy Technician101603942%1.5
Physical Therapy Assistant101563336%1.7
Medical Director011301112%2.7
Occupational Therapy Assistant0112567%4.2
Occupational Therapy Aide0112555%5
36 Certified Nursing Assistant
% of Days 100%
16 Licensed Practical Nurse
% of Days 100%
2 Medication Aide/Technician
% of Days 99%
2 RN Director of Nursing
% of Days 73%
3 Physical Therapy Aide
% of Days 76%
1 Other Dietary Services Staff
% of Days 72%
2 Registered Nurse
% of Days 57%
2 Nurse Practitioner
% of Days 71%
2 Clinical Nurse Specialist
% of Days 54%
2 Administrator
% of Days 57%
1 Mental Health Service Worker
% of Days 45%
2 Qualified Social Worker
% of Days 62%
2 Dental Services Staff
% of Days 27%
3 Speech Language Pathologist
% of Days 41%
1 Respiratory Therapy Technician
% of Days 42%
1 Physical Therapy Assistant
% of Days 36%
1 Medical Director
% of Days 12%
1 Occupational Therapy Assistant
% of Days 7%
1 Occupational Therapy Aide
% of Days 5%

Penalties and fines

Includes penalties issued in 2024

Federal penalties imposed by CMS for regulatory violations, including civil money penalties (fines) and denials of payment for new Medicare/Medicaid admissions.

Source: CMS Penalties Database (Data as of Jan 2026)

Total fines amount $15K
42% lower than Arkansas average

Arkansas average: $26K

Number of fines 1
32% fewer fines than Arkansas average

Arkansas average: 1.5

Payment Denials Info Serious action where Medicare and/or Medicaid temporarily stops payments for new residents until issues are fixed. 0
100% fewer payment denials than Arkansas average

Arkansas average: 0.2

Fines amount comparison
This facility $15K
Arkansas average $26K
Penalty History

Penalties are imposed by CMS for violations of federal nursing home regulations.

1 penalty in the past 3 years

Feb 8, 2024 · $15K

Civil Money Penalty Info Fines imposed for noncompliance, which can be assessed per day or per instance of violation. Feb 8, 2024
$15K

Last updated: Jan 2026

Quality of care over time

These measures show how residents usually do over time at this home, based on health outcomes and preventive care.

High-risk clinical events score Info A composite score based on pressure ulcers, falls with injury, weight loss, walking ability decline, and activities of daily living decline. 7.2
6% better than Arkansas average

Arkansas average: 7.7

Functional decline score Info A composite score based on activities of daily living decline, walking ability decline, and incontinence. 12.5
6% better than Arkansas average

Arkansas average: 13.3

Long-stay resident measures
Significantly above average Arkansas avg: 4.2 Info CMS star rating based on long-stay quality measure performance. 5 stars = significantly above average, 1 star = significantly below average.
Need for Help with Daily Activities Increased Info Percent of long-stay residents whose need for help with daily activities has increased 12.4%
8% worse than Arkansas average

Arkansas average: 11.5%

Walking Ability Worsened Info Percent of long-stay residents whose ability to move independently worsened 4.7%
65% better than Arkansas average

Arkansas average: 13.4%

Low Risk Residents with Bowel/Bladder Incontinence Info Percent of low risk long-stay residents who lose control of their bowels or bladder 20.4%
35% worse than Arkansas average

Arkansas average: 15.1%

Falls with Major Injury Info Percent of long-stay residents experiencing one or more falls with major injury 1.1%
73% better than Arkansas average

Arkansas average: 3.9%

High Risk Residents with Pressure Ulcers Info Percent of long-stay high risk residents with pressure ulcers 11.2%
136% worse than Arkansas average

Arkansas average: 4.7%

Urinary Tract Infection Info Percent of long-stay residents with a urinary tract infection 0.0%
100% better than Arkansas average

Arkansas average: 1.3%

Lost Too Much Weight Info Percent of long-stay residents who lose too much weight 6.8%
37% worse than Arkansas average

Arkansas average: 5.0%

Depressive Symptoms Info Percent of long-stay residents who have depressive symptoms 0.0%
100% better than Arkansas average

Arkansas average: 1.5%

Antipsychotic Use Info Percent of long-stay residents who received an antipsychotic medication 14.0%
34% worse than Arkansas average

Arkansas average: 10.5%

Pneumococcal Vaccine Info Percent of long-stay residents assessed and appropriately given the pneumococcal vaccine 88.2%
7% worse than Arkansas average

Arkansas average: 94.4%

Influenza Vaccine Info Percent of long-stay residents assessed and appropriately given the seasonal influenza vaccine 96.4%
In line with Arkansas average

Arkansas average: 96.2%

Hospitalizations per 1,000 days Info Number of hospitalizations per 1,000 long-stay resident days. 0.64
68% better than Arkansas average

Arkansas average: 1.97

ED visits per 1,000 days Info Number of outpatient emergency department visits per 1,000 long-stay resident days. 0.82
62% better than Arkansas average

Arkansas average: 2.18

Short-stay resident measures
Significantly below average Arkansas avg: 2.7 Info CMS star rating based on short-stay quality measure performance. 5 stars = much above average, 1 star = much below average.
Pneumococcal Vaccine Info Percent of short-stay residents assessed and appropriately given the pneumococcal vaccine 84.5%
In line with Arkansas average

Arkansas average: 80.9%

Antipsychotic medication increase Info Percent of short-stay residents who newly received an antipsychotic medication 1.3%
13% better than Arkansas average

Arkansas average: 1.5%

Influenza Vaccine Info Percent of short-stay residents assessed and appropriately given the seasonal influenza vaccine 71.4%
8% worse than Arkansas average

Arkansas average: 77.7%

Re-hospitalized after SNF stay Info Percentage of short-stay residents who were re-hospitalized after their nursing home admission. 32.5%
29% worse than Arkansas average

Arkansas average: 25.2%

Emergency department visits Info Percentage of short-stay residents who had an outpatient emergency department visit. 13.0%
6% better than Arkansas average

Arkansas average: 13.8%

Falls with major injury Info Percentage of SNF residents who experience falls with major injury during their stay. 1.5%
100% worse than Arkansas average

Arkansas average: 0.8%

Ability to care for self at discharge Info Percentage of residents at or above expected ability to care for themselves at discharge. 53.3%
In line with Arkansas average

Arkansas average: 53.7%

Successful return to home or community Info Rate of successful return to home or community from a skilled nursing facility. 30.0%
41% worse than Arkansas average

Arkansas average: 50.6%

Breakdown by payment type

Medicare

14% of new residents, usually for short-term rehab.

Typical stay 29 days

Private pay

80% of new residents, often for short stays.

Typical stay 1 - 2 months

Medicaid

6% of new residents, often for long-term daily care.

Typical stay 2 years

Facility Characteristics

Source: CMS Long-Term Care Facility Characteristics (Data as of Jan 2026)

Total residents 61
Medicare
14
23% of residents
Medicaid
27
44.3% of residents
Private pay or other
20
32.8% of residents
Programs & Services
Residents Group

Residents meet regularly to discuss policies, care quality, and activities

Nurse Aide Training

State-approved Nurse Aide Training and Competency Evaluation Program on-site

Active Resident Council

Organized group of residents that meets regularly to discuss facility policies, quality of life, and activities.

Finances and operations

Based on CMS SNF Cost Report for fiscal year ending in 12/2023.

For-profit
Operated by a single business entity.
Net patient revenue Info Net patient revenue — what the home actually collects for resident care, after contractual allowances, bad debt and discounts are subtracted from its gross charges (CMS cost report, Worksheet G-3). It covers resident care only; money the home earns from other sources is shown separately as "Other income."
$4.4M
Net patient income Info Net patient income: net patient revenue minus the home's total operating expenses. A positive figure means it earns more from resident care than it spends to deliver it; a negative figure means the opposite. It excludes non-operating "other income."
-$218.2K
For-profit Operated by a single business entity.
Net patient revenue Info Net patient revenue — what the home actually collects for resident care, after contractual allowances, bad debt and discounts are subtracted from its gross charges (CMS cost report, Worksheet G-3). It covers resident care only; money the home earns from other sources is shown separately as "Other income."
$4.4M
Net patient income Info Net patient income: net patient revenue minus the home's total operating expenses. A positive figure means it earns more from resident care than it spends to deliver it; a negative figure means the opposite. It excludes non-operating "other income."
-$218.2K
Other income Info Money the home earns outside of resident care — such as investments, grants, rentals and other non-operating sources (CMS cost report, Worksheet G-3). It is tracked separately from net patient revenue: it is not part of that figure, and it is not included in net patient income.
$97
Payroll costs Info Staff salaries plus wage-related costs — benefits such as payroll taxes, health insurance and retirement — from the home's own accounting records (CMS cost report, Worksheet A). Contract or agency labor is counted separately, under other operating costs.
$2.1M 47.1% of net patient revenue Info Payroll as a share of revenue: staff salaries and wage-related benefits divided by net patient revenue. A higher figure means more of each revenue dollar goes to staff pay.
Other operating costs Info Everything it costs to run the home apart from payroll — food, utilities, supplies, maintenance, contract labor and administration. Calculated as total operating expense minus payroll (staff salaries and wage-related benefits).
$2.6M
Total costs Info The home's total operating expense for the year — all the costs of running it, salaries included (CMS cost report, Worksheet G-3).
$4.6M

What does this home offer?

Building type icon
Building type icon

Building Type: Single-story

On-site medical care and health services icon

On-site Medical Care and Health Services

Who this home usually serves

TYPE OF STAY

Primarily short stays

Residents typically stay for brief periods, with frequent admissions and discharges throughout the year.

Most new residents arrive under private pay (80% of admissions), and a typical private pay stay runs around 1 - 2 months.

Admissions
172 total

Coverage residents most often arrive under.

Medicare 14%
Private pay 80%
Medicaid 6%
Discharges
169 total

Coverage residents most often leave under.

Medicare 13%
Private pay 82%
Medicaid 5%

Places of interest near Lakewood Therapy and Living Center

Address 5.3 miles from city center Info Estimated distance in miles from Hot Springs's city center to Lakewood Therapy and Living Center's address, calculated via Google Maps.

Calculate Travel Distance to Lakewood Therapy and Living Center

Add your location

Address

Compare Nursing Homes around Hot Springs

The information below is reported by the Arkansas Department of Human Services, Office of Long Term Care.

5 facilities compared · CMS & AR Dept. of Health data

Quapaw Care and Rehabilitation Center, LLC
NH
RC
Hot Springs
126
Facility 126
AR AVG 84
Rank #50 / 330
81.0% +14%5.72 -67%+22%$0258.3-92-
81
Facility 81
AR AVG 34
Rank #1 / 419
Cindy Farmer$12.0M$5.5M45.6%45338
Lake Hamilton Health and Rehab
NH
NC
Hot Springs
84
Facility 84
AR AVG 84
Rank #176 / 330
88.5% +24%4.72 -71%+1%$0227.3-74-
81
Facility 81
AR AVG 34
Rank #1 / 419
Amanda Levato$9.9M$3.6M37%45445
The Springs of Park Avenue
NH
HC
MC
PC
Hot Springs
95
Facility 95
AR AVG 84
Rank #151 / 330
73.1% +3%4.27 +38%-9%$0235.8-76-
17
Facility 17
AR AVG 34
Rank #307 / 419
Stacy Luster$9.4M$3.4M36%45142
Lakewood Therapy and Living Center
NH
Hot Springs
80
Facility 80
AR AVG 84
Rank #186 / 330
57.5% -19%4.93 -54%+6%$14.9k244.0151A+
4
Facility 4
AR AVG 34
Rank #373 / 419
-$4.4M$2.1M47.1%45404
Belvedere Nursing and Rehabilitation Center, LLC
NH
Hot Springs
120
Facility 120
AR AVG 84
Rank #59 / 330
95.0% +33%4.66 -74%0%$206.9k255.03118-
0
Facility 0
AR AVG 34
Rank #405 / 419
Belvedere Nursing And Rehabilitation Center, LLC$15.5M$5.8M37.5%45463

Financial Assistance for
Nursing Home in Arkansas

Lakewood Therapy and Living Center is located in Hot Springs, Arkansas.
Here are the financial assistance programs available to residents in Arkansas.

Get Financial aid guidance

ARChoices

Arkansas Medicaid ARChoices

Age 65+ or 21+ with disability
General Arkansas resident, Medicaid- eligible, nursing home-level care need.
Income Limits (2025) ~$2,829/month 300% FBR, individual
Asset Limits $2,000 (individual), $3,000 (couple).
AR

Rural focus; possible waitlists.

Benefits
Personal care (5-7 hours/day) Meals ($7/meal) Respite care (240 hours/year) Adult day services ($60/day)

Choices in Living Resource Center

Arkansas Choices in Living

Age 60+
General Arkansas resident.
Income Limits No strict limit; prioritizes low-income.
Asset Limits Not applicable.
AR

Limited direct funding; mostly referral-based.

Benefits
Care coordination Limited respite (up to 5 days/year) Transportation assistance (~5 trips/month)

Living Choices Assisted Living Waiver

Arkansas Medicaid Living Choices Assisted Living Waiver

Age 65+
General Arkansas resident, requires nursing home-level care, lives in a Level II assisted living facility.
Income Limits (2025) ~$2,829/month 300% FBR, individual
Asset Limits $2,000 (individual), $3,000 (couple); spousal rules apply.
AR

Limited provider network; excludes Level I facilities (no nursing services).

Benefits
Personal care (~5 hours/day) Medication management Nursing Activities Transportation

Program of All-Inclusive Care for the Elderly (PACE)

Arkansas Medicaid PACE

Age 55+
General Arkansas resident, nursing home-level care, safe with PACE support.
Income Limits (2025) ~$2,829/month 300% FBR
Asset Limits $2,000 (individual), $3,000 (couple).
AR

Limited geographic availability.

Benefits
Primary/preventive care Personal care (5-7 hours/day) Meals Transportation Therapy

Arkansas State Plan Personal Care

Arkansas Medicaid Personal Care Program

Age
General Any age, Arkansas resident, needs ADL/IADL help, Medicaid-eligible.
Income Limits (2025) ~$1,004/month individual
Asset Limits $9,660 (individual), $14,470 (couple).
AR

No nursing home-level care requirement.

Benefits
Personal care (~4-6 hours/day) Homemaker services (e.g., meal prep)

Frequently Asked Questions about Lakewood Therapy and Living Center

Is Lakewood Therapy and Living Center in a walkable area?

Lakewood Therapy and Living Center has a walk score of 4. Car-dependent. Most errands require a car, with limited nearby walkable options.

What is the occupancy rate at Lakewood Therapy and Living Center?

Lakewood Therapy and Living Center's occupancy is 46.0%.

Does Lakewood Therapy and Living Center operate as a for-profit or non-profit?

Lakewood Therapy and Living Center is registered as a for-profit in AR.

Are there photos of Lakewood Therapy and Living Center?

Yes — there are 5 photos of Lakewood Therapy and Living Center in the photo gallery on this page.

What is the address of Lakewood Therapy and Living Center?

Lakewood Therapy and Living Center is located at 260 Lakepark Drive, Hot Springs, AR 71901.

What is the phone number of Lakewood Therapy and Living Center?

(501) 262-1920 will put you in contact with the team at Lakewood Therapy and Living Center.

Is Lakewood Therapy and Living Center Medicare or Medicaid certified?

Yes — Lakewood Therapy and Living Center is a CMS-certified provider of Medicare and Medicaid.

Guides for Better Senior Living

Care Cost Calculator: See Prices in Your Area

Nursing Home Data Explorer

Don’t Wait Too Long: 7 Red Flag Signs Your Parent Needs Assisted Living Now

The True Cost of Assisted Living in 2025 – And How Families Are Paying For It

Understanding Senior Living Costs: Pricing Models, Discounts & Financial Assistance