The Springs of Park Avenue
Nursing Home, Hospice Care, Memory Care & Palliative Care · Hot Springs, AR
CMS overall rating Info CMS (the Centers for Medicare & Medicaid Services) is the federal agency that rates nursing home quality. Its Overall Rating runs from 1 to 5 stars, combining health inspections, staffing, and quality measures, with inspections weighted most heavily.

The Springs of Park Avenue

Nursing Home, Hospice Care, Memory Care & Palliative Care · Hot Springs, AR
CMS overall rating Info CMS (the Centers for Medicare & Medicaid Services) is the federal agency that rates nursing home quality. Its Overall Rating runs from 1 to 5 stars, combining health inspections, staffing, and quality measures, with inspections weighted most heavily.
Calculator: See prices in your area
The Springs of Park Avenue accepts Medicare, Medicaid, and private pay.

Overview of The Springs of Park Avenue

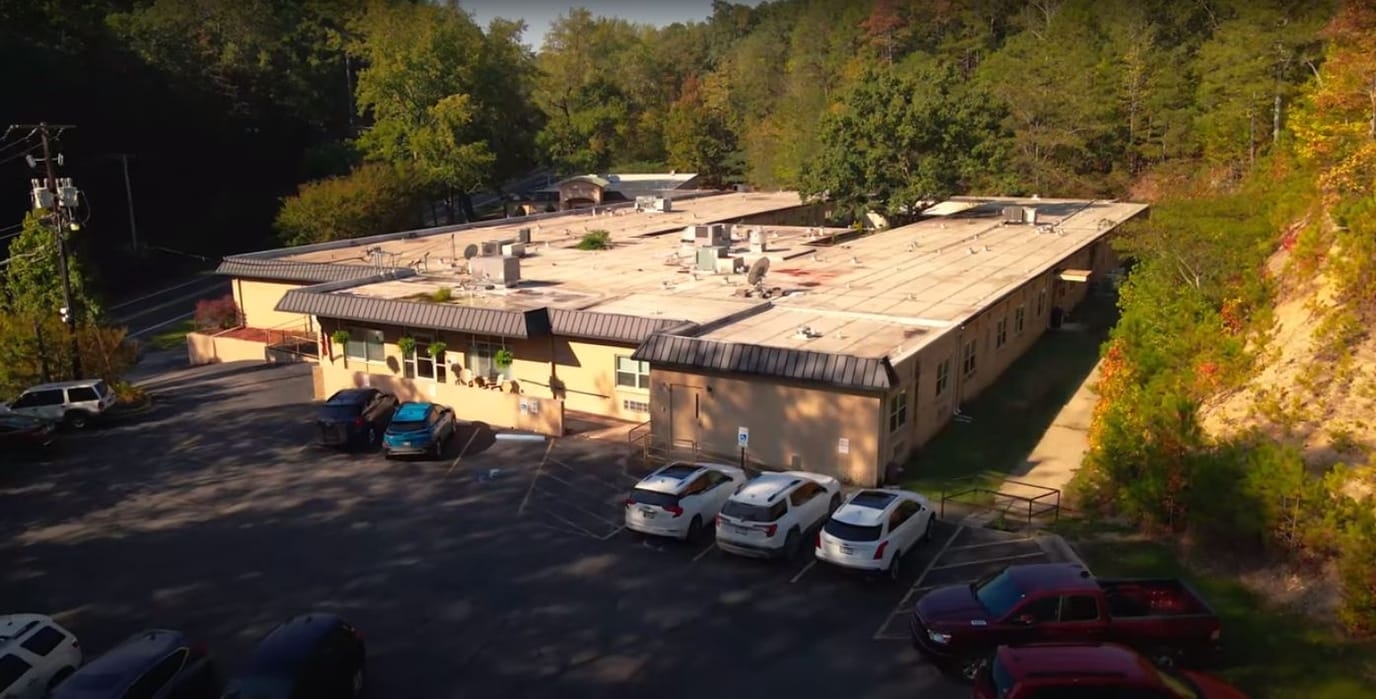
Located at 1401 Park Avenue in Hot Springs, Arkansas, The Springs of Park Avenue functions as a specialized nexus for skilled nursing, rehabilitation, and memory care. The financial model accommodates Medicare, Medicaid, and private pay structures.

Operational metrics indicate an average stay of 77 days. This duration suggests a post-acute rehabilitation focus where the system prioritizes recovery and discharge over long-term residency. Occupancy is maintained at 73.1%. Daily staffing allocation per resident totals 4 hours and 16 minutes, partitioned into 24 minutes of RN care, 56 minutes from LPNs, and 2 hours and 21 minutes from nurse aides.

Memory care is centralized within the Serenity at The Springs unit. The clinical framework integrates telemedicine to facilitate immediate physician consultations and reduce hospital transfers. Available interventions include IV and orthopedic therapy, stroke recovery, post-surgical support, pain management, and diabetic care.

The site possesses a Walk Score of 17. Consequently, logistics for off-campus transit rely entirely on vehicles.

The Springs of Park Avenue represents an efficient option for families seeking a recovery-oriented model that combines short-term rehabilitation with on-site memory care infrastructure.

Quality ratings

Measured by Centers for Medicare & Medicaid Services (CMS)

Overall rating Info The Overall CMS Rating combines results from health inspections, staffing levels and quality measures. Health inspections carry the most weight. Staffing and quality scores can increase or decrease the final rating based on performance compared to state and national standards.
▼ 4.4% Below AR avg. ▼ 4.4% Below AR avg.AR average: 3.1Click the badge to see the full State ranking.Click here to see the full State ranking.
Health Inspection Info Based on the results of the facility's three most recent standard inspections and any complaint investigations. CMS reviews the number, scope, and severity of deficiencies, with more recent findings weighted more heavily.
▲ 3.8% Above AR avg. ▲ 3.8% Above AR avg.AR average: 2.9Click the badge to see the full State ranking.Click here to see the full State ranking.
Staffing Info Measures average nursing staff hours per resident per day, including Registered Nurses (RNs) and total nursing staff. Ratings are adjusted based on the level of care residents require and are compared to state and national benchmarks.
▼ 5.8% Below AR avg. ▼ 5.8% Below AR avg.AR average: 3.2Click the badge to see the full State ranking.Click here to see the full State ranking.
Quality Measures Info Based on clinical and physical health indicators reported to CMS, such as hospital readmissions, falls, pressure ulcers, and improvements in mobility. These measures reflect how well residents' health needs are being managed.
▲ 9.3% Above AR avg. ▲ 9.3% Above AR avg.AR average: 3.7Click the badge to see the full State ranking.Click here to see the full State ranking.

Staffing hours breakdown

Info Daily nursing hours per resident by staff type, reported to CMS. Higher is generally better — compare this facility to state and national averages to see where staffing stands.

Hours per resident per day — compared to Arkansas state averages

Total nursing care / resident Info Total adjusted nursing hours per resident per day, combining RN, LPN, and aide time. CMS adjusts this for case-mix so facilities can be fairly compared.
4h 16m per day
This facility Arkansas avg (4h 40m per day)
vs Arkansas avg
-9%

2 of 6 metrics below state avg

Standout metric Weekend RN is +72% above state avg
Staff typeHours / Day / Residentvs state avg
Registered Nurse (RN) Info RNs hold the highest nursing license and can assess residents, interpret test results, and direct care plans. More RN hours per day often signals stronger clinical oversight and faster response to health changes. 24m per day ■ Avg State avg: 24m per day · National avg: 41m per day
LPN / LVN Info Licensed Practical Nurses (LPNs) or Licensed Vocational Nurses (LVNs) deliver routine hands-on care — medication administration, wound dressing, and monitoring vital signs. They work under RN supervision and make up a large share of daily bedside care. 56m per day ■ Avg State avg: 57m per day · National avg: 52m per day
Nurse Aide Info Certified Nurse Aides (CNAs) provide the most direct day-to-day assistance: bathing, dressing, feeding, and mobility. Nurse aide hours are typically the largest staffing category and directly affect residents' quality of life. 2h 21m per day ▼ 14% State avg: 2h 44m per day · National avg: 2h 21m per day
Weekend Total Nursing Info Combined nursing hours (RN + LPN + Nurse Aide) per resident per day on weekends. Staffing often drops on weekends — this figure reveals whether the facility maintains adequate coverage outside of weekday hours. 3h 32m per day ■ Avg State avg: 3h 29m per day · National avg: 3h 26m per day
Physical Therapist Info Hours per resident per day provided by licensed Physical Therapists (PTs) or PT Assistants. PT services help residents recover mobility after injury or illness and are especially important for post-acute (short-stay) rehabilitation. 1m per day ▼ 59% State avg: 2m per day · National avg: 4m per day
Weekend RN Info Registered nurse hours specifically on weekends. Facilities sometimes reduce RN presence on Saturdays and Sundays — a low weekend RN figure compared to weekday hours can indicate reduced clinical oversight when most administrative staff are absent. 28m per day ▲ 72% State avg: 16m per day · National avg: 29m per day

Capacity and availability

This home usually has availability

Higher occupancy than the Arkansas average: 71.3%
Occupancy rate
73.1%
Avg. Length of Stay
77 days
Bed community size
95-bed community Rank #151 / 330Bed count — State benchmarkedThis home is ranked 151st out of 330 homes in Arkansas. Shows this facility's certified or reported bed count compared to other Arkansas facilities. Larger communities may offer more amenities, programs, and on-site services for residents and families.Rankings are based only on facilities in Arkansas that report data for that category. Facilities without available data are excluded from the ranking.Click the rank badge to see the full State ranking.Click here to see the full State ranking.
A larger shared setting that may offer more common spaces and organized community services.
Walk Score
Walk Score: 17 / 100 Rank #307 / 419Walk Score — State benchmarkedThis home is ranked 307th out of 419 homes in Arkansas. Shows how walkable this facility's neighborhood is compared to the average Walk Score across Arkansas facilities. Higher scores benefit residents, families, and staff.Rankings are based only on facilities in Arkansas that report data for that category. Facilities without available data are excluded from the ranking.Click the rank badge to see the full State ranking.Click here to see the full State ranking.
Car-dependent. Most errands require a car, with limited nearby walkable options.

Contact The Springs of Park Avenue

Staffing Data

Reporting period: October 1 – December 31, 2025 (Q4 2025). Source: CMS Payroll-Based Journal report.

Total staff 107
Employees 104
Contractors 3
Staff to resident ratio 1.43 : 1
10% fewer staff per resident than Arkansas average
Arkansas average ratio: 1.59 : 1 Arkansas average ratio: 1.59 : 1See full Arkansas ranking
Avg staff/day 40
Average shift 7.8 hours
0% compared with Arkansas average
Arkansas average: 8 hours Arkansas average shift: 8 hoursSee full Arkansas ranking
Total staff hours (quarter) 28,579

Nursing staff breakdown

Q4 2025 · Oct 1 – Dec 31 More info This data comes from the CMS Payroll-Based Journal report covering October 1 – December 31, 2025.
Registered Nurse

Manages medical care and health needs.

RN Staff Info All 8 RN Staff are full-time employees. No contractors work on this role. 8
Average shift length Info Average shift length. Calculated as total hours divided by days worked and average staff per day. 8.7 hours
Licensed Practical Nurse

Assists with medical care and medications.

LPN Staff Info All 24 LPN Staff are full-time employees. No contractors work on this role. 24
Average shift length Info Average shift length. Calculated as total hours divided by days worked and average staff per day. 8.1 hours
Certified Nursing Assistant

Helps with daily care and mobility.

CNA Staff Info All 48 CNA Staff are full-time employees. No contractors work on this role. 48
Average shift length Info Average shift length. Calculated as total hours divided by days worked and average staff per day. 8.2 hours

Contractor staffing

Q4 2025 · Oct 1 – Dec 31 More info This data comes from the CMS Payroll-Based Journal report covering October 1 – December 31, 2025.

Total hours from contractors

0.3%

94 contractor hours this quarter

Occupational Therapy Aide: 1 Occupational Therapy Assistant: 1 Medical Director: 1

Staff by category

Q4 2025 · Oct 1 – Dec 31 More info This data comes from the CMS Payroll-Based Journal report covering October 1 – December 31, 2025.
Certified Nursing Assistant4804816,07792100%8.2
Licensed Practical Nurse240244,81492100%8.1
RN Director of Nursing4041,7126773%7.5
Registered Nurse8081,2649098%8.7
Clinical Nurse Specialist2029298087%10
Physical Therapy Aide3037308693%5.7
Nurse Practitioner4045546672%8.2
Dental Services Staff1015166874%7.6
Administrator1015126470%8
Other Dietary Services Staff1014846975%7
Medication Aide/Technician2023973639%9.9
Qualified Social Worker2022447177%2.7
Respiratory Therapy Technician101974953%2
Speech Language Pathologist202832527%3.2
Physical Therapy Assistant101734145%1.8
Occupational Therapy Aide0113989%4.9
Medical Director011351011%3.5
Occupational Therapy Assistant0112078%2.9
48 Certified Nursing Assistant
% of Days 100%
24 Licensed Practical Nurse
% of Days 100%
4 RN Director of Nursing
% of Days 73%
8 Registered Nurse
% of Days 98%
2 Clinical Nurse Specialist
% of Days 87%
3 Physical Therapy Aide
% of Days 93%
4 Nurse Practitioner
% of Days 72%
1 Dental Services Staff
% of Days 74%
1 Administrator
% of Days 70%
1 Other Dietary Services Staff
% of Days 75%
2 Medication Aide/Technician
% of Days 39%
2 Qualified Social Worker
% of Days 77%
1 Respiratory Therapy Technician
% of Days 53%
2 Speech Language Pathologist
% of Days 27%
1 Physical Therapy Assistant
% of Days 45%
1 Occupational Therapy Aide
% of Days 9%
1 Medical Director
% of Days 11%
1 Occupational Therapy Assistant
% of Days 8%

Penalties and fines

Federal penalties imposed by CMS for regulatory violations, including civil money penalties (fines) and denials of payment for new Medicare/Medicaid admissions.

Source: CMS Penalties Database

No penalties in the past 3 years

No civil money penalties or payment denials were reported in the last 3 years.

Quality of care over time

These measures show how residents usually do over time at this home, based on health outcomes and preventive care.

High-risk clinical events score Info A composite score based on pressure ulcers, falls with injury, weight loss, walking ability decline, and activities of daily living decline. 2.4
69% better than Arkansas average

Arkansas average: 7.7

Functional decline score Info A composite score based on activities of daily living decline, walking ability decline, and incontinence. 7.0
48% better than Arkansas average

Arkansas average: 13.3

Long-stay resident measures
Significantly above average Arkansas avg: 4.2 Info CMS star rating based on long-stay quality measure performance. 5 stars = significantly above average, 1 star = significantly below average.
Need for Help with Daily Activities Increased Info Percent of long-stay residents whose need for help with daily activities has increased 3.0%
74% better than Arkansas average

Arkansas average: 11.5%

Walking Ability Worsened Info Percent of long-stay residents whose ability to move independently worsened 2.1%
84% better than Arkansas average

Arkansas average: 13.4%

Low Risk Residents with Bowel/Bladder Incontinence Info Percent of low risk long-stay residents who lose control of their bowels or bladder 15.8%
5% worse than Arkansas average

Arkansas average: 15.1%

Falls with Major Injury Info Percent of long-stay residents experiencing one or more falls with major injury 1.3%
68% better than Arkansas average

Arkansas average: 3.9%

High Risk Residents with Pressure Ulcers Info Percent of long-stay high risk residents with pressure ulcers 4.6%
In line with Arkansas average

Arkansas average: 4.7%

Urinary Tract Infection Info Percent of long-stay residents with a urinary tract infection 0.0%
100% better than Arkansas average

Arkansas average: 1.3%

Lost Too Much Weight Info Percent of long-stay residents who lose too much weight 1.1%
79% better than Arkansas average

Arkansas average: 5.0%

Depressive Symptoms Info Percent of long-stay residents who have depressive symptoms 0.0%
100% better than Arkansas average

Arkansas average: 1.5%

Antipsychotic Use Info Percent of long-stay residents who received an antipsychotic medication 9.4%
10% better than Arkansas average

Arkansas average: 10.5%

Pneumococcal Vaccine Info Percent of long-stay residents assessed and appropriately given the pneumococcal vaccine 98.7%
5% better than Arkansas average

Arkansas average: 94.4%

Influenza Vaccine Info Percent of long-stay residents assessed and appropriately given the seasonal influenza vaccine 97.1%
In line with Arkansas average

Arkansas average: 96.2%

Hospitalizations per 1,000 days Info Number of hospitalizations per 1,000 long-stay resident days. 2.30
17% worse than Arkansas average

Arkansas average: 1.97

ED visits per 1,000 days Info Number of outpatient emergency department visits per 1,000 long-stay resident days. 1.33
39% better than Arkansas average

Arkansas average: 2.18

Short-stay resident measures
Above average Arkansas avg: 2.7 Info CMS star rating based on short-stay quality measure performance. 5 stars = much above average, 1 star = much below average.
Pneumococcal Vaccine Info Percent of short-stay residents assessed and appropriately given the pneumococcal vaccine 96.0%
19% better than Arkansas average

Arkansas average: 80.9%

Antipsychotic medication increase Info Percent of short-stay residents who newly received an antipsychotic medication 2.9%
89% worse than Arkansas average

Arkansas average: 1.5%

Influenza Vaccine Info Percent of short-stay residents assessed and appropriately given the seasonal influenza vaccine 84.8%
9% better than Arkansas average

Arkansas average: 77.7%

Re-hospitalized after SNF stay Info Percentage of short-stay residents who were re-hospitalized after their nursing home admission. 23.0%
9% better than Arkansas average

Arkansas average: 25.2%

Emergency department visits Info Percentage of short-stay residents who had an outpatient emergency department visit. 10.4%
25% better than Arkansas average

Arkansas average: 13.8%

Falls with major injury Info Percentage of SNF residents who experience falls with major injury during their stay. 1.1%
45% worse than Arkansas average

Arkansas average: 0.8%

Ability to care for self at discharge Info Percentage of residents at or above expected ability to care for themselves at discharge. 41.2%
23% worse than Arkansas average

Arkansas average: 53.7%

Successful return to home or community Info Rate of successful return to home or community from a skilled nursing facility. 54.8%
8% better than Arkansas average

Arkansas average: 50.6%

Breakdown by payment type

Medicare

24% of new residents, usually for short-term rehab.

Typical stay 1 - 2 months

Private pay

64% of new residents, often for short stays.

Typical stay 1 - 2 months

Medicaid

12% of new residents, often for long-term daily care.

Typical stay 11 months

Facility Characteristics

Source: CMS Long-Term Care Facility Characteristics (Data as of Jan 2026)

Total residents 75
Medicare
22
29.3% of residents
Medicaid
38
50.7% of residents
Private pay or other
15
20% of residents
Programs & Services
Residents Group

Residents meet regularly to discuss policies, care quality, and activities

Active Resident Council

Organized group of residents that meets regularly to discuss facility policies, quality of life, and activities.

Finances and operations

Based on CMS SNF Cost Report for fiscal year ending in 06/2024.

For-profit
Operated by a single business entity.
Net patient revenue Info Net patient revenue — what the home actually collects for resident care, after contractual allowances, bad debt and discounts are subtracted from its gross charges (CMS cost report, Worksheet G-3). It covers resident care only; money the home earns from other sources is shown separately as "Other income."
$9.4M
Net patient income Info Net patient income: net patient revenue minus the home's total operating expenses. A positive figure means it earns more from resident care than it spends to deliver it; a negative figure means the opposite. It excludes non-operating "other income."
$1.0M
For-profit Operated by a single business entity.
Net patient revenue Info Net patient revenue — what the home actually collects for resident care, after contractual allowances, bad debt and discounts are subtracted from its gross charges (CMS cost report, Worksheet G-3). It covers resident care only; money the home earns from other sources is shown separately as "Other income."
$9.4M
Net patient income Info Net patient income: net patient revenue minus the home's total operating expenses. A positive figure means it earns more from resident care than it spends to deliver it; a negative figure means the opposite. It excludes non-operating "other income."
$1.0M
Other income Info Money the home earns outside of resident care — such as investments, grants, rentals and other non-operating sources (CMS cost report, Worksheet G-3). It is tracked separately from net patient revenue: it is not part of that figure, and it is not included in net patient income.
$1.2K
Payroll costs Info Staff salaries plus wage-related costs — benefits such as payroll taxes, health insurance and retirement — from the home's own accounting records (CMS cost report, Worksheet A). Contract or agency labor is counted separately, under other operating costs.
$3.4M 36% of net patient revenue Info Payroll as a share of revenue: staff salaries and wage-related benefits divided by net patient revenue. A higher figure means more of each revenue dollar goes to staff pay.
Other operating costs Info Everything it costs to run the home apart from payroll — food, utilities, supplies, maintenance, contract labor and administration. Calculated as total operating expense minus payroll (staff salaries and wage-related benefits).
$5.0M
Total costs Info The home's total operating expense for the year — all the costs of running it, salaries included (CMS cost report, Worksheet G-3).
$8.3M

Who this home usually serves

TYPE OF STAY

Primarily short stays

Residents typically stay for brief periods, with frequent admissions and discharges throughout the year.

Most new residents arrive under private pay (64% of admissions), and a typical private pay stay runs around 1 - 2 months.

Admissions
330 total

Coverage residents most often arrive under.

Medicare 24%
Private pay 64%
Medicaid 12%
Discharges
330 total

Coverage residents most often leave under.

Medicare 23%
Private pay 59%
Medicaid 18%

Places of interest near The Springs of Park Avenue

Address 2.4 miles from city center Info Estimated distance in miles from Hot Springs's city center to The Springs of Park Avenue's address, calculated via Google Maps.

Calculate Travel Distance to The Springs of Park Avenue

Add your location

Address

Compare Nursing Homes around Hot Springs

The information below is reported by the Arkansas Department of Human Services, Office of Long Term Care.

5 facilities compared · CMS & AR Dept. of Health data

Quapaw Care and Rehabilitation Center, LLC
NH
RC
Hot Springs
126
Facility 126
AR AVG 84
Rank #50 / 330
81.0% +14%5.72 -67%+22%$0258.3-92-
81
Facility 81
AR AVG 34
Rank #1 / 419
Cindy Farmer$12.0M$5.5M45.6%45338
Lake Hamilton Health and Rehab
NH
NC
Hot Springs
84
Facility 84
AR AVG 84
Rank #176 / 330
88.5% +24%4.72 -71%+1%$0227.3-74-
81
Facility 81
AR AVG 34
Rank #1 / 419
Amanda Levato$9.9M$3.6M37%45445
The Springs of Park Avenue
NH
HC
MC
PC
Hot Springs
95
Facility 95
AR AVG 84
Rank #151 / 330
73.1% +3%4.27 +38%-9%$0235.8-76-
17
Facility 17
AR AVG 34
Rank #307 / 419
Stacy Luster$9.4M$3.4M36%45142
Lakewood Therapy and Living Center
NH
Hot Springs
80
Facility 80
AR AVG 84
Rank #186 / 330
57.5% -19%4.93 -54%+6%$14.9k244.0151A+
4
Facility 4
AR AVG 34
Rank #373 / 419
-$4.4M$2.1M47.1%45404
Belvedere Nursing and Rehabilitation Center, LLC
NH
Hot Springs
120
Facility 120
AR AVG 84
Rank #59 / 330
95.0% +33%4.66 -74%0%$206.9k255.03118-
0
Facility 0
AR AVG 34
Rank #405 / 419
Belvedere Nursing And Rehabilitation Center, LLC$15.5M$5.8M37.5%45463

Financial Assistance for
Nursing Home in Arkansas

The Springs of Park Avenue is located in Hot Springs, Arkansas.
Here are the financial assistance programs available to residents in Arkansas.

Get Financial aid guidance

ARChoices

Arkansas Medicaid ARChoices

Age 65+ or 21+ with disability
General Arkansas resident, Medicaid- eligible, nursing home-level care need.
Income Limits (2025) ~$2,829/month 300% FBR, individual
Asset Limits $2,000 (individual), $3,000 (couple).
AR

Rural focus; possible waitlists.

Benefits
Personal care (5-7 hours/day) Meals ($7/meal) Respite care (240 hours/year) Adult day services ($60/day)

Choices in Living Resource Center

Arkansas Choices in Living

Age 60+
General Arkansas resident.
Income Limits No strict limit; prioritizes low-income.
Asset Limits Not applicable.
AR

Limited direct funding; mostly referral-based.

Benefits
Care coordination Limited respite (up to 5 days/year) Transportation assistance (~5 trips/month)

Living Choices Assisted Living Waiver

Arkansas Medicaid Living Choices Assisted Living Waiver

Age 65+
General Arkansas resident, requires nursing home-level care, lives in a Level II assisted living facility.
Income Limits (2025) ~$2,829/month 300% FBR, individual
Asset Limits $2,000 (individual), $3,000 (couple); spousal rules apply.
AR

Limited provider network; excludes Level I facilities (no nursing services).

Benefits
Personal care (~5 hours/day) Medication management Nursing Activities Transportation

Program of All-Inclusive Care for the Elderly (PACE)

Arkansas Medicaid PACE

Age 55+
General Arkansas resident, nursing home-level care, safe with PACE support.
Income Limits (2025) ~$2,829/month 300% FBR
Asset Limits $2,000 (individual), $3,000 (couple).
AR

Limited geographic availability.

Benefits
Primary/preventive care Personal care (5-7 hours/day) Meals Transportation Therapy

Arkansas State Plan Personal Care

Arkansas Medicaid Personal Care Program

Age
General Any age, Arkansas resident, needs ADL/IADL help, Medicaid-eligible.
Income Limits (2025) ~$1,004/month individual
Asset Limits $9,660 (individual), $14,470 (couple).
AR

No nursing home-level care requirement.

Benefits
Personal care (~4-6 hours/day) Homemaker services (e.g., meal prep)

Frequently Asked Questions about The Springs of Park Avenue

Is The Springs of Park Avenue in a walkable area?

The Springs of Park Avenue has a walk score of 17. Car-dependent. Most errands require a car, with limited nearby walkable options.

What is the occupancy rate at The Springs of Park Avenue?

The Springs of Park Avenue's occupancy is 73.1%.

Does The Springs of Park Avenue operate as a for-profit or non-profit?

The Springs of Park Avenue is registered as a for-profit in AR.

Are there photos of The Springs of Park Avenue?

Yes — there are 4 photos of The Springs of Park Avenue in the photo gallery on this page.

What is the address of The Springs of Park Avenue?

The Springs of Park Avenue is located at 1401 Park Avenue, Hot Springs, AR 71901.

What is the phone number of The Springs of Park Avenue?

(501) 327-0200 will put you in contact with the team at The Springs of Park Avenue.

Is The Springs of Park Avenue Medicare or Medicaid certified?

Yes — The Springs of Park Avenue is a CMS-certified provider of Medicare and Medicaid.

Guides for Better Senior Living

Care Cost Calculator: See Prices in Your Area

Nursing Home Data Explorer

Don’t Wait Too Long: 7 Red Flag Signs Your Parent Needs Assisted Living Now

The True Cost of Assisted Living in 2025 – And How Families Are Paying For It

Understanding Senior Living Costs: Pricing Models, Discounts & Financial Assistance