


Landow House
Nursing Home, Assisted Living, Home Care, Independent Living, Memory Care & Skilled Nursing · Rockville, MD
Landow House
Nursing Home, Assisted Living, Home Care, Independent Living, Memory Care & Skilled Nursing · Rockville, MD
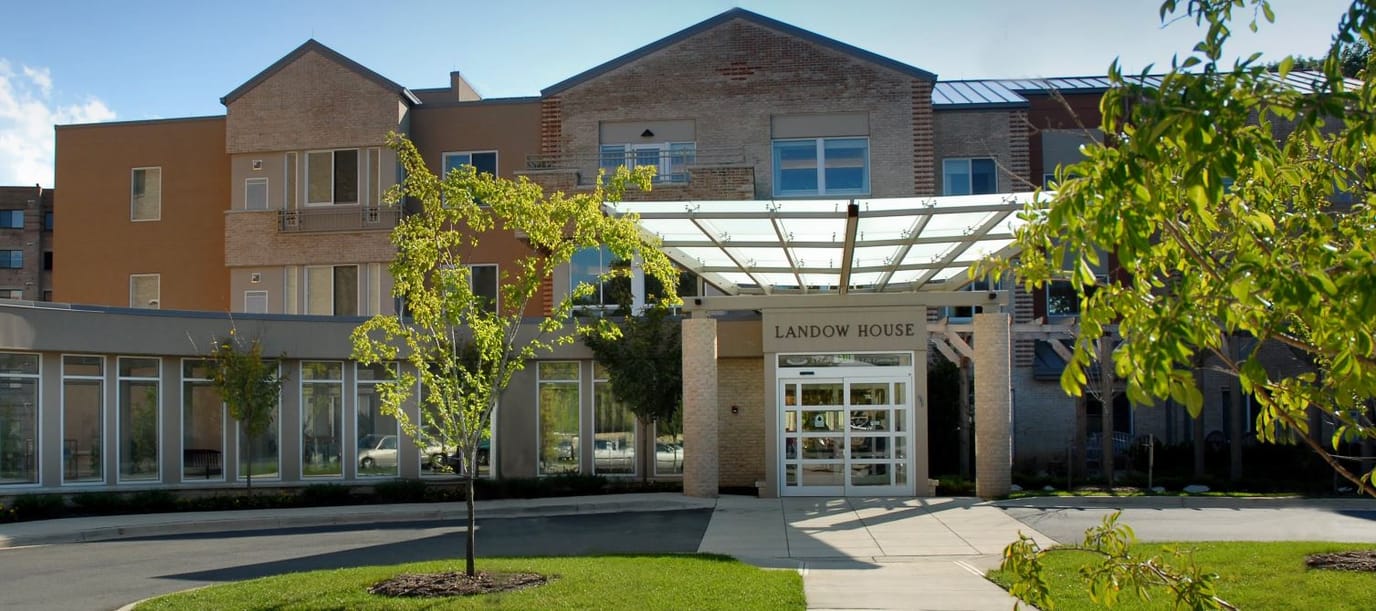
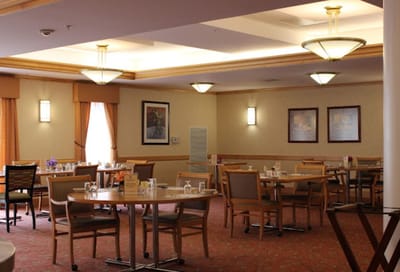
Nestled within the heart of Rockville, Maryland, Landow House stands as a haven where seniors can cherish their independence while residing in luxurious assisted living apartments. With a commitment to exceptional service, this residence offers daily assistance and provides a seamless blend of comfort and quality within its assisted living facilities. Here, residents find themselves immersed in a world of meaningful experiences that cater to their unique needs.
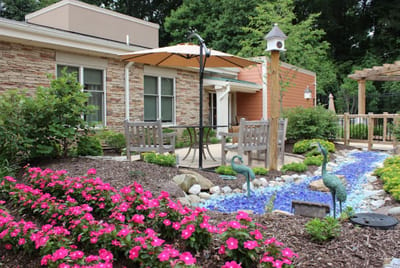
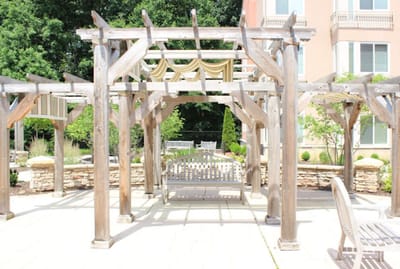
With the presence of an on-site licensed nurse available around the clock, as well as rigorous cleaning protocols for high-touch areas, the community fosters an environment of safety and reassurance. State-of-the-art amenities, including physical, occupational, and speech therapy services, further enhance the quality of life here. Physician services are conveniently offered on campus, and a diverse array of floor plans for assisted living apartments cater to individual preferences. From engaging leisure activities to delightful dining options, Landow House features a future movie theater, an inviting library, an art gallery, an outdoor garden, and more, creating a multi-awarded community that continues to exceed expectations in its commitment to excellence.
98-bed community Rank #131 / 690Bed count — State benchmarkedThis home is ranked 131st out of 690 homes in Maryland for Bed Count. Shows this facility's certified or reported bed count compared to other Maryland facilities. Larger communities may offer more amenities, programs, and on-site services for residents and families.Facilities with the same value for a metric share the same rank. Rankings are based only on facilities in Maryland that report data for that category. Facilities without available data are excluded from the ranking.Click the rank badge to see the full State ranking.Click here to see the full State ranking.
A larger shared setting that may offer more common spaces and organized community services.
31 years in operation Rank #39 / 210Years in operation — State benchmarkedThis home is ranked 39th out of 210 homes in Maryland for Years In Operation. Shows how long this facility has been in operation compared to other Maryland facilities. Longer operating histories may benefit residents, families, and staff.Facilities with the same value for a metric share the same rank. Rankings are based only on facilities in Maryland that report data for that category. Facilities without available data are excluded from the ranking.Click the rank badge to see the full State ranking.Click here to see the full State ranking.
A longer operating history, which may indicate experience navigating regulations and delivering ongoing care.
Walk Score: 59 / 100 Rank #327 / 985Walk Score — State benchmarkedThis home is ranked 327th out of 985 homes in Maryland for Walk Score. Shows how walkable this facility's neighborhood is compared to the average Walk Score across Maryland facilities. Higher scores benefit residents, families, and staff.Facilities with the same value for a metric share the same rank. Rankings are based only on facilities in Maryland that report data for that category. Facilities without available data are excluded from the ranking.Click the rank badge to see the full State ranking.Click here to see the full State ranking.
Moderately walkable. Some errands can be accomplished on foot, with a mix of nearby amenities.
About this community
Facility TypeAssisted Living
CountyMontgomery
Apartment
$265 - $495 per day
Hospice Affiliations
Dedicated Alzheimer's Unit
Mild Alzheimer's Level
Moderate Alzheimer's Level
Severe Alzheimer's Level
Demographics
Resident demographic information for this facility.
Gender
- Female 68.9%
- Male 31.1%
Age Distribution
- 85-94 48.7%
- 95+ 24.3%
- 75-84 20.3%
- 65-74 6.8%
Ethnicity
- White 98.7%
- Asian 1.4%
What does this home offer?
Pets Allowed
Housing Options: 1 Bed / 2 Bed
Transportation Services
Fitness and Recreation
Living Spaces & Floor Plans for Landow House
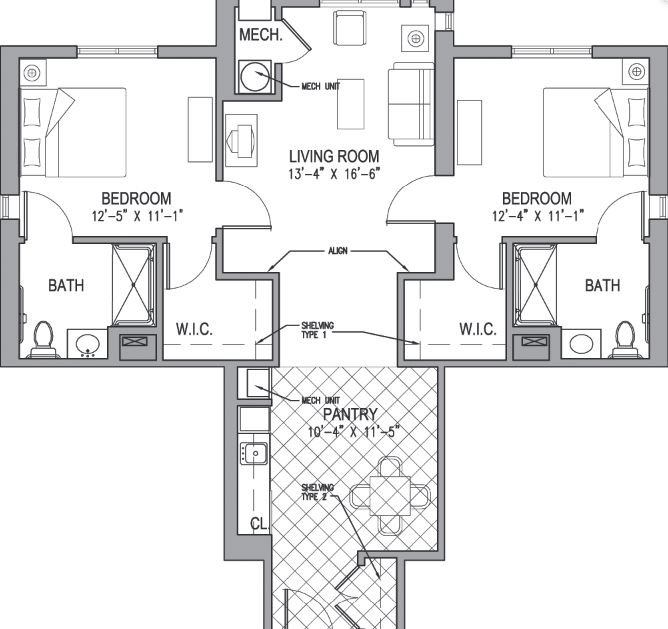
2 bedroom
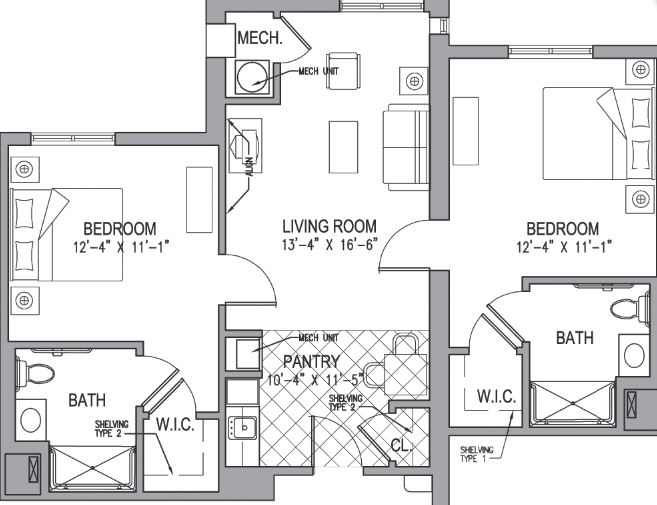
2 bedroom
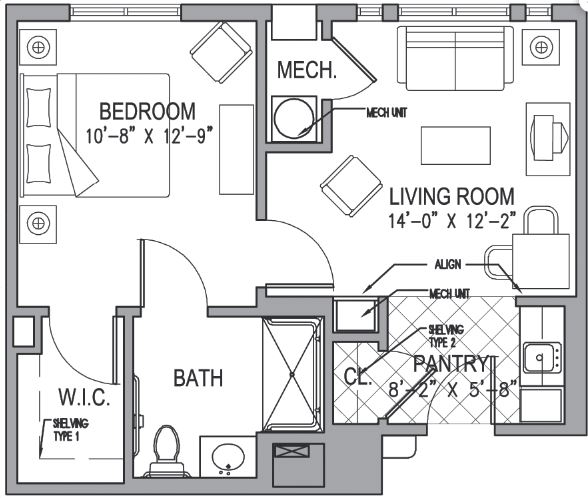
1 Bedroom
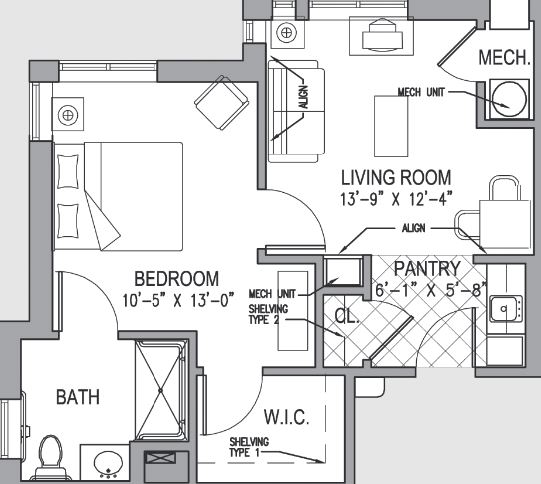
1 Bedroom
Places of interest near Landow House
![]() 2.3 miles from city center
2.3 miles from city center
![]() Estimated distance in miles from Rockville's city center to Landow House's address, calculated via Google Maps.
— 4.19 miles to nearest hospital (Suburban Hospital)
Estimated distance in miles from Rockville's city center to Landow House's address, calculated via Google Maps.
— 4.19 miles to nearest hospital (Suburban Hospital)
Calculate Travel Distance to Landow House
Add your location
Compare Nursing Homes around Rockville
The information below is reported by the Maryland Department of Health, Office of Health Care Quality.
| Ingleside at King Farm | NH AL IL MC SNF | Rockville (King Farm) | 45
Facility
45
MD AVG
43
Rank
#226 / 690 |
73.8%
Facility
73.8%
MD AVG
80.8
Rank
#82 / 104 | -9% | 6.36
Facility
6.36
MD AVG
3.77
Rank
#6 / 143 | +5% | +68% | $0
Facility
$0
MD AVG
$65.0k
Rank
#1 / 145 | 16
Facility
16
MD AVG
49.9
Rank
#7 / 145 | 8.0
Facility
8.0
MD AVG
12.8
Rank
#37 / 145 | - | 33 | - |
73
Facility
73
MD AVG
43
Rank
#152 / 985 | Westminster Ingleside King Farm Retirement Communities Inc | $44.3MFiscal year ending 12/2023
Facility
$44.3MFiscal year ending 12/2023
MD AVG
$18.7M
Rank
#7 / 144 | $14.8MFiscal year ending 12/2023
Facility
$14.8MFiscal year ending 12/2023
MD AVG
$6.5M
Rank
#22 / 144 | 33.4%Fiscal year ending 12/2023
Facility
33.4%Fiscal year ending 12/2023
MD AVG
38.5%
Rank
#139 / 144 | 215353 | ||||
| Tuckerman Rehabilitation & Healthcare Center | NH PC RC SNF | Rockville | 41
Facility
41
MD AVG
43
Rank
#231 / 690 |
90.7%
Facility
90.7%
MD AVG
80.8
Rank
#39 / 104 | +12% | 2.88
Facility
2.88
MD AVG
3.77
Rank
#135 / 143 | +43% | -24% | $0
Facility
$0
MD AVG
$65.0k
Rank
#1 / 145 | 23
Facility
23
MD AVG
49.9
Rank
#18 / 145 | 4.6
Facility
4.6
MD AVG
12.8
Rank
#6 / 145 | - | 37 | - |
39
Facility
39
MD AVG
43
Rank
#534 / 985 | Calanthia Green | $6.6M*Fiscal year ending 12/2022These figures are from this home's most recent complete cost report — an older period than most facilities report. Compare with that in mind.
Facility
$6.6M*Fiscal year ending 12/2022These figures are from this home's most recent complete cost report — an older period than most facilities report. Compare with that in mind.
MD AVG
$18.7M
Rank
#138 / 144 | $2.6M*Fiscal year ending 12/2022These figures are from this home's most recent complete cost report — an older period than most facilities report. Compare with that in mind.
Facility
$2.6M*Fiscal year ending 12/2022These figures are from this home's most recent complete cost report — an older period than most facilities report. Compare with that in mind.
MD AVG
$6.5M
Rank
#142 / 144 | 39.8%*Fiscal year ending 12/2022These figures are from this home's most recent complete cost report — an older period than most facilities report. Compare with that in mind.
Facility
39.8%*Fiscal year ending 12/2022These figures are from this home's most recent complete cost report — an older period than most facilities report. Compare with that in mind.
MD AVG
38.5%
Rank
#87 / 144 | 215320 | ||||
| Revitz House | NH AL HC IL MC SNF | Rockville | 558
Facility
558
MD AVG
43
Rank
#1 / 690 |
67.8%
Facility
67.8%
MD AVG
80.8
Rank
#87 / 104 | -16% | 3.91
Facility
3.91
MD AVG
3.77
Rank
#41 / 143 | -37% | +4% | $0
Facility
$0
MD AVG
$65.0k
Rank
#1 / 145 | 25
Facility
25
MD AVG
49.9
Rank
#22 / 145 | 8.3
Facility
8.3
MD AVG
12.8
Rank
#40 / 145 | - | 378 | - |
81
Facility
81
MD AVG
43
Rank
#86 / 985 | Alison Baraf | $57.8MFiscal year ending 12/2023
Facility
$57.8MFiscal year ending 12/2023
MD AVG
$18.7M
Rank
#4 / 144 | $42.1MFiscal year ending 12/2023
Facility
$42.1MFiscal year ending 12/2023
MD AVG
$6.5M
Rank
#4 / 144 | 72.9%Fiscal year ending 12/2023
Facility
72.9%Fiscal year ending 12/2023
MD AVG
38.5%
Rank
#38 / 144 | 215071 | ||||
| Autumn Lake Healthcare at Oak Manor | NH MC PC RC SNF | Burtonsville (Perrywood Estates) | 145
Facility
145
MD AVG
43
Rank
#46 / 690 |
90.6%
Facility
90.6%
MD AVG
80.8
Rank
#40 / 104 | +12% | 3.48
Facility
3.48
MD AVG
3.77
Rank
#69 / 143 | -48% | -8% | $11.4k
Facility
$11.4k
MD AVG
$65.0k
Rank
#97 / 145 | 36
Facility
36
MD AVG
49.9
Rank
#54 / 145 | 7.2
Facility
7.2
MD AVG
12.8
Rank
#24 / 145 | 1 | 131 | - |
18
Facility
18
MD AVG
43
Rank
#756 / 985 | 3415 Greencastle Road Holdco LLC | $19.0MFiscal year ending 12/2023
Facility
$19.0MFiscal year ending 12/2023
MD AVG
$18.7M
Rank
#63 / 144 | $3.2MFiscal year ending 12/2023
Facility
$3.2MFiscal year ending 12/2023
MD AVG
$6.5M
Rank
#40 / 144 | 16.6%Fiscal year ending 12/2023
Facility
16.6%Fiscal year ending 12/2023
MD AVG
38.5%
Rank
#27 / 144 | 215315 |
Financial Assistance for
Nursing Home in Maryland
Landow House is located in Rockville, Maryland.
Here are the financial assistance programs available to residents in Maryland.
Frequently Asked Questions about Landow House
What neighborhood is Landow House in?
Landow House is in the Rollins Park neighborhood of Rockville.
Is Landow House in a walkable area?
Landow House has a walk score of 59. Moderately walkable. Some errands can be accomplished on foot, with a mix of nearby amenities.
Are pets allowed at Landow House?
Yes, Landow House allows residents to bring their pets.
How many beds does Landow House have?
Landow House has 98 beds.
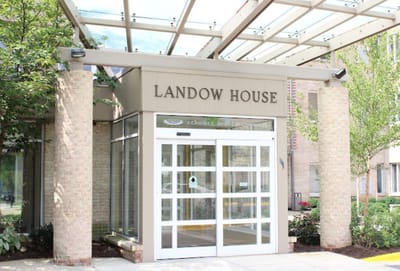
Are there photos of Landow House?
Yes — there are 5 photos of Landow House in the photo gallery on this page.
What is the address of Landow House?
Landow House is located at 1799 E Jefferson St, Rockville, MD 20852.
What is the phone number of Landow House?
(301) 816-5060 will put you in contact with the team at Landow House.
Guides for Better Senior Living
Care Cost Calculator: See Prices in Your Area
Nursing Home Data Explorer
Don’t Wait Too Long: 7 Red Flag Signs Your Parent Needs Assisted Living Now
The True Cost of Assisted Living in 2025 – And How Families Are Paying For It
Understanding Senior Living Costs: Pricing Models, Discounts & Financial Assistance
Updated on
