Laurelwood Assisted Living, LLC
Nursing Home, Assisted Living & Memory Care · Ohio, OH
CMS overall rating Info CMS (the Centers for Medicare & Medicaid Services) is the federal agency that rates nursing home quality. Its Overall Rating runs from 1 to 5 stars, combining health inspections, staffing, and quality measures, with inspections weighted most heavily.

Laurelwood Assisted Living, LLC

Nursing Home, Assisted Living & Memory Care · Ohio, OH
CMS overall rating Info CMS (the Centers for Medicare & Medicaid Services) is the federal agency that rates nursing home quality. Its Overall Rating runs from 1 to 5 stars, combining health inspections, staffing, and quality measures, with inspections weighted most heavily.
Calculator: See prices in your area
Laurelwood Assisted Living, LLC accepts Medicare and private pay.

Overview of Laurelwood Assisted Living, LLC

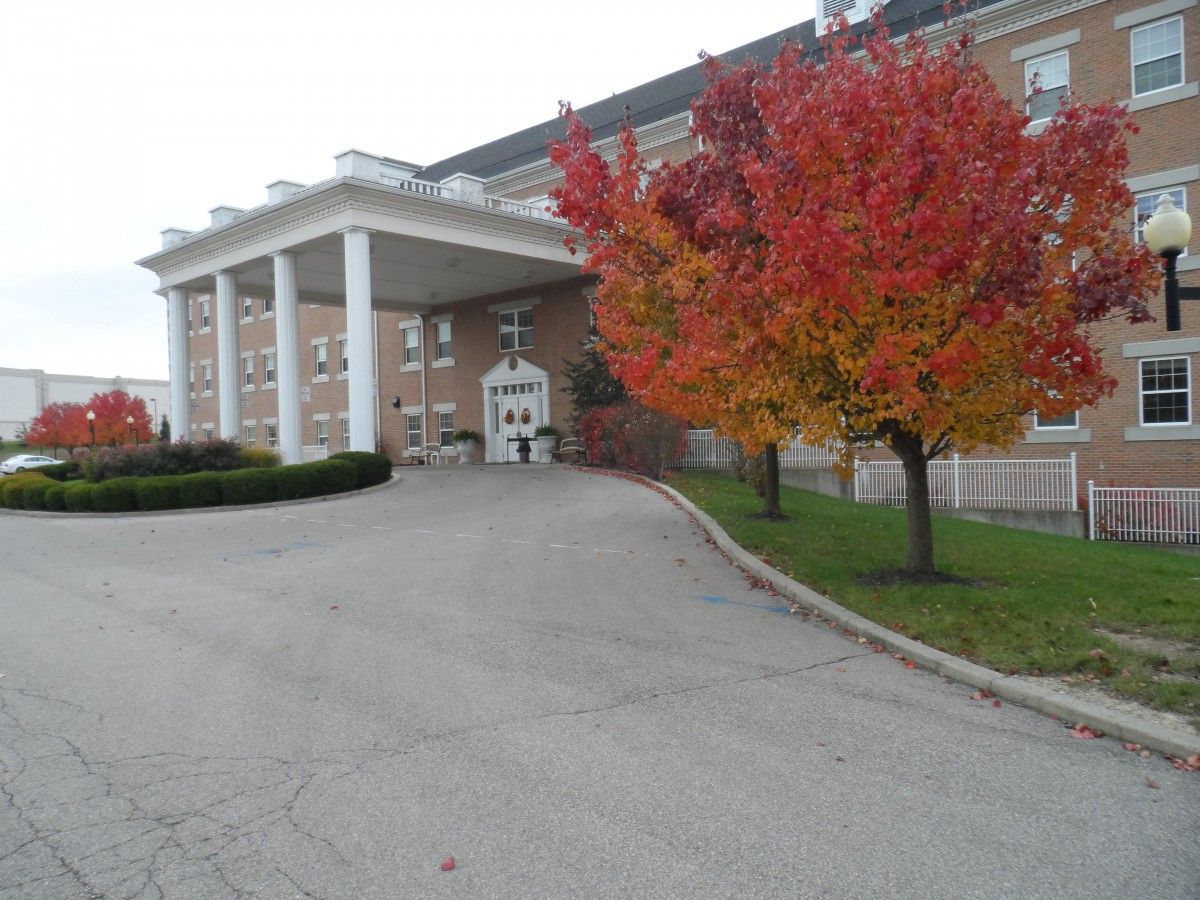
Set in the quiet neighborhood of Summit Glen Drive, Dayton, OH, Laurelwood Senior Living LLCis an astounding senior living community providing assisted living and memory care. Beautifully designed and spacious residences await seniors as they transition into the community. The community strives to deliver top-notch care and assistance that best fit seniors’ needs and preferences.

Meet people that share the same belief and experience wonderful moments through fun programs and stimulating activities. Committed to seniors’ well-being, the community conducts exercise classes for an active and well-connected lifestyle. Home-cooked meals foster comfort and satisfy dietary needs and tastes. Laurelwood Senior Living LLC ensures seniors are well-cared for with a kind and compassionate team providing help around the clock.

(937) 436-6155

Quality ratings

Measured by Centers for Medicare & Medicaid Services (CMS)

Overall rating Info The Overall CMS Rating combines results from health inspections, staffing levels and quality measures. Health inspections carry the most weight. Staffing and quality scores can increase or decrease the final rating based on performance compared to state and national standards.
▼ 5.7% Below OH avg. ▼ 5.7% Below OH avg.OH average: 3.2Click the badge to see the full State ranking.Click here to see the full State ranking.
Health Inspection Info Based on the results of the facility's three most recent standard inspections and any complaint investigations. CMS reviews the number, scope, and severity of deficiencies, with more recent findings weighted more heavily.
▲ 7.1% Above OH avg. ▲ 7.1% Above OH avg.OH average: 2.8Click the badge to see the full State ranking.Click here to see the full State ranking.
Staffing Info Measures average nursing staff hours per resident per day, including Registered Nurses (RNs) and total nursing staff. Ratings are adjusted based on the level of care residents require and are compared to state and national benchmarks.
▼ 59.1% Below OH avg. ▼ 59.1% Below OH avg.OH average: 2.4Click the badge to see the full State ranking.Click here to see the full State ranking.
Quality Measures Info Based on clinical and physical health indicators reported to CMS, such as hospital readmissions, falls, pressure ulcers, and improvements in mobility. These measures reflect how well residents' health needs are being managed.
▲ 14.7% Above OH avg. ▲ 14.7% Above OH avg.OH average: 4.4Click the badge to see the full State ranking.Click here to see the full State ranking.

Staffing hours breakdown

Info Daily nursing hours per resident by staff type, reported to CMS. Higher is generally better — compare this facility to state and national averages to see where staffing stands.

Hours per resident per day — compared to Ohio state averages

Total nursing care / resident Info This home is ranked 201st out of 210 homes in Ohio for nurse hours. Total adjusted nursing hours per resident per day, combining RN, LPN, and aide time. CMS adjusts this for case-mix so facilities can be fairly compared.
2h 42m per day
Rank #201 / 210Nurse hours — State benchmarkedThis home is ranked 201st out of 210 homes in Ohio. Shows adjusted nurse hours per resident per day benchmarked to the Ohio average, with a ranking across 210 Ohio facilities. More hours mean more direct care. The national average is about 3.5 hrs; below 3.0 is a red flag.Rankings are based only on facilities in Ohio that report data for that category. Facilities without available data are excluded from the ranking.Click the rank badge to see the full State ranking.Click here to see the full State ranking.
This facility Ohio avg (3h 32m per day)
vs Ohio avg
-24%

6 of 6 metrics below state avg

Staff typeHours / Day / Residentvs state avg
Registered Nurse (RN) Info RNs hold the highest nursing license and can assess residents, interpret test results, and direct care plans. More RN hours per day often signals stronger clinical oversight and faster response to health changes. 31m per day ▼ 20% State avg: 38m per day · National avg: 41m per day
LPN / LVN Info Licensed Practical Nurses (LPNs) or Licensed Vocational Nurses (LVNs) deliver routine hands-on care — medication administration, wound dressing, and monitoring vital signs. They work under RN supervision and make up a large share of daily bedside care. 43m per day ▼ 25% State avg: 58m per day · National avg: 52m per day
Nurse Aide Info Certified Nurse Aides (CNAs) provide the most direct day-to-day assistance: bathing, dressing, feeding, and mobility. Nurse aide hours are typically the largest staffing category and directly affect residents' quality of life. 2h 2m per day ▼ 4% State avg: 2h 7m per day · National avg: 2h 20m per day
Weekend Total Nursing Info Combined nursing hours (RN + LPN + Nurse Aide) per resident per day on weekends. Staffing often drops on weekends — this figure reveals whether the facility maintains adequate coverage outside of weekday hours. 2h 59m per day ▼ 11% State avg: 3h 20m per day · National avg: 3h 27m per day
Physical Therapist Info Hours per resident per day provided by licensed Physical Therapists (PTs) or PT Assistants. PT services help residents recover mobility after injury or illness and are especially important for post-acute (short-stay) rehabilitation. 1m per day ▼ 82% State avg: 3m per day · National avg: 4m per day
Weekend RN Info Registered nurse hours specifically on weekends. Facilities sometimes reduce RN presence on Saturdays and Sundays — a low weekend RN figure compared to weekday hours can indicate reduced clinical oversight when most administrative staff are absent. 21m per day ▼ 19% State avg: 25m per day · National avg: 29m per day

Capacity and availability

This home usually has availability

Lower occupancy than the Ohio average: 78.7%
Occupancy rate
69.2% Rank #167 / 211Occupancy rate — State benchmarkedThis home is ranked 167th out of 211 homes in Ohio. Shows this facility's occupancy rate versus the Ohio average, with its Statewide rank out of 211. Higher occupancy signals strong local demand and financial stability.Rankings are based only on facilities in Ohio that report data for that category. Facilities without available data are excluded from the ranking.Click the rank badge to see the full State ranking.Click here to see the full State ranking.
Avg. Length of Stay
236 days
Bed community size
148-bed community Rank #20 / 323Bed count — State benchmarkedThis home is ranked 20th out of 323 homes in Ohio. Shows this facility's certified or reported bed count compared to other Ohio facilities. Larger communities may offer more amenities, programs, and on-site services for residents and families.Rankings are based only on facilities in Ohio that report data for that category. Facilities without available data are excluded from the ranking.Click the rank badge to see the full State ranking.Click here to see the full State ranking.
A larger shared setting that may offer more common spaces and organized community services.
Years in operation
31 years in operation
A longer operating history, which may indicate experience navigating regulations and delivering ongoing care.
Walk Score
Walk Score: 52 / 100 Rank #229 / 705Walk Score — State benchmarkedThis home is ranked 229th out of 705 homes in Ohio. Shows how walkable this facility's neighborhood is compared to the average Walk Score across Ohio facilities. Higher scores benefit residents, families, and staff.Rankings are based only on facilities in Ohio that report data for that category. Facilities without available data are excluded from the ranking.Click the rank badge to see the full State ranking.Click here to see the full State ranking.
Moderately walkable. Some errands can be accomplished on foot, with a mix of nearby amenities.
BBB Rating
BBB Rating: A+ (Not Accredited)
An independent rating from the Better Business Bureau based on factors such as complaint history, transparency, and business practices.
How BBB ratings work

Staffing

Key information about the people who lead and staff this community.

Leadership

ContactMs. Christa Hinton, Administrator

Contact Laurelwood Assisted Living, LLC

Health Inspection History

Inspections since 2019
Total health inspections 10

State average 6.7


Last Health inspection on Mar 2025

Total health citations
30 Rank #111 / 210Health citations — State benchmarkedThis home is ranked 111th out of 210 homes in Ohio. Shows this facility's total health deficiency citations benchmarked to the Ohio State average, with a ranking across all 210 OH facilities. Lower citation counts earn a better rank.Rankings are based only on facilities in Ohio that report data for that category. Facilities without available data are excluded from the ranking.Click the rank badge to see the full State ranking.Click here to see the full State ranking.

State average 30.9

Citations per inspection
3 Rank #45 / 210Citations per inspection — State benchmarkedThis home is ranked 45th out of 210 homes in Ohio. Shows average deficiency citations per CMS inspection for this facility versus the Ohio mean across 210 facilities with citation data. Lower is better.Rankings are based only on facilities in Ohio that report data for that category. Facilities without available data are excluded from the ranking.Click the rank badge to see the full State ranking.Click here to see the full State ranking.

State average 4.59


Health citations are formal notices following inspections when they fail to comply with safety and care standards.

17 of 30 citations resulted from standard inspections; 10 of 30 resulted from complaint investigations; and 3 of 30 came from combined inspections (standard and complaint).

Breakdown of citation severity (last 7 years)
Critical health citations
0
100% better than State average

State average: 0.3


Serious health citations
1
11% worse than State average

State average: 0.9

0 critical citations State average: 0.3

1 serious citation State average: 0.9

29 moderate citations State average: 29

0 minor citations State average: 0.7
Citations history (last 7 years)
Abuse/Neglect moderate citation Mar 06, 2025
Corrected

Abuse/Neglect moderate citation Mar 06, 2025
Corrected

Care Planning moderate citation Mar 06, 2025
Corrected

Quality of Care moderate citation Sep 03, 2024
Corrected

Staffing Data

Reporting period: October 1 – December 31, 2025 (Q4 2025). Source: CMS Payroll-Based Journal report.

Total staff 198
Employees 185
Contractors 13
Staff to resident ratio 1.48 : 1
27% fewer staff per resident than Ohio average
Ohio average ratio: 2.04 : 1 Ohio average ratio: 2.04 : 1See full Ohio ranking
Avg staff/day 59
Average shift 8.5 hours
5% better than Ohio average
Ohio average: 8.1 hours Ohio average shift: 8.1 hoursSee full Ohio ranking
Total staff hours (quarter) 46,356

Nursing staff breakdown

Q4 2025 · Oct 1 – Dec 31 More info This data comes from the CMS Payroll-Based Journal report covering October 1 – December 31, 2025.
Registered Nurse

Manages medical care and health needs.

RN Staff Info All 11 RN Staff are full-time employees. No contractors work on this role. 11
Average shift length Info Average shift length. Calculated as total hours divided by days worked and average staff per day. 11.8 hours
Licensed Practical Nurse

Assists with medical care and medications.

LPN Staff Info All 26 LPN Staff are full-time employees. No contractors work on this role. 26
Average shift length Info Average shift length. Calculated as total hours divided by days worked and average staff per day. 8.9 hours
Certified Nursing Assistant

Helps with daily care and mobility.

CNA Staff Info All 116 CNA Staff are full-time employees. No contractors work on this role. 116
Average shift length Info Average shift length. Calculated as total hours divided by days worked and average staff per day. 8.7 hours

Contractor staffing

Q4 2025 · Oct 1 – Dec 31 More info This data comes from the CMS Payroll-Based Journal report covering October 1 – December 31, 2025.

Total hours from contractors

4.1%

1,912 contractor hours this quarter

Respiratory Therapy Technician: 3 Physical Therapy Aide: 3 Physical Therapy Assistant: 3 Qualified Social Worker: 2 Speech Language Pathologist: 1 Medical Director: 1

Staff by category

Q4 2025 · Oct 1 – Dec 31 More info This data comes from the CMS Payroll-Based Journal report covering October 1 – December 31, 2025.
Certified Nursing Assistant116011624,11792100%8.7
Licensed Practical Nurse260268,89292100%8.9
Registered Nurse110114,24992100%11.8
Other Dietary Services Staff120122,17892100%7.6
Nurse Practitioner3031,3776470%8
Medication Aide/Technician2029177784%11.4
Clinical Nurse Specialist7076586773%4.6
Mental Health Service Worker1015126470%8
Dental Services Staff1014936166%8.1
Physical Therapy Aide0334936368%7.4
Speech Language Pathologist0114666470%7.3
Dietitian1014325459%8
Qualified Social Worker0224086368%6.5
Physical Therapy Assistant0333815762%6.7
Occupational Therapy Aide2023354246%7.4
Administrator1012162729%8
Respiratory Therapy Technician0331173841%3
Occupational Therapy Assistant101603639%1.7
Medical Director011471617%3
Diagnostic X-ray Services Staff1011022%5
116 Certified Nursing Assistant
% of Days 100%
26 Licensed Practical Nurse
% of Days 100%
11 Registered Nurse
% of Days 100%
12 Other Dietary Services Staff
% of Days 100%
3 Nurse Practitioner
% of Days 70%
2 Medication Aide/Technician
% of Days 84%
7 Clinical Nurse Specialist
% of Days 73%
1 Mental Health Service Worker
% of Days 70%
1 Dental Services Staff
% of Days 66%
3 Physical Therapy Aide
% of Days 68%
1 Speech Language Pathologist
% of Days 70%
1 Dietitian
% of Days 59%
2 Qualified Social Worker
% of Days 68%
3 Physical Therapy Assistant
% of Days 62%
2 Occupational Therapy Aide
% of Days 46%
1 Administrator
% of Days 29%
3 Respiratory Therapy Technician
% of Days 41%
1 Occupational Therapy Assistant
% of Days 39%
1 Medical Director
% of Days 17%
1 Diagnostic X-ray Services Staff
% of Days 2%

Penalties and fines

Federal penalties imposed by CMS for regulatory violations, including civil money penalties (fines) and denials of payment for new Medicare/Medicaid admissions.

Source: CMS Penalties Database

No penalties in the past 3 years

No civil money penalties or payment denials were reported in the last 3 years.

Quality of care over time

These measures show how residents usually do over time at this home, based on health outcomes and preventive care.

High-risk clinical events score Info A composite score based on pressure ulcers, falls with injury, weight loss, walking ability decline, and activities of daily living decline. 2.5
57% better than Ohio average

Ohio average: 5.8

Functional decline score Info A composite score based on activities of daily living decline, walking ability decline, and incontinence. 9.9
22% better than Ohio average

Ohio average: 12.7

Long-stay resident measures
Need for Help with Daily Activities Increased Info Percent of long-stay residents whose need for help with daily activities has increased 0.7%
90% better than Ohio average

Ohio average: 6.8%

Walking Ability Worsened Info Percent of long-stay residents whose ability to move independently worsened 0.3%
97% better than Ohio average

Ohio average: 8.9%

Low Risk Residents with Bowel/Bladder Incontinence Info Percent of low risk long-stay residents who lose control of their bowels or bladder 28.8%
31% worse than Ohio average

Ohio average: 22.0%

Falls with Major Injury Info Percent of long-stay residents experiencing one or more falls with major injury 5.8%
68% worse than Ohio average

Ohio average: 3.4%

High Risk Residents with Pressure Ulcers Info Percent of long-stay high risk residents with pressure ulcers 1.2%
68% better than Ohio average

Ohio average: 3.9%

Urinary Tract Infection Info Percent of long-stay residents with a urinary tract infection 0.0%
100% better than Ohio average

Ohio average: 0.5%

Lost Too Much Weight Info Percent of long-stay residents who lose too much weight 4.6%
26% better than Ohio average

Ohio average: 6.2%

Depressive Symptoms Info Percent of long-stay residents who have depressive symptoms 99.8%
315% worse than Ohio average

Ohio average: 24.0%

Antipsychotic Use Info Percent of long-stay residents who received an antipsychotic medication 22.3%
165% worse than Ohio average

Ohio average: 8.4%

Pneumococcal Vaccine Info Percent of long-stay residents assessed and appropriately given the pneumococcal vaccine 96.9%
5% better than Ohio average

Ohio average: 92.4%

Influenza Vaccine Info Percent of long-stay residents assessed and appropriately given the seasonal influenza vaccine 98.7%
In line with Ohio average

Ohio average: 94.5%

Short-stay resident measures
Pneumococcal Vaccine Info Percent of short-stay residents assessed and appropriately given the pneumococcal vaccine 91.6%
17% better than Ohio average

Ohio average: 78.0%

Antipsychotic medication increase Info Percent of short-stay residents who newly received an antipsychotic medication 0.0%
100% better than Ohio average

Ohio average: 1.3%

Influenza Vaccine Info Percent of short-stay residents assessed and appropriately given the seasonal influenza vaccine 97.9%
30% better than Ohio average

Ohio average: 75.6%

Breakdown by payment type

Medicare

10% of new residents, usually for short-term rehab.

Typical stay 1 - 2 months

Private pay

90% of new residents, often for short stays.

Typical stay 2 months

Facility Characteristics

Source: CMS Long-Term Care Facility Characteristics (Data as of Jan 2026)

Total residents 134
Medicare
5
3.7% of residents
Medicaid
77
57.5% of residents
Private pay or other
52
38.8% of residents
Programs & Services
Residents Group

Residents meet regularly to discuss policies, care quality, and activities

Active Resident Council

Organized group of residents that meets regularly to discuss facility policies, quality of life, and activities.

Finances and operations

Based on CMS SNF Cost Report for fiscal year ending in 02/2024.

Voluntary non-profit community
Operated by a church.
Net patient revenue Info Net patient revenue — what the home actually collects for resident care, after contractual allowances, bad debt and discounts are subtracted from its gross charges (CMS cost report, Worksheet G-3). It covers resident care only; money the home earns from other sources is shown separately as "Other income."
$11.6M
Net patient income Info Net patient income: net patient revenue minus the home's total operating expenses. A positive figure means it earns more from resident care than it spends to deliver it; a negative figure means the opposite. It excludes non-operating "other income."
-$507.1K
Voluntary non-profit community Operated by a church.
Net patient revenue Info Net patient revenue — what the home actually collects for resident care, after contractual allowances, bad debt and discounts are subtracted from its gross charges (CMS cost report, Worksheet G-3). It covers resident care only; money the home earns from other sources is shown separately as "Other income."
$11.6M Rank #59 / 210Revenue — State benchmarkedThis home is ranked 59th out of 210 homes in Ohio. Shows this facility's annual revenue compared to the Ohio average. Higher revenue generally means more resources for staffing and capital — read alongside Payroll %.Rankings are based only on facilities in Ohio that report data for that category. Facilities without available data are excluded from the ranking.Click the rank badge to see the full State ranking.Click here to see the full State ranking.
Net patient income Info Net patient income: net patient revenue minus the home's total operating expenses. A positive figure means it earns more from resident care than it spends to deliver it; a negative figure means the opposite. It excludes non-operating "other income."
-$507.1K
Other income Info Money the home earns outside of resident care — such as investments, grants, rentals and other non-operating sources (CMS cost report, Worksheet G-3). It is tracked separately from net patient revenue: it is not part of that figure, and it is not included in net patient income.
$605
Payroll costs Info Staff salaries plus wage-related costs — benefits such as payroll taxes, health insurance and retirement — from the home's own accounting records (CMS cost report, Worksheet A). Contract or agency labor is counted separately, under other operating costs. Rank #69 / 210Payroll — State benchmarkedThis home is ranked 69th out of 210 homes in Ohio. Shows total annual staff payroll benchmarked to the Ohio average. Higher payroll investment relative to peers often signals better staffing and less reliance on cheaper contract labor.Rankings are based only on facilities in Ohio that report data for that category. Facilities without available data are excluded from the ranking.Click the rank badge to see the full State ranking.Click here to see the full State ranking.
$5.8M 50.4% of net patient revenue Info Payroll as a share of revenue: staff salaries and wage-related benefits divided by net patient revenue. A higher figure means more of each revenue dollar goes to staff pay. Rank #160 / 210Payroll % — State benchmarkedThis home is ranked 160th out of 210 homes in Ohio. Shows payroll as a percentage of revenue versus the Ohio average. Well-run Ohio facilities typically land around 54–64% — the top third Statewide. Below 25% may signal understaffing or heavy agency use — read with Staffing ratings.Rankings are based only on facilities in Ohio that report data for that category. Facilities without available data are excluded from the ranking.Click the rank badge to see the full State ranking.Click here to see the full State ranking.
Other operating costs Info Everything it costs to run the home apart from payroll — food, utilities, supplies, maintenance, contract labor and administration. Calculated as total operating expense minus payroll (staff salaries and wage-related benefits).
$6.2M
Total costs Info The home's total operating expense for the year — all the costs of running it, salaries included (CMS cost report, Worksheet G-3).
$12.1M

What does this home offer?

Building type icon
Building type icon

Building Type: 3-story

Fitness and recreation icon

Fitness and Recreation

Who this home usually serves

TYPE OF STAY

Primarily short stays

Residents typically stay for brief periods, with frequent admissions and discharges throughout the year.

Most new residents arrive under private pay (90% of admissions), and a typical private pay stay runs around 2 months.

Admissions
179 total

Coverage residents most often arrive under.

Medicare 10%
Private pay 90%
Discharges
159 total

Coverage residents most often leave under.

Medicare 8%
Private pay 92%

Places of interest near Laurelwood Assisted Living, LLC

Address 15.3 miles from city center Info Estimated distance in miles from Dayton's city center to Laurelwood Assisted Living, LLC's address, calculated via Google Maps.

Calculate Travel Distance to Laurelwood Assisted Living, LLC

Add your location

Address

Financial Assistance for
Assisted Living in Ohio

Laurelwood Assisted Living, LLC is located in Dayton, Ohio.
Here are the financial assistance programs available to residents in Ohio.

Get Financial aid guidance

PASSPORT Waiver

Ohio Medicaid PASSPORT

Age 60+
General Ohio resident, Medicaid-eligible, nursing home-level care need.
Income Limits (2025) ~$2,829/month 300% FBR, individual
Asset Limits $2,000 (individual), $3,000 (couple).
OH

Administered through regional agencies; waitlists possible.

Benefits
Personal care (5-7 hours/day) Respite (240 hours/year) Adult day care ($65/day) Home modifications ($1,500 avg.)

Ohio Home Care Program (non-Medicaid)

OH HCP

Age 60+
General Ohio resident, at risk of decline.
Income Limits ~$2,000/month individual, varies
Asset Limits $5,000 individual
OH

Limited funding; regional variation.

Benefits
In-home care (3-5 hours/week) Respite (up to 10 days/year) Transportation (~5 trips/month)

Assisted Living Waiver (ALW)

Ohio Assisted Living Waiver

Age 21+ (65+ prioritized)
General OH resident, Medicaid-eligible, NFLOC.
Income Limits (2025) ~$2,829/month (individual); QIT required.
Asset Limits $2,000 (individual), $3,000 (couple).
OH

Covers ~300 facilities; room/board not included (separate cost).

Benefits
Personal care Meals Medication management Transportation (~$3,000-$4,000/month value)

Program of All-Inclusive Care for the Elderly (PACE)

Ohio PACE (e.g., McGregor PACE)

Age 55+
General OH resident (specific counties), NFLOC, safe with PACE support.
Income Limits (2025) ~$2,829/month (Medicaid-eligible); private pay option available.
Asset Limits $2,000 (individual), $3,000 (couple) for Medicaid enrollees.
OH

Available in 9 counties (e.g., Cuyahoga, Franklin); expanding via Healthy Aging Grants.

Benefits
Personal care (5-7 hours/day) Medical care Meals Transportation Respite Therapies

Medicare Savings Program (MSP)

Ohio Medicare Savings Program

Age 65+ or disabled
General OH resident, Medicare Part A/B.
Income Limits (2025) ~$2,510/month (QMB), ~$3,380/month (SLMB), ~$3,598/month (QI)—individual.
Asset Limits $9,430 (individual), $14,130 (couple).
OH

Three tiers; includes Extra Help for Part D; no waitlist.

Benefits
Covers Part B premiums ($174.70/month) Deductibles ($240/year) Copays (~20%)

Home Energy Assistance Program (HEAP)

Ohio HEAP

Age 60+ prioritized
General OH resident, low-income household.
Income Limits (2025) ~$3,970/month individual, 185% FPL
Asset Limits Not assessed; income-focused.
OH

Covers gas, electric, oil; emergency aid via Winter/Summer Crisis Programs.

Benefits
Heating/cooling aid ($300-$1,000/season) Emergency aid ($500 max)

Family Caregiver Support Program (FCSP)

Ohio Family Caregiver Support Program

Age
General Caregivers of 60+ needing care or 55+ caregivers of others; OH resident; functional needs (2+ ADLs).
Income Limits (2025) Prioritizes ~$24,980/year (individual); no strict cap.
Asset Limits Not assessed; need-based.
OH

12 AAAs; rural/low-income priority; volunteer respite option.

Benefits
Respite (4-6 hours/week or 5 days/year) Adult day care ($60/day) Training Supplies (~$500/year)

VA Aid and Attendance (A&A) and Housebound Benefits

Ohio VA Aid and Attendance/Housebound

Age 65+ or disabled veteran/spouse
General OH resident, wartime service, need for ADL help (A&A) or homebound.
Income Limits (2025) Net income < ~$1,984/month (veteran with dependent, A&A); pension offsets income.
Asset Limits ~$155,356 net worth limit
OH

High veteran demand; supports care in multiple settings.

Benefits
Cash (~$1,433-$2,642/month veteran, ~$951-$1,318 spouse) for care costs (e.g., in-home, assisted living)

Homestead Exemption

Ohio Homestead Exemption

Age 65+ (or disabled)
General OH resident, homeowner, low-income.
Income Limits (2025) ~$38,500/year individual, adjusted annually
Asset Limits Not assessed; home ownership required.
OH

Reduces taxable value by $25,000; applies to primary residence.

Benefits
Tax reduction (~$400-$800/year avg., varies by county)

Save the Dream Ohio (Homeowner Assistance Fund)

Ohio Save the Dream

Age 60+ prioritized
General OH resident, homeowner, hardship post-Jan 21, 2020.
Income Limits (2025) ~$147,600/year family of 4, 150% AMI; varies by county
Asset Limits Not assessed; hardship-focused.
OH

Covers delinquent mortgages, utilities, taxes; max $25,000 mortgage aid.

Benefits
Mortgage aid ($25,000 max) Utility/property tax aid ($5,000 avg.)

Frequently Asked Questions about Laurelwood Assisted Living, LLC

What neighborhood is Laurelwood Assisted Living, LLC in?

Laurelwood Assisted Living, LLC is in the West Carrollton City neighborhood of Dayton.

Is Laurelwood Assisted Living, LLC in a walkable area?

Laurelwood Assisted Living, LLC has a walk score of 52. Moderately walkable. Some errands can be accomplished on foot, with a mix of nearby amenities.

What is the occupancy rate at Laurelwood Assisted Living, LLC?

Laurelwood Assisted Living, LLC's occupancy is 69.2%.

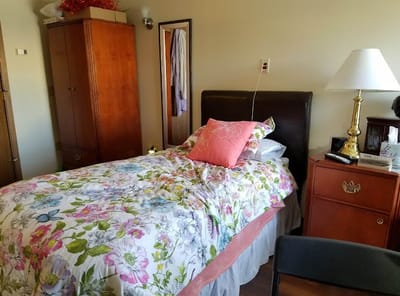
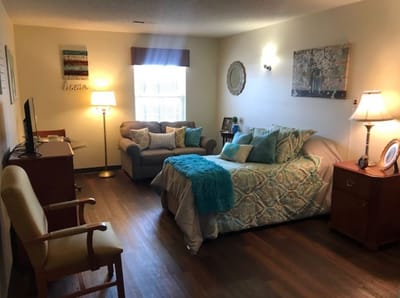
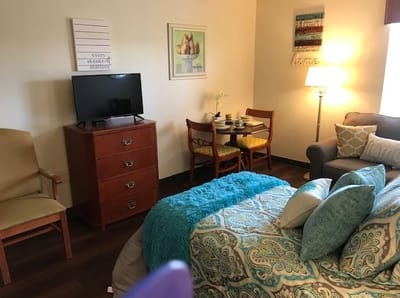
Are there photos of Laurelwood Assisted Living, LLC?

Yes — there are 4 photos of Laurelwood Assisted Living, LLC in the photo gallery on this page.

What is the address of Laurelwood Assisted Living, LLC?

Laurelwood Assisted Living, LLC is located at 3797 Summit Glen Dr, Dayton, OH 45449.

What is the phone number of Laurelwood Assisted Living, LLC?

(937) 436-6155 will put you in contact with the team at Laurelwood Assisted Living, LLC.

Is Laurelwood Assisted Living, LLC Medicare or Medicaid certified?

Yes — Laurelwood Assisted Living, LLC is a CMS-certified provider of Medicare and Medicaid.

Guides for Better Senior Living

Care Cost Calculator: See Prices in Your Area

Nursing Home Data Explorer

Don’t Wait Too Long: 7 Red Flag Signs Your Parent Needs Assisted Living Now

The True Cost of Assisted Living in 2025 – And How Families Are Paying For It

Understanding Senior Living Costs: Pricing Models, Discounts & Financial Assistance