Lexington Medical Center Extended Care
Nursing Home · South Carolina, SC
CMS overall rating Info The Overall CMS Rating is scored from 1 to 5 stars and combines results from health inspections, staffing levels, and quality measures. Health inspections carry the most weight. Staffing and quality scores can increase or decrease the final rating based on performance compared to state and national standards.

Lexington Medical Center Extended Care

Nursing Home · South Carolina, SC
CMS overall rating Info The Overall CMS Rating is scored from 1 to 5 stars and combines results from health inspections, staffing levels, and quality measures. Health inspections carry the most weight. Staffing and quality scores can increase or decrease the final rating based on performance compared to state and national standards.
Calculator: See prices in your area
Lexington Medical Center Extended Care accepts Medicare, Medicaid, and private pay.

Overview of Lexington Medical Center Extended Care

Lexington Medical Center Extended Care provides extended care for recovery in a comfortable environment. The facility offers long-term care and rehabilitation services. Visitors are welcome at any time without an appointment.

(803) 359-5181

Quality ratings

Measured by Centers for Medicare & Medicaid Services (CMS)

Overall rating Info The Overall CMS Rating combines results from health inspections, staffing levels and quality measures. Health inspections carry the most weight. Staffing and quality scores can increase or decrease the final rating based on performance compared to state and national standards.
▼ 65.9% Below SC avg. ▼ 65.9% Below SC avg.Click the badge to see the full State ranking.Click here to see the full State ranking.
Health Inspection Info Based on the results of the facility's three most recent standard inspections and any complaint investigations. CMS reviews the number, scope, and severity of deficiencies, with more recent findings weighted more heavily.
▼ 63.6% Below SC avg. ▼ 63.6% Below SC avg.Click the badge to see the full State ranking.Click here to see the full State ranking.
Staffing Info Measures average nursing staff hours per resident per day, including Registered Nurses (RNs) and total nursing staff. Ratings are adjusted based on the level of care residents require and are compared to state and national benchmarks.
▲ 35.6% Above SC avg. ▲ 35.6% Above SC avg.Click the badge to see the full State ranking.Click here to see the full State ranking.
Quality Measures Info Based on clinical and physical health indicators reported to CMS, such as hospital readmissions, falls, pressure ulcers, and improvements in mobility. These measures reflect how well residents' health needs are being managed.
▼ 42.7% Below SC avg. ▼ 42.7% Below SC avg.Click the badge to see the full State ranking.Click here to see the full State ranking.

Staffing hours breakdown

Info Daily nursing hours per resident by staff type, reported to CMS. Higher is generally better — compare this facility to state and national averages to see where staffing stands.

Hours per resident per day — compared to South Carolina state averages

Total nursing care / resident Info This home is ranked 26th out of 112 homes in South Carolina. Total adjusted nursing hours per resident per day, combining RN, LPN, and aide time. CMS adjusts this for case-mix so facilities can be fairly compared.
4h 27m per day
Rank #26 / 112Nurse hours — State benchmarkedThis home is ranked 26th out of 112 homes in South Carolina. Shows adjusted nurse hours per resident per day benchmarked to the South Carolina average, with a ranking across 112 South Carolina SNFs. More hours mean more direct care. The national average is about 3.5 hrs; below 3.0 is a red flag.Click the rank badge to see the full State ranking.Click here to see the full State ranking.
This facility South Carolina avg (4h 5m per day)
vs South Carolina avg
+9%
Staff typeHours / Day / Residentvs state avg
Weekend Total Nursing Info Combined nursing hours (RN + LPN + Nurse Aide) per resident per day on weekends. Staffing often drops on weekends — this figure reveals whether the facility maintains adequate coverage outside of weekday hours. 3h 44m per day

Capacity and availability

This home usually has availability

Occupancy lower than 85% suggests more openings may be available.

Similar occupancy to the South Carolina average: 82.1%
Occupancy rate 81.7% Rank #77 / 121Occupancy rate — State benchmarkedThis home is ranked 77th out of 121 homes in South Carolina. Shows this facility's occupancy rate versus the South Carolina average, with its Statewide rank out of 121. Higher occupancy signals strong local demand and financial stability.Click the rank badge to see the full State ranking.Click here to see the full State ranking.
Avg. Length of Stay 152 days
Occupancy rate
81.7% Rank #77 / 121Occupancy rate — State benchmarkedThis home is ranked 77th out of 121 homes in South Carolina. Shows this facility's occupancy rate versus the South Carolina average, with its Statewide rank out of 121. Higher occupancy signals strong local demand and financial stability.Click the rank badge to see the full State ranking.Click here to see the full State ranking.
Avg. Length of Stay
152 days
Bed community size
388-bed community Rank #1 / 312Bed count — State benchmarkedThis home is ranked 1st out of 312 homes in South Carolina. Shows this facility's certified or reported bed count compared to other South Carolina SNFs. Larger communities may offer more amenities, programs, and on-site services for residents and families.Click the rank badge to see the full State ranking.Click here to see the full State ranking.
A large-scale community that may provide a wide range of amenities, services, and structured programs.

About this community

License Details

Facility TypeNursing Homes
StatusActive
License NumberNCF-0730
CMS Certification Number425321

Ownership & Operating Entity

Lexington Medical Center Extended Care is administrated by Kathryn Gill.

Owner NameLexmed Inc

Therapy & Rehabilitation

1 service
Rehabilitation Services

Contact Information

Amenities & Lifestyle

Specific ProgramsJobs

Contact Lexington Medical Center Extended Care

Health Inspection History

Inspections since 2022
Total health inspections 7

South Carolina average 3.9


Last Health inspection on Jul 2025
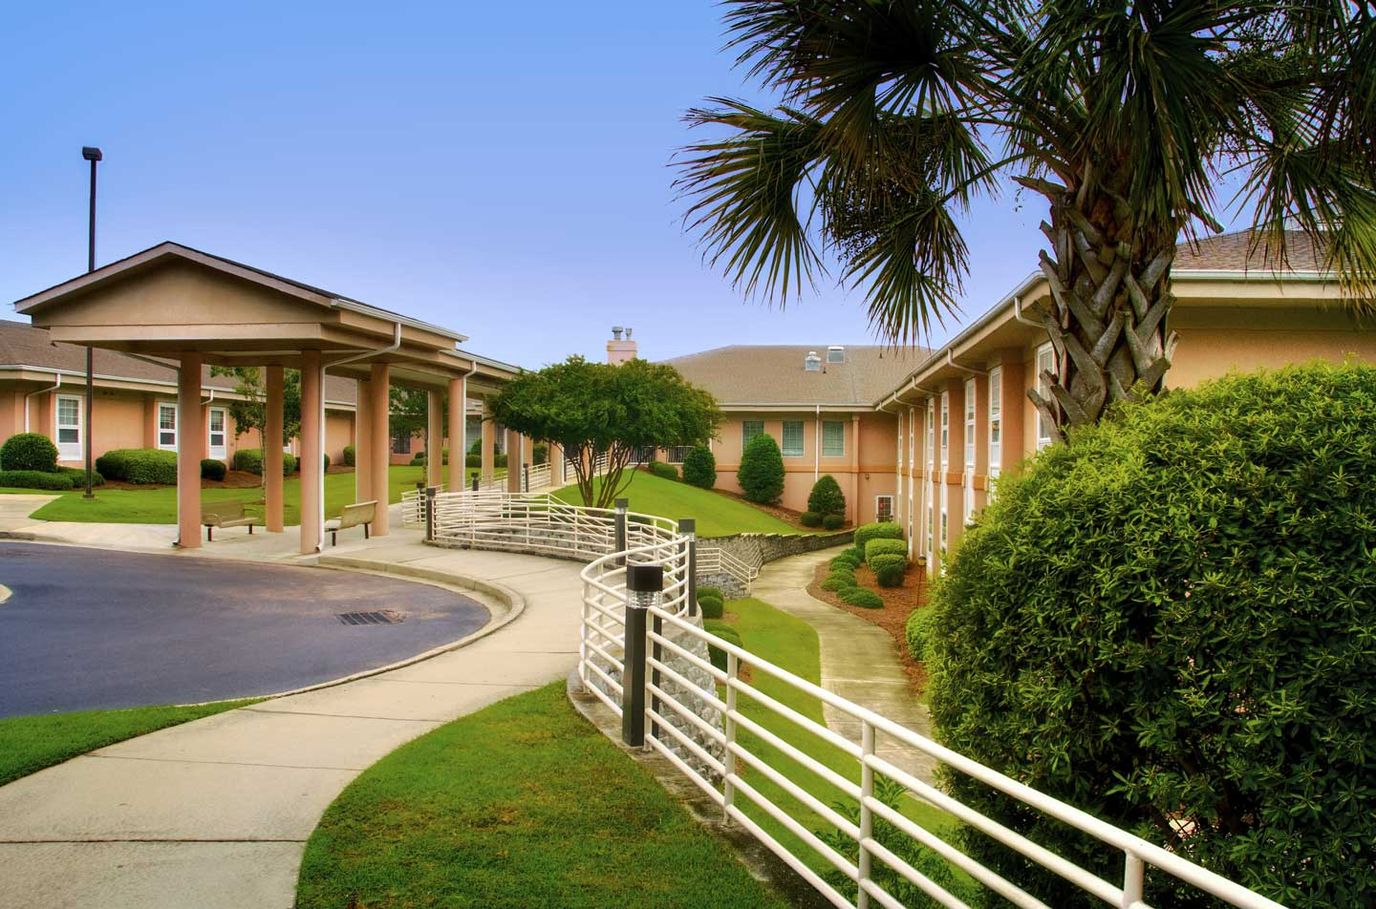
Total health citations
16 Rank #79 / 113Health citations — State benchmarkedThis home is ranked 79th out of 113 homes in South Carolina. Shows this facility's total health deficiency citations benchmarked to the South Carolina State average, with a ranking across all 113 SC SNFs. Lower citation counts earn a better rank.Click the rank badge to see the full State ranking.Click here to see the full State ranking.

South Carolina average 13.7

Citations per inspection
2.29 Rank #27 / 113Citations per inspection — State benchmarkedThis home is ranked 27th out of 113 homes in South Carolina. Shows average deficiency citations per CMS inspection for this facility versus the South Carolina mean across 113 SNFs with citation data. Lower is better.Click the rank badge to see the full State ranking.Click here to see the full State ranking.

South Carolina average 3.44


Health citations are formal notices following inspections when they fail to comply with safety and care standards.

10 of 16 citations resulted from standard inspections; and 6 of 16 resulted from complaint investigations.

Breakdown of citation severity (last 4 years)
Critical Health citations
3
200% worse than South Carolina average

South Carolina average: 1


Serious Health citations
0
100% better than South Carolina average

South Carolina average: 0.3

3 critical citations South Carolina average: 1

0 serious citations South Carolina average: 0.3

13 moderate citations South Carolina average: 12.3

0 minor citations South Carolina average: 0.1
Citations history (last 4 years)
Abuse/Neglect moderate citation Jul 25, 2025
Corrected

Abuse/Neglect moderate citation Jul 25, 2025
Corrected

Infection Control moderate citation Jul 25, 2025
Corrected

Care Planning moderate citation Jul 25, 2025
Corrected

Staffing Data

Reporting period: October 1 – December 31, 2025 (Q4 2025). Source: CMS Payroll-Based Journal report.

Total staff 388
Employees 385
Contractors 3
Staff to resident ratio 1.46:1
20% worse than South Carolina average
South Carolina average ratio: 1.84:1 South Carolina average ratio: 1.84:1See full South Carolina ranking
Avg staff/day 164
Average shift 8.6 hours
9% better than South Carolina average
South Carolina average: 7.9 hours South Carolina average shift: 7.9 hoursSee full South Carolina ranking
Total staff hours (quarter) 130,225

Nursing staff breakdown

Q4 2025 · Oct 1 – Dec 31 More info This data comes from the CMS Payroll-Based Journal report covering October 1 – December 31, 2025.
Registered Nurse

Manages medical care and health needs.

RN Staff 33
Average shift length Info Average shift length. Calculated as total hours divided by days worked and average staff per day. 8.1 hours

No contractors work on this role.

Licensed Practical Nurse

Assists with medical care and medications.

LPN Staff 101
Average shift length Info Average shift length. Calculated as total hours divided by days worked and average staff per day. 9.1 hours

No contractors work on this role.

Certified Nursing Assistant

Helps with daily care and mobility.

CNA Staff 171
Average shift length Info Average shift length. Calculated as total hours divided by days worked and average staff per day. 8.8 hours

No contractors work on this role.

Contractor staffing

Q4 2025 · Oct 1 – Dec 31 More info This data comes from the CMS Payroll-Based Journal report covering October 1 – December 31, 2025.

Total hours from contractors

0.2%

275 contractor hours this quarter

Occupational Therapy Assistant: 2 Medical Director: 1

Staff by category

Q4 2025 · Oct 1 – Dec 31 More info This data comes from the CMS Payroll-Based Journal report covering October 1 – December 31, 2025.
Certified Nursing Assistant171017162,58392100%8.8
Licensed Practical Nurse101010133,41492100%9.1
Registered Nurse330339,44892100%8.1
Clinical Nurse Specialist110114,6907076%8.3
Dietitian100104,4998693%7.5
Speech Language Pathologist100102,5197784%7.5
Mental Health Service Worker6062,2996672%8.4
Physical Therapy Aide7071,7207582%7.5
Occupational Therapy Aide3031,3376975%8
Respiratory Therapy Technician5051,3067177%7.2
Qualified Social Worker8081,1537278%5.5
Qualified Activities Professional8081,14592100%11.2
Physical Therapy Assistant6061,1007784%7.8
RN Director of Nursing2029546368%8
Other Dietary Services Staff2028248188%6.4
Nurse Practitioner1015206571%8
Administrator1014405560%8
Occupational Therapy Assistant0222723942%6.1
Medical Director011333%1
171 Certified Nursing Assistant
% of Days 100%
101 Licensed Practical Nurse
% of Days 100%
33 Registered Nurse
% of Days 100%
11 Clinical Nurse Specialist
% of Days 76%
10 Dietitian
% of Days 93%
10 Speech Language Pathologist
% of Days 84%
6 Mental Health Service Worker
% of Days 72%
7 Physical Therapy Aide
% of Days 82%
3 Occupational Therapy Aide
% of Days 75%
5 Respiratory Therapy Technician
% of Days 77%
8 Qualified Social Worker
% of Days 78%
8 Qualified Activities Professional
% of Days 100%
6 Physical Therapy Assistant
% of Days 84%
2 RN Director of Nursing
% of Days 68%
2 Other Dietary Services Staff
% of Days 88%
1 Nurse Practitioner
% of Days 71%
1 Administrator
% of Days 60%
2 Occupational Therapy Assistant
% of Days 42%
1 Medical Director
% of Days 3%

Penalties and fines

Includes penalties issued in 2023-2024

Federal penalties imposed by CMS for regulatory violations, including civil money penalties (fines) and denials of payment for new Medicare/Medicaid admissions.

Source: CMS Penalties Database (Data as of Jan 2026)

Total fines amount $52K Rank #104 / 114Federal fines — State benchmarkedThis home is ranked 104th out of 114 homes in South Carolina. Shows this facility's cumulative CMS federal fine dollars versus the South Carolina average among facilities with fines, and where it ranks among 114 skilled nursing facilities in the pool. Lower total dollars mean a better rank.Click the rank badge to see the full State ranking.Click here to see the full State ranking.
54% higher than South Carolina average

South Carolina average: $34K

Number of fines 4
64% more fines than South Carolina average

South Carolina average: 2.4

Payment Denials Info Serious action where Medicare and/or Medicaid temporarily stops payments for new residents until issues are fixed. 0
100% fewer payment denials than South Carolina average

South Carolina average: 0.1

Fines amount comparison
This facility $52K
South Carolina average $34K
Penalty History

Penalties are imposed by CMS for violations of federal nursing home regulations.

2 penalties in the past 3 years

Multiple penalties were reported in the last 3 years.

Civil Money Penalty Info Fines imposed for noncompliance, which can be assessed per day or per instance of violation. Jul 3, 2024
$6K
Civil Money Penalty Info Fines imposed for noncompliance, which can be assessed per day or per instance of violation. Sep 26, 2023
$24K

Last updated: Jan 2026

Quality of care over time

These measures show how residents usually do over time at this home, based on health outcomes and preventive care.

High-risk clinical events score Info A composite score based on pressure ulcers, falls with injury, weight loss, walking ability decline, and activities of daily living decline. 9.6
10% worse than South Carolina average

South Carolina average: 8.7

Functional decline score Info A composite score based on activities of daily living decline, walking ability decline, and incontinence. 14.8
In line with South Carolina average

South Carolina average: 15.5

Long-stay resident measures
Need for Help with Daily Activities Increased Info Percent of long-stay residents whose need for help with daily activities has increased 10.7%
18% better than South Carolina average

South Carolina average: 13.1%

Walking Ability Worsened Info Percent of long-stay residents whose ability to move independently worsened 24.7%
52% worse than South Carolina average

South Carolina average: 16.2%

Low Risk Residents with Bowel/Bladder Incontinence Info Percent of low risk long-stay residents who lose control of their bowels or bladder 8.9%
48% better than South Carolina average

South Carolina average: 17.0%

Falls with Major Injury Info Percent of long-stay residents experiencing one or more falls with major injury 2.9%
In line with South Carolina average

South Carolina average: 3.0%

High Risk Residents with Pressure Ulcers Info Percent of long-stay high risk residents with pressure ulcers 5.0%
19% better than South Carolina average

South Carolina average: 6.1%

Urinary Tract Infection Info Percent of long-stay residents with a urinary tract infection 1.4%
16% better than South Carolina average

South Carolina average: 1.6%

Lost Too Much Weight Info Percent of long-stay residents who lose too much weight 4.9%
21% better than South Carolina average

South Carolina average: 6.2%

Depressive Symptoms Info Percent of long-stay residents who have depressive symptoms 1.7%
37% better than South Carolina average

South Carolina average: 2.8%

Antipsychotic Use Info Percent of long-stay residents who received an antipsychotic medication 27.1%
87% worse than South Carolina average

South Carolina average: 14.5%

Pneumococcal Vaccine Info Percent of long-stay residents assessed and appropriately given the pneumococcal vaccine 99.6%
10% better than South Carolina average

South Carolina average: 90.5%

Influenza Vaccine Info Percent of long-stay residents assessed and appropriately given the seasonal influenza vaccine 98.9%
9% better than South Carolina average

South Carolina average: 90.6%

Short-stay resident measures
Pneumococcal Vaccine Info Percent of short-stay residents assessed and appropriately given the pneumococcal vaccine 98.8%
24% better than South Carolina average

South Carolina average: 79.5%

Antipsychotic medication increase Info Percent of short-stay residents who newly received an antipsychotic medication 0.7%
58% better than South Carolina average

South Carolina average: 1.7%

Influenza Vaccine Info Percent of short-stay residents assessed and appropriately given the seasonal influenza vaccine 94.8%
21% better than South Carolina average

South Carolina average: 78.0%

Breakdown by payment type

Medicare

36% of new residents, usually for short-term rehab.

Typical stay 23 days

Private pay

50% of new residents, often for short stays.

Typical stay 3 - 4 months

Medicaid

14% of new residents, often for long-term daily care.

Typical stay 2 years

Facility Characteristics

Source: CMS Long-Term Care Facility Characteristics (Data as of Jan 2026)

Total residents 265
Medicare
28
10.6% of residents
Medicaid
177
66.8% of residents
Private pay or other
60
22.6% of residents
Programs & Services
Residents Group

Residents meet regularly to discuss policies, care quality, and activities

Active Resident Council

Organized group of residents that meets regularly to discuss facility policies, quality of life, and activities.

Finances and operations

Governmental community
Home revenue
$37.9M
Operating deficit
-$2.9M
Governmental community
Home revenue
$37.9M Rank #4 / 116Revenue — State benchmarkedThis home is ranked 4th out of 116 homes in South Carolina. Shows this facility's annual revenue compared to the South Carolina SNF average. Higher revenue generally means more resources for staffing and capital — read alongside Payroll %.Click the rank badge to see the full State ranking.Click here to see the full State ranking.
Operating deficit
-$2.9M
Payroll costs Info The portion of the home's budget spent on staff, including nurses, caregivers, and other employees who support care and operations. Rank #2 / 116Payroll — State benchmarkedThis home is ranked 2nd out of 116 homes in South Carolina. Shows total annual staff payroll benchmarked to the South Carolina average. Higher payroll investment relative to peers often signals better staffing and less reliance on cheaper contract labor.Click the rank badge to see the full State ranking.Click here to see the full State ranking.
$26.2M
69.1% of revenue Rank #8 / 116Payroll % — State benchmarkedThis home is ranked 8th out of 116 homes in South Carolina. Shows payroll as a percentage of revenue versus the South Carolina average. Well-run South Carolina SNFs typically land around 53–64% — the top third Statewide. Below 25% may signal understaffing or heavy agency use — read with Staffing ratings.Click the rank badge to see the full State ranking.Click here to see the full State ranking.
Other operating costs Info All remaining costs needed to run the home, such as food, utilities, building maintenance, supplies and administrative expenses.
$14.6M
Total costs $40.8M

Who this home usually serves

TYPE OF STAY

Mix of rehab and long-term care

This home supports both short-term rehab and long-term care, with residents staying for a wide range of durations.

Places of interest near Lexington Medical Center Extended Care

Address 2426.7 miles from city center Info Estimated distance in miles from Lexington's city center to Lexington Medical Center Extended Care's address, calculated via Google Maps.

Calculate Travel Distance to Lexington Medical Center Extended Care

Add your location

Address

Financial Assistance for
Nursing Home in South Carolina

Lexington Medical Center Extended Care is located in LEXINGTON, South Carolina.
Here are the financial assistance programs available to residents in South Carolina.

Get Financial aid guidance

Community Long Term Care (CLTC)

SC Medicaid CLTC

Age 65+ or disabled
General South Carolina resident, Medicaid-eligible, nursing home-level care need.
Income Limits (2025) ~$2,829/month 300% FBR, individual
Asset Limits $2,000 (individual), $3,000 (couple).
SC

High rural demand; waitlists possible.

Benefits
Personal care (5-7 hours/day) Respite (240 hours/year) Adult day care ($60/day) Home modifications ($1,500 avg.)

South Carolina Respite Care Program

SC NFCSP Respite

Age Caregiver of someone 60+ (or with dementia)
General South Carolina resident.
Income Limits No strict limit; prioritizes low-income.
Asset Limits Not applicable.
SC

Limited slots; rural/urban balance.

Benefits
In-home respite (4-6 hours/day) Adult day care (~$60/day) Short-term facility care (up to 5 days)

Medicare Savings Program (MSP)

South Carolina Medicare Savings Program

Age 65+ or disabled
General SC resident, Medicare Part A/B.
Income Limits (2025) ~$2,510/month (QMB), ~$3,380/month (SLMB), ~$3,598/month (QI)—individual.
Asset Limits $9,430 (individual), $14,130 (couple).
SC

Three tiers; includes Extra Help for Part D; no waitlist.

Benefits
Covers Part B premiums ($174.70/month) Deductibles ($240/year) Copays (~20%)

VA Aid and Attendance (A&A) and Housebound Benefits

South Carolina VA Aid and Attendance/Housebound

Age 65+ or disabled veteran/spouse
General SC resident, wartime service, need for ADL help (A&A) or homebound.
Income Limits (2025) Net income < ~$1,984/month (veteran with dependent, A&A); pension offsets income.
Asset Limits ~$155,356 net worth limit
SC

High veteran population; supports rural/urban care needs.

Benefits
Cash (~$1,433-$2,642/month veteran, ~$951-$1,318 spouse) for care costs (e.g., in-home, assisted living)

Senior Farmers’ Market Nutrition Program (SFMNP)

South Carolina SFMNP

Age 60+
General SC resident, low-income.
Income Limits (2025) ~$2,322/month individual, 185% FPL
Asset Limits Not assessed.
SC

Vouchers (~$50/season); serves ~20,000 annually via 10 AAAs.

Benefits
Vouchers (~$50/season) for fresh produce at approved markets

Homestead Exemption Program

South Carolina Homestead Exemption

Age 65+ (or disabled/blind)
General SC resident 1+ year, homeowner.
Income Limits (2025) None; tax-based eligibility.
Asset Limits Not assessed; home-focused.
SC

Saves ~$500-$1,000/year avg.; applies to primary residence.

Benefits
Property tax exemption (~$50,000 value, ~$500-$1,000/year savings)

Elderly Simplified Application Project (ESAP)

South Carolina ESAP (SNAP for Seniors)

Age 60+
General SC resident, no earned income, not on SCCAP.
Income Limits (2025) ~$1,732/month 133% FPL, individual
Asset Limits $4,250 individual, higher than standard SNAP
SC

Simplified process; serves ~50,000 seniors annually.

Benefits
EBT card for food (~$100-$300/month based on income)

Frequently Asked Questions about Lexington Medical Center Extended Care

What neighborhood is Lexington Medical Center Extended Care in?

Lexington Medical Center Extended Care is in the USA neighborhood of LEXINGTON.

Who is the owner of Lexington Medical Center Extended Care?

The legal owner and operator of Lexington Medical Center Extended Care is Lexmed Inc.

What is the license number of Lexington Medical Center Extended Care?

According to SC state health department records, Lexington Medical Center Extended Care's license number is NCF-0730.

What is the best email address for Lexington Medical Center Extended Care?

The team at Lexington Medical Center Extended Care can be reached at [email protected].

Who is the administrator of Lexington Medical Center Extended Care?

Kathryn Gill is the administrator of Lexington Medical Center Extended Care.

How many beds does Lexington Medical Center Extended Care have?

Lexington Medical Center Extended Care has 388 beds.

What is the address of Lexington Medical Center Extended Care?

Lexington Medical Center Extended Care is located at 815 OLD CHEROKEE RD.

Guides for Better Senior Living

Care Cost Calculator: See Prices in Your Area

Nursing Home Data Explorer

Don’t Wait Too Long: 7 Red Flag Signs Your Parent Needs Assisted Living Now

The True Cost of Assisted Living in 2025 – And How Families Are Paying For It

Understanding Senior Living Costs: Pricing Models, Discounts & Financial Assistance

Explore Open Rooms
1 Contact details
2 What type of senior care service are you looking for?
3 What budget do you have in mind for senior care?
4 How soon do you need to find care?
5 Additional details

Thank you for your interest!

Our team will be in touch shortly to help with next steps.