Occupancy rate
75%

We arrange tours, appointments, and even moving support so you don’t have to
Thank you for your interest!
Our team will be in touch shortly to help with next steps.
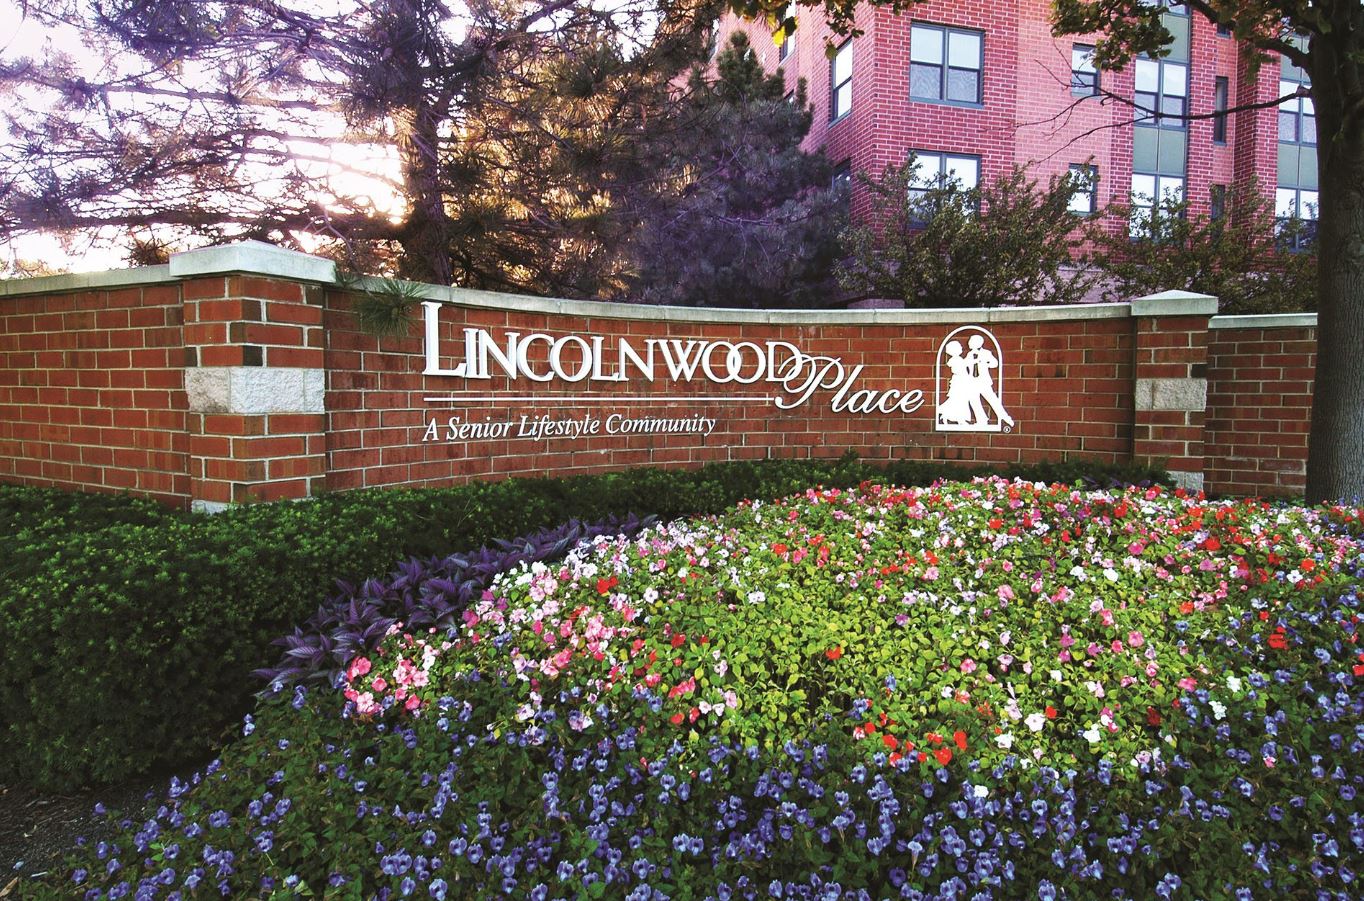
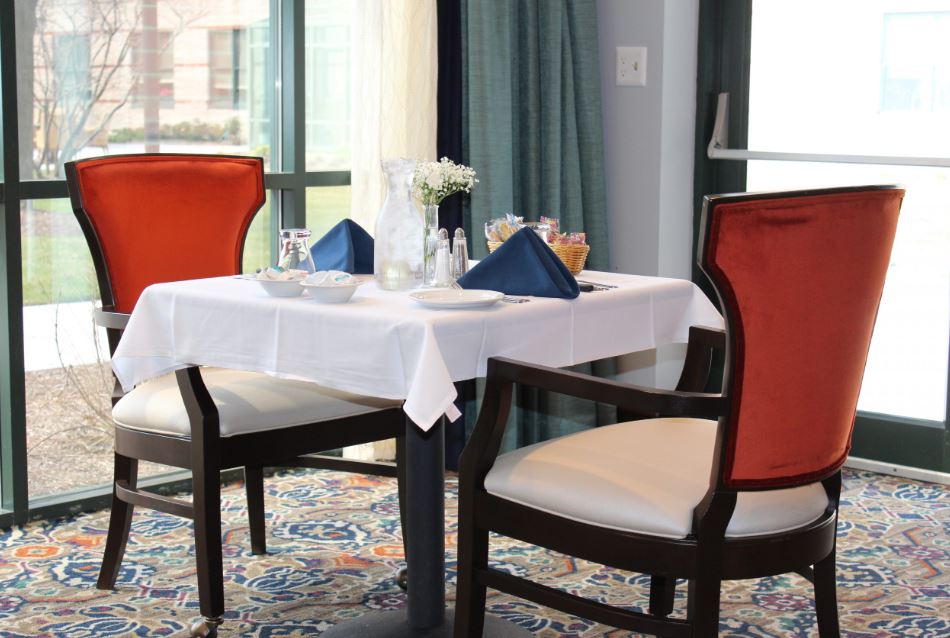
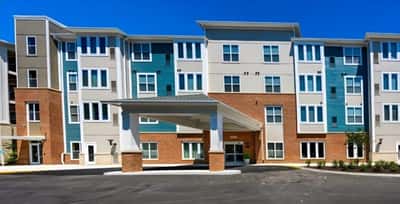
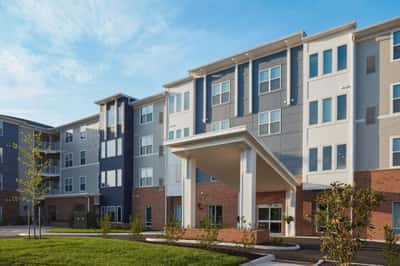
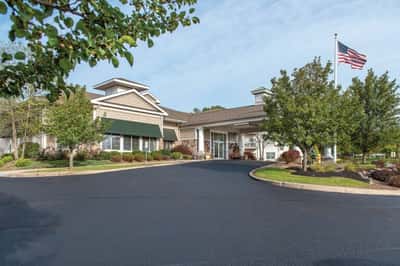
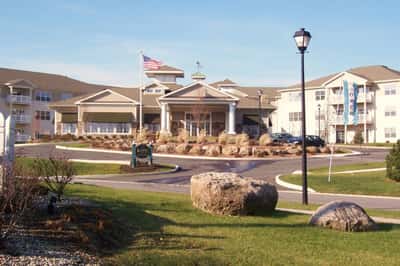
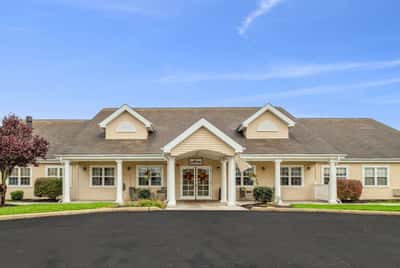
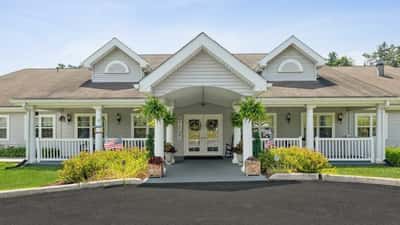
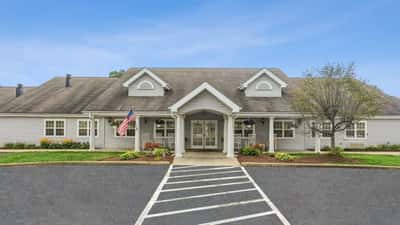
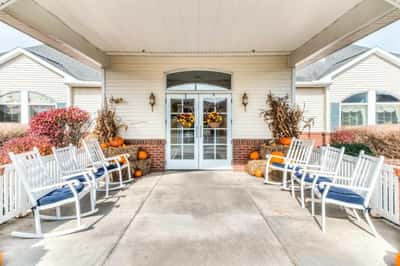
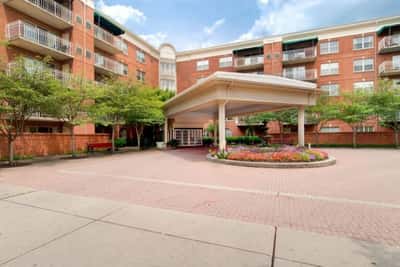
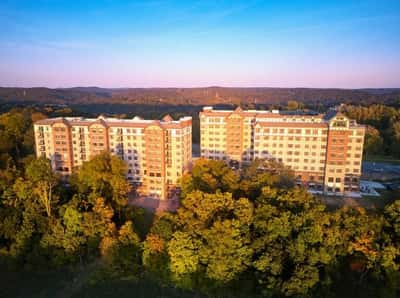
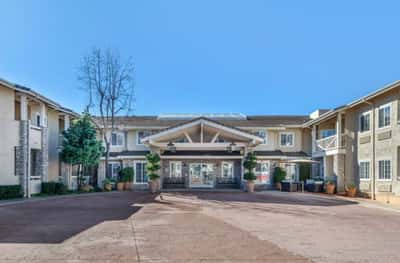
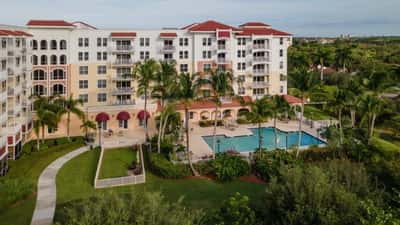
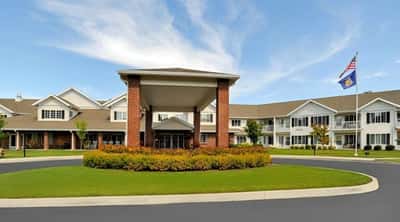
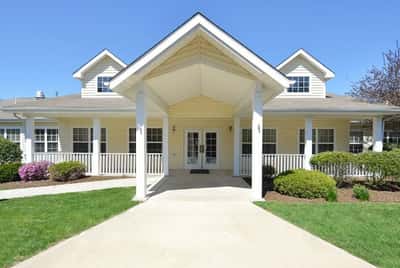
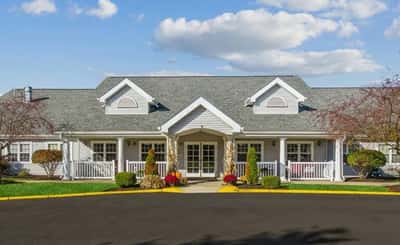
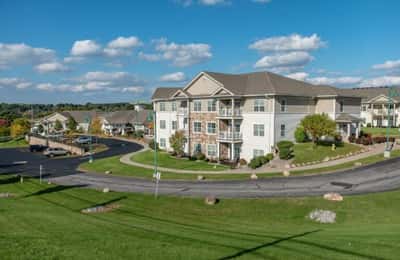
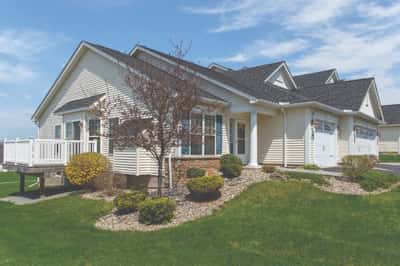
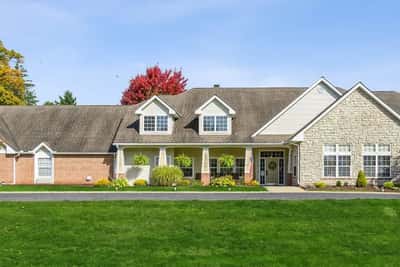
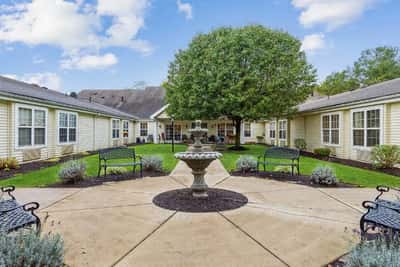
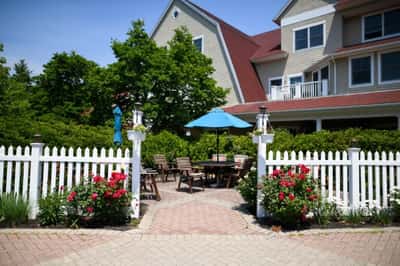
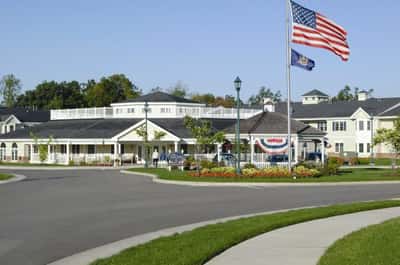
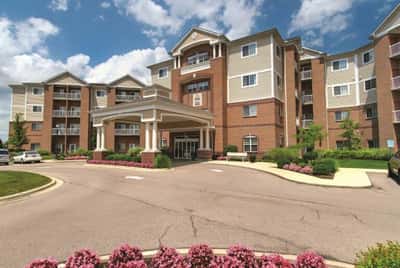
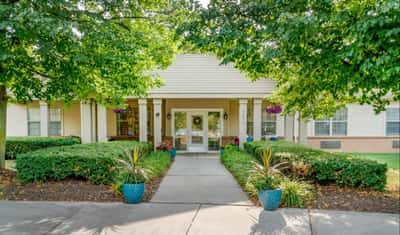
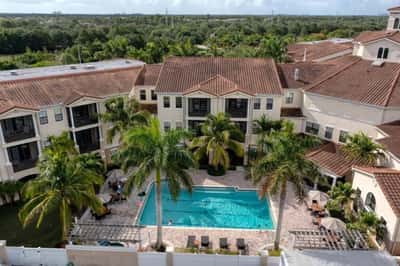
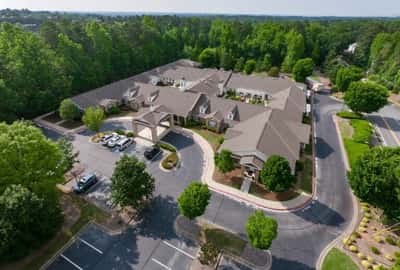
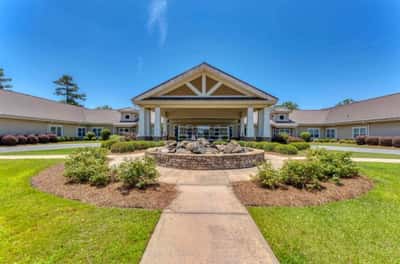
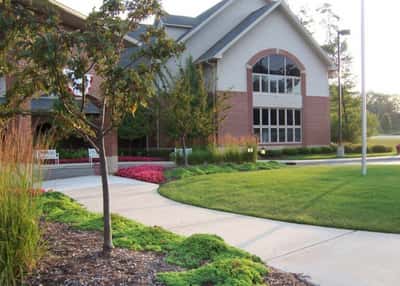
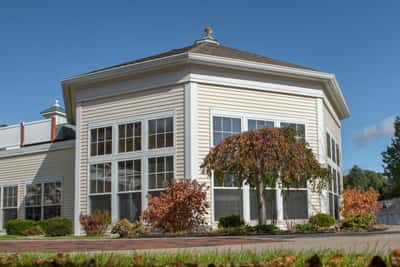
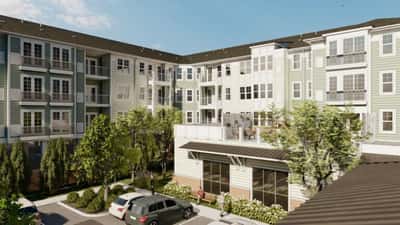
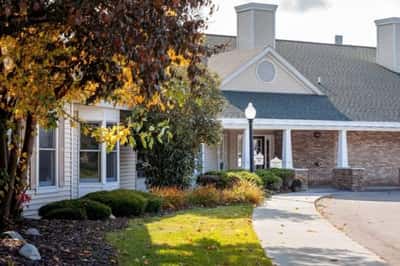
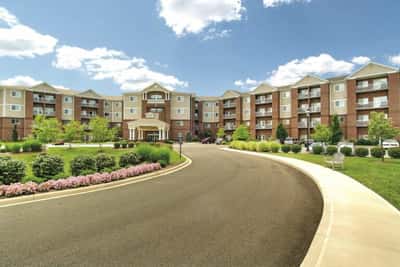
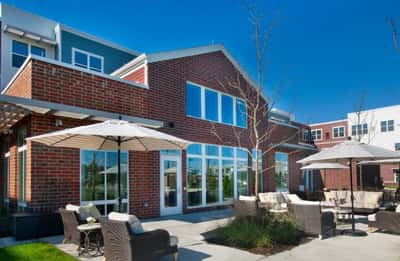
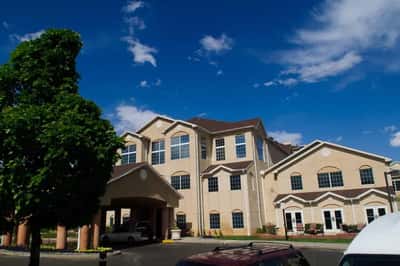
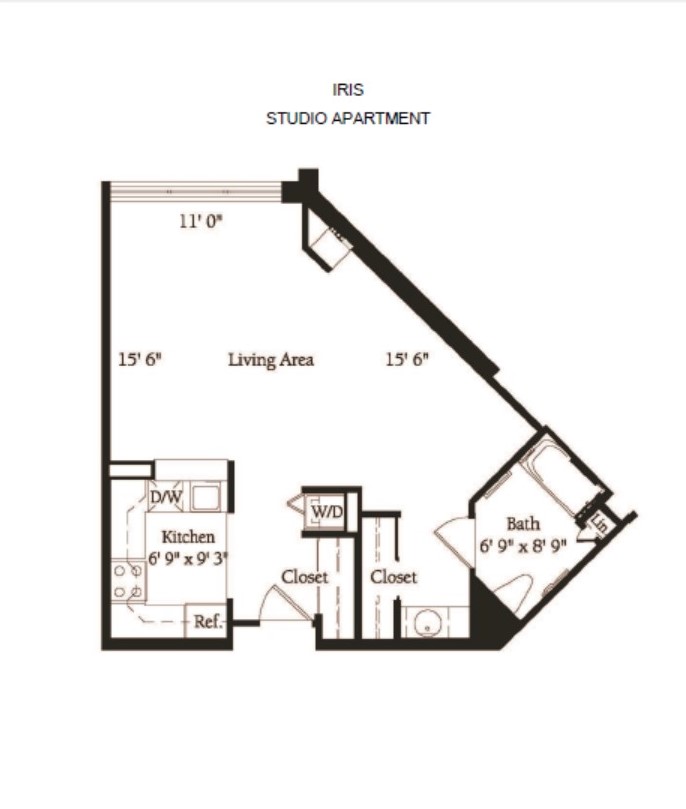
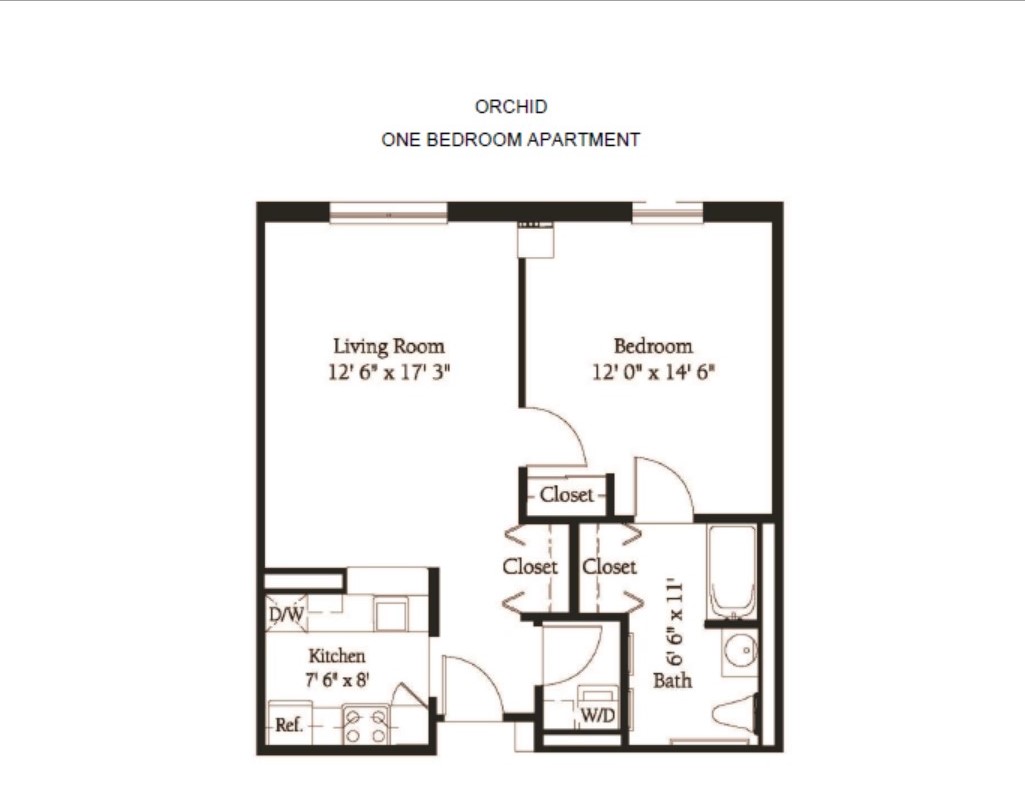
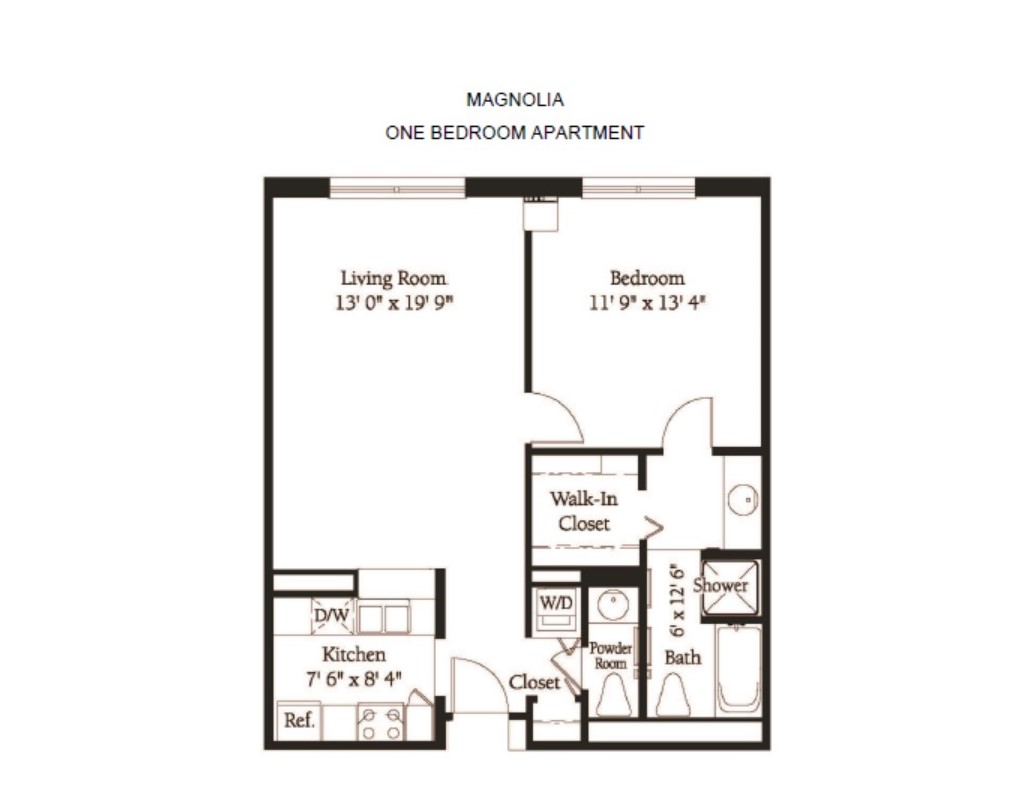
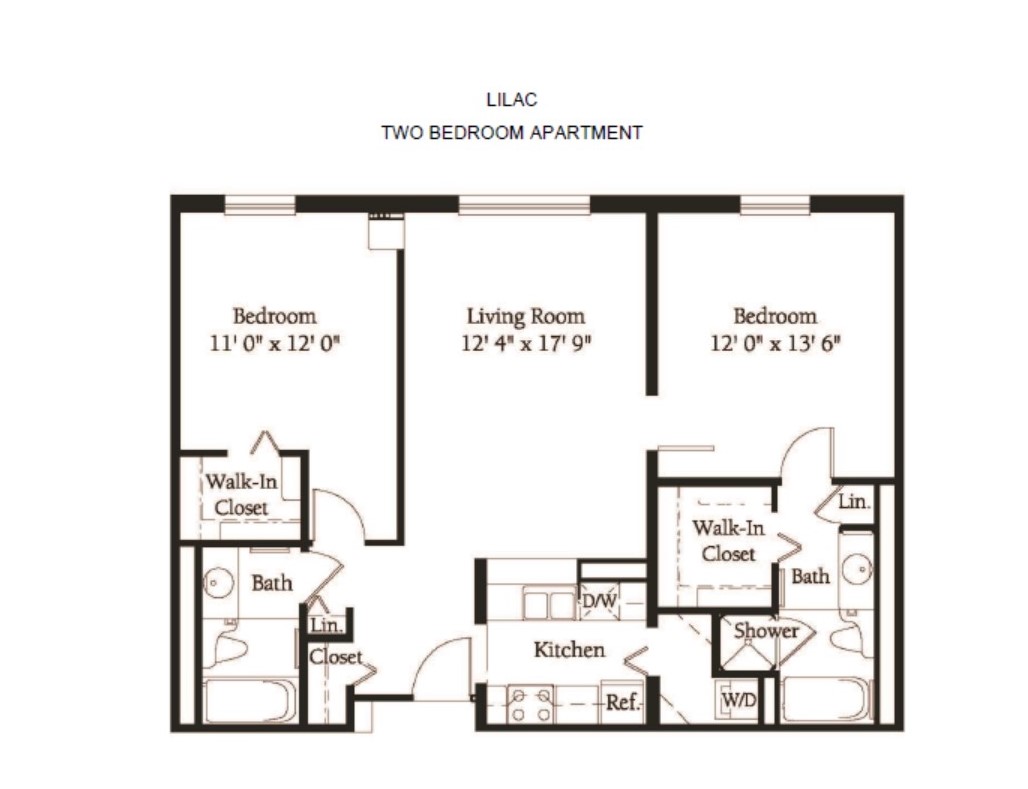
Overlooking the vibrant community of Lincolnwood, IL, Lincolnwood Place is an upscale senior living community that offers a variety of senior living options, including independent living, assisted living, memory care, short-term care, and skilled nursing. As a Continuous Care Retirement Community, the community ensures residents a seamless transition should their needs change. Featuring a range of floor plans, including a studio, one-bedroom, and two-bedroom apartments, the community ensures residents a comfortable living space.
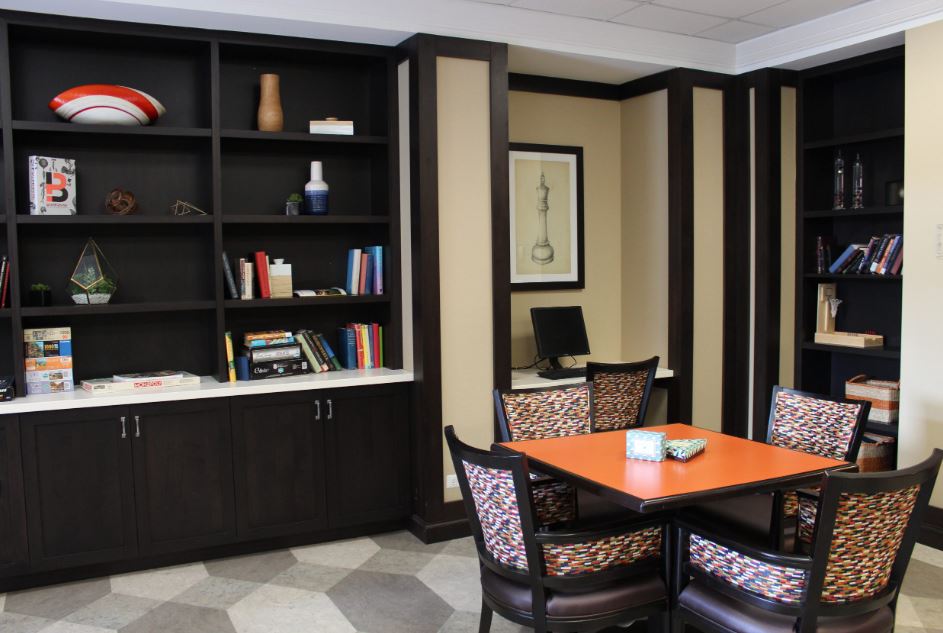
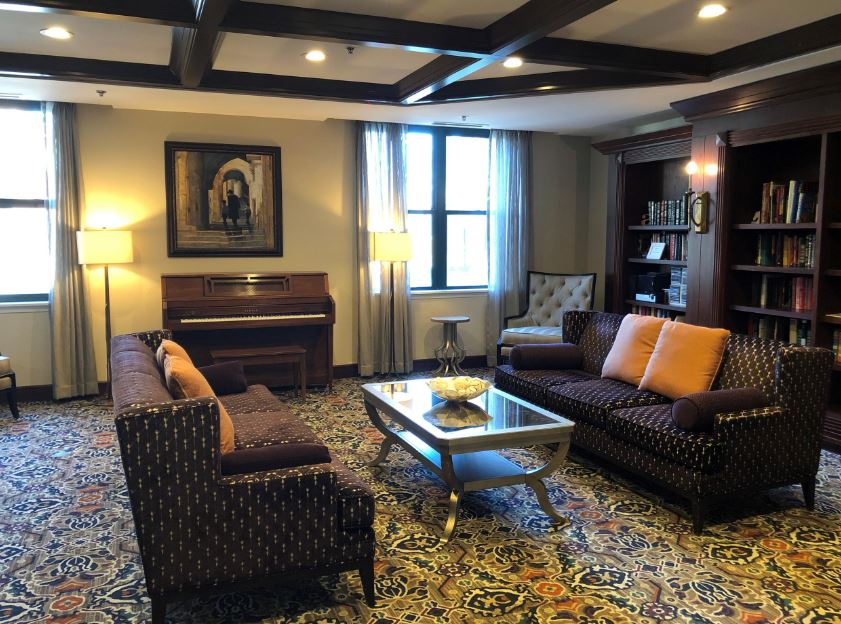
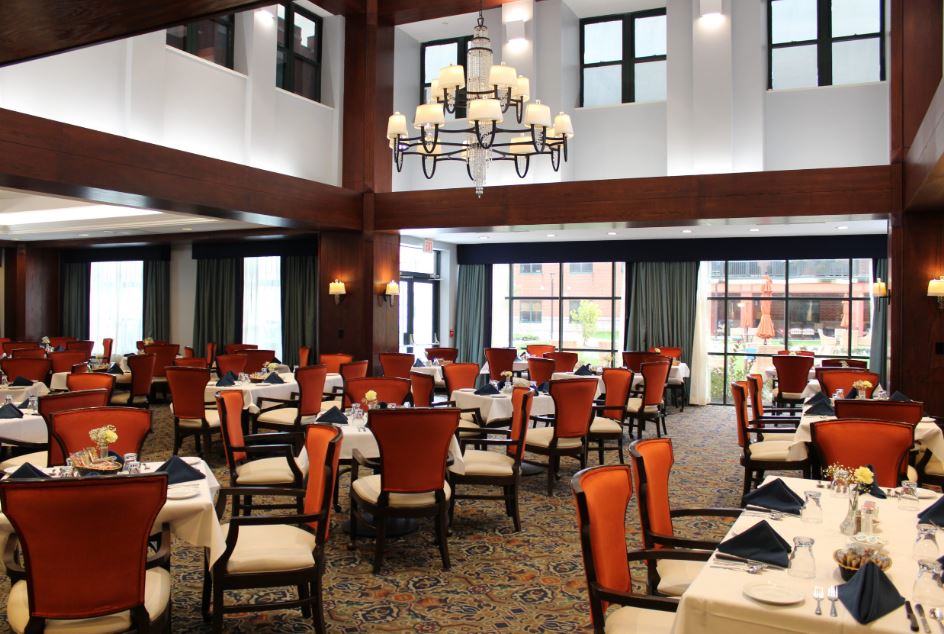
Residents feel safe, secure, and attended to in the community with a team of compassionate team members available to provide care 24/7. The community ensures plenty of enjoyable opportunities with a broad range of activities and amenities, such as a barbershop, fitness center, a theater, rehabilitation gym, a library, courtyard, and spacious community rooms. Residents feel appreciated through carefully curated meals and menus tailored to their needs and preferences.
May offer a more intimate, personalized care environment.
Lower occupancy suggests more openings may be available.
Most residents typically stay for a few weeks or months before returning home or moving on.
55% of new residents, usually for short-term rehab.
45% of new residents, often for short stays.
Lincolnwood Place is legally operated by GA HC REIT II LINCOLNWOOD TRS SUB,LLC.
Housing Options: Studio / 1 Bed / 2 Bed
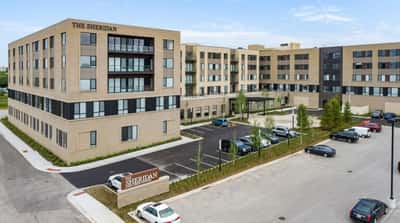
Building Type: Mid-rise
Transportation Services
Fitness and Recreation
In Illinois, the Department of Public Health, Office of Health Care Regulation conducts annual unannounced surveys to assess compliance with state and federal healthcare facility standards.
2 visits/inspections triggered by complaints
2 other visits
The most recent inspection on June 7, 2025, was a complaint investigation that could not be completed because the subject of the complaint did not reside in the assisted living area of the facility. Earlier inspections, including a complaint investigation on February 15, 2025, found the facility in compliance with relevant assisted living regulations. No deficiencies, fines, or enforcement actions were listed in the available reports. Complaint investigations during this period were either unsubstantiated or not completed due to jurisdictional reasons. The inspection history shows no identified issues and suggests stable compliance with regulatory requirements.
Illinois average 10.4
Last Health inspection on Dec 2024
Illinois average 36.8
Illinois average 3.68
Health citations are formal notices following inspections when they fail to comply with safety and care standards.
7 of 9 citations resulted from standard inspections; and 2 of 9 resulted from complaint investigations.
Illinois average: 0.7
Illinois average: 3.6
Data sourced from CMS Health Deficiencies reports. Citation severity codes range from A (least serious) to L (most serious). Immediate Jeopardy (J-L) citations indicate situations where the facility's noncompliance has placed residents at risk of death or serious harm.
Assisted Living A licensed, long-term care setting for seniors or individuals with disabilities who need help with daily activities — like bathing, dressing, and medication management — but not 24-hour skilled nursing. Offers housing, meals, and around-the-clock support while aiming to maximize resident independence.
Independent Living Lifestyle-focused communities for older adults offering dining, activities, and transportation with minimal personal care. Best for active, independent seniors who want community without medical support.
Memory Care Secured, specialized care for people living with Alzheimer's or dementia. Staff trained in cognitive impairment, with higher staff-to-resident ratios and an environment designed to reduce confusion and wandering risk.
Nursing Home Licensed facility providing 24/7 skilled nursing care for residents with complex, ongoing medical needs. Staffed by RNs, LPNs, and CNAs. Inspected and star-rated annually by CMS. Accepts Medicare (short-term rehab) and Medicaid (long-term care).
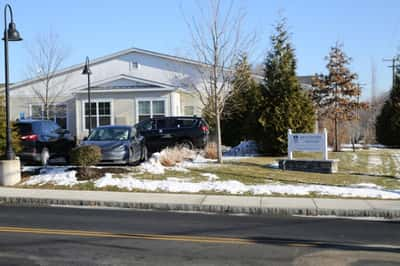
![]() 1.3 miles from city center — 5.27 miles to nearest hospital (Resurrection Medical Center - Emergency Fast Track)
1.3 miles from city center — 5.27 miles to nearest hospital (Resurrection Medical Center - Emergency Fast Track)
![]() 7000 N McCormick Blvd, Lincolnwood, IL 60712
7000 N McCormick Blvd, Lincolnwood, IL 60712
Add your location
This data corresponds to Q2 2025 and is based on CMS Payroll-Based Journal.
Illinois average ratio: 1.90:1
Illinois average: 7.6 hours
Manages medical care and health needs.
This role is partially covered by contractors.
Assists with medical care and medications.
This role is partially covered by contractors.
Helps with daily care and mobility.
This role is partially covered by contractors.
Total hours from contractors
2,433 contractor hours this quarter
| Certified Nursing Assistant | 34 | 53 | 87 | 7,452 | 91 | 100% | 7.5 |
| Registered Nurse | 16 | 15 | 31 | 3,735 | 91 | 100% | 7.6 |
| Clinical Nurse Specialist | 3 | 0 | 3 | 825 | 76 | 84% | 6.2 |
| Other Dietary Services Staff | 5 | 0 | 5 | 666 | 85 | 93% | 7.8 |
| Respiratory Therapy Technician | 0 | 4 | 4 | 464 | 67 | 74% | 6.9 |
| Nurse Practitioner | 1 | 0 | 1 | 458 | 61 | 67% | 7.5 |
| Administrator | 1 | 0 | 1 | 443 | 59 | 65% | 7.5 |
| Physical Therapy Aide | 0 | 2 | 2 | 436 | 60 | 66% | 7.3 |
| Mental Health Service Worker | 1 | 0 | 1 | 435 | 58 | 64% | 7.5 |
| Dietitian | 1 | 0 | 1 | 390 | 50 | 55% | 7.8 |
| Licensed Practical Nurse | 1 | 9 | 10 | 349 | 45 | 49% | 6.9 |
| Qualified Social Worker | 0 | 1 | 1 | 229 | 50 | 55% | 4.6 |
| Speech Language Pathologist | 0 | 5 | 5 | 219 | 62 | 68% | 3.3 |
| Physical Therapy Assistant | 0 | 3 | 3 | 109 | 46 | 51% | 2.4 |
| Occupational Therapy Aide | 0 | 1 | 1 | 48 | 8 | 9% | 6 |
| Medical Director | 0 | 1 | 1 | 18 | 15 | 16% | 1.2 |
| Occupational Therapy Assistant | 0 | 1 | 1 | 12 | 8 | 9% | 1.5 |
Source: CMS Long-Term Care Facility Characteristics (Data as of Jan 2026)
Residents meet regularly to discuss policies, care quality, and activities
Part of a Continuing Care Retirement Community offering multiple care levels
Organized group of residents that meets regularly to discuss facility policies, quality of life, and activities.
Data sourced from CMS Long-Term Care Facility Characteristics quarterly report. Payer mix reflects the current resident census by primary payment source.
These measures show how residents usually do over time at this home, based on health outcomes and preventive care.
Illinois average: 9.7
Illinois average: 18.6
Illinois average: 15.5%
Illinois average: 21.6%
Illinois average: 3.4%
Illinois average: 5.3%
Illinois average: 1.8%
Illinois average: 6.5%
Illinois average: 48.1%
Illinois average: 20.2%
Illinois average: 89.2%
Illinois average: 91.6%
Illinois average: 68.3%
Illinois average: 2.3%
Illinois average: 63.0%
Quality measures are calculated from Minimum Data Set (MDS) assessments. For most measures, lower percentages indicate better care quality.
Federal penalties imposed by CMS for regulatory violations, including civil money penalties (fines) and denials of payment for new Medicare/Medicaid admissions.
Source: CMS Penalties Database (Data as of Jan 2026)
Illinois average: $143K
Illinois average: 3.0
Illinois average: 1.1
Penalties are imposed by CMS for violations of federal nursing home regulations.
Last updated: Jan 2026
Historical financial and operational data for Lincolnwood Place based on CMS SNF Cost Reports.
Loading trend charts...
Care Cost Calculator: See Prices in Your Area
Nursing Home Data Explorer
Don’t Wait Too Long: 7 Red Flag Signs Your Parent Needs Assisted Living Now
The True Cost of Assisted Living in 2025 – And How Families Are Paying For It
Understanding Senior Living Costs: Pricing Models, Discounts & Financial Assistance

Touring a community? Use this expert-backed checklist to stay organized, ask the right questions, and find the perfect fit.
We'll send you a PDF version of the touring checklist.