Loma Linda Post Acute

Nursing Home
Overview of Loma Linda Post Acute

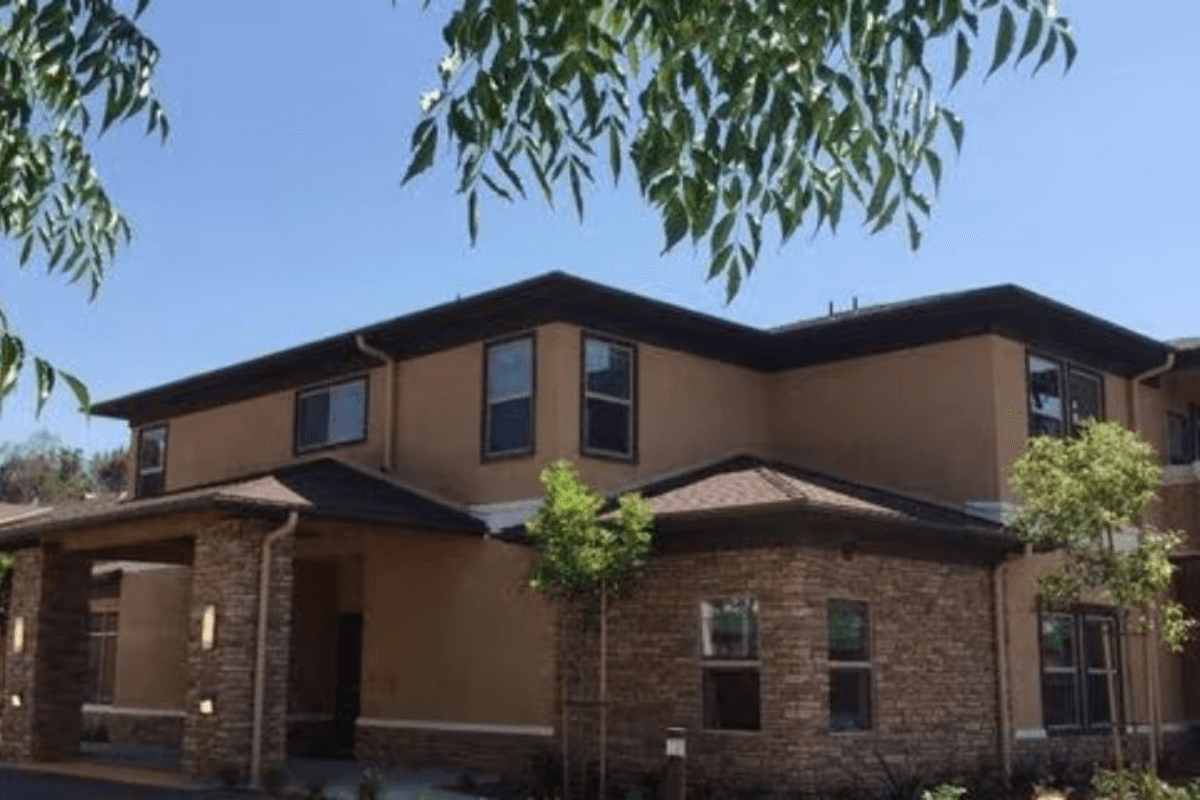
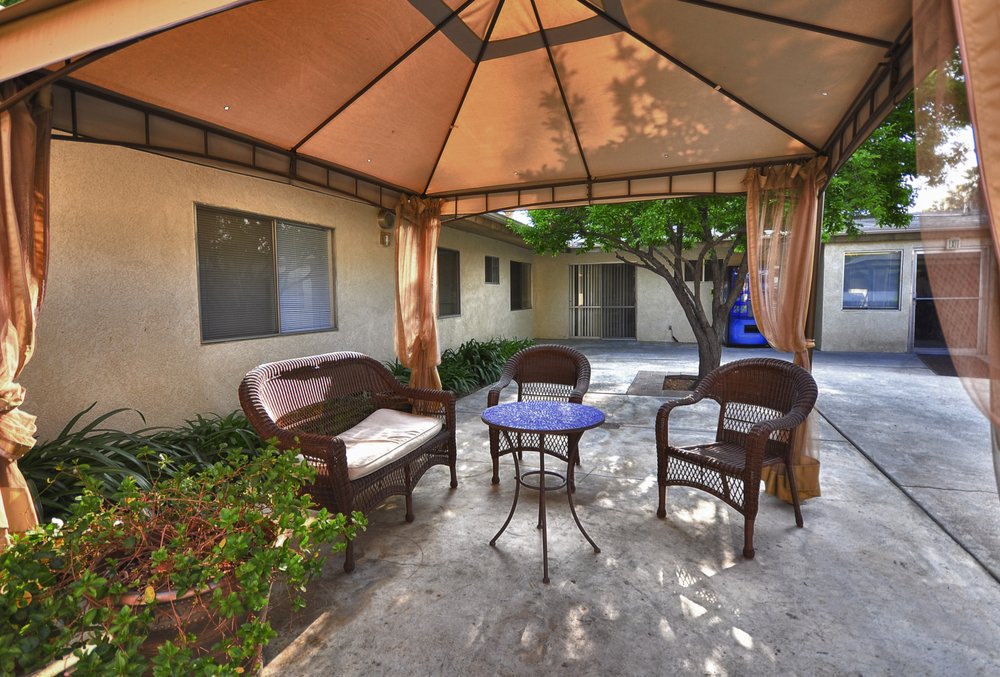
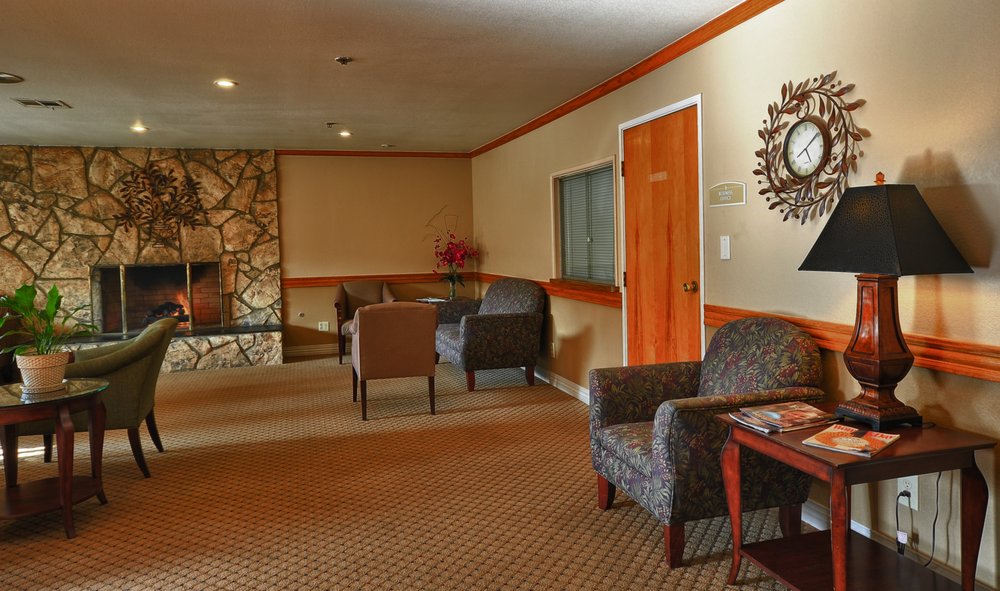
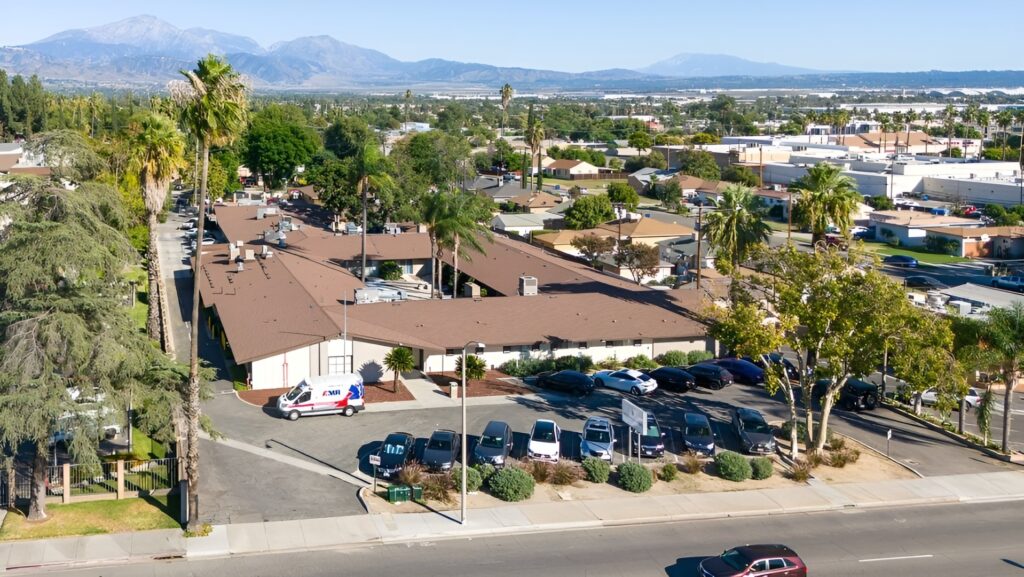
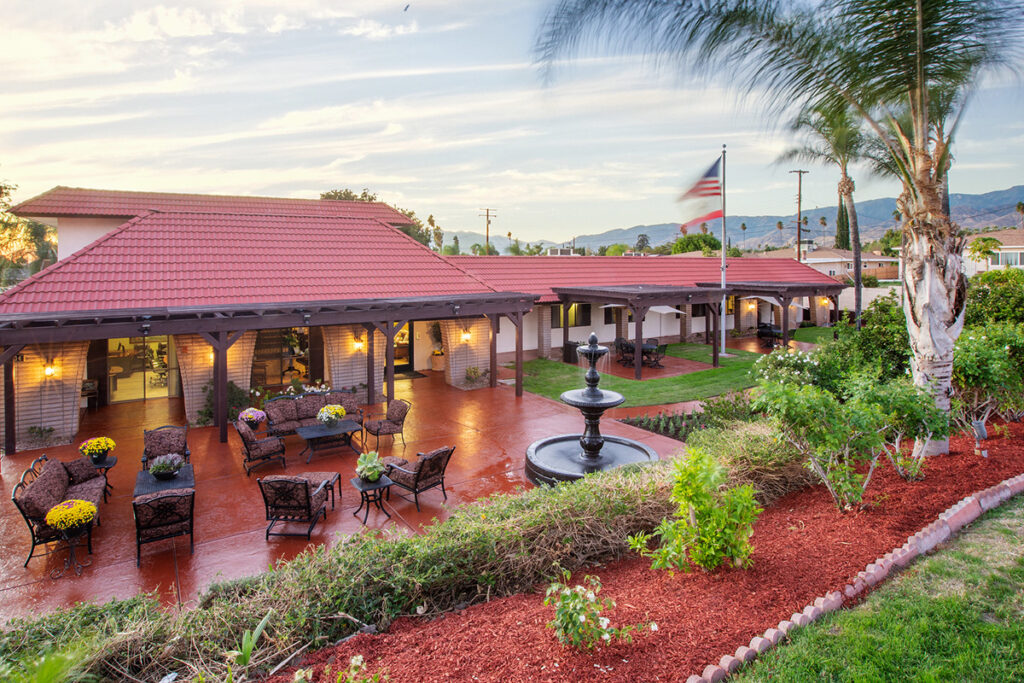
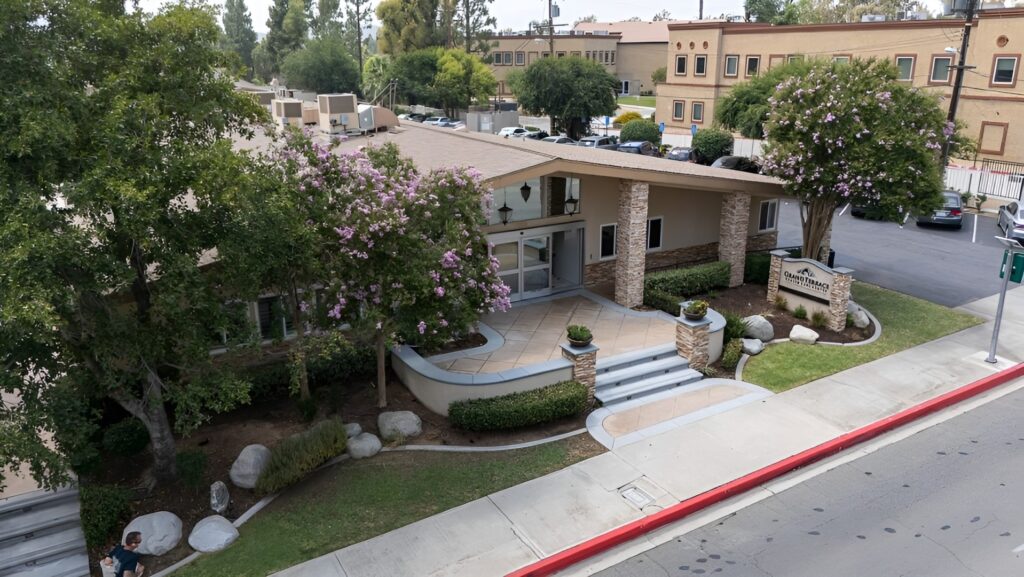
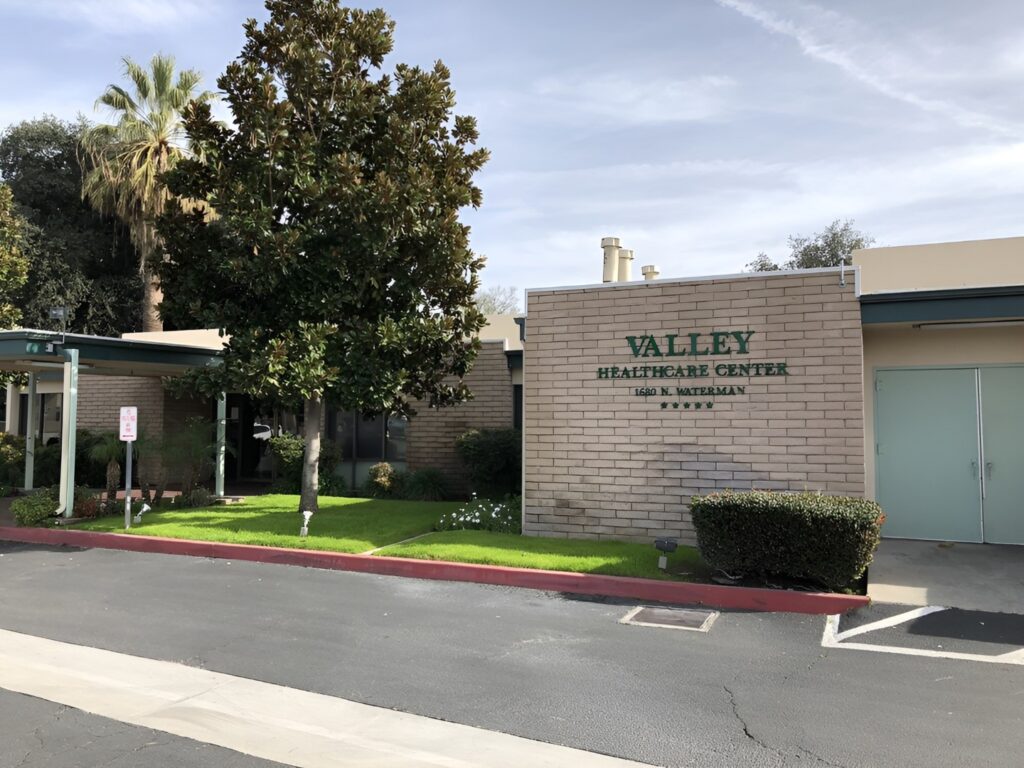
Loma Linda Post Acute is an esteemed community located near Jerry L Pettis Memorial Veterans Hospital in Loma Linda, CA, that offers rehabilitation and skilled nursing. The community strives to provide the highest quality of care and support 24/7, ensuring residents’ comfort and safety. Promoting a nurturing and welcoming environment, the community utilizes a holistic approach to care for residents to feel a sense of belonging.

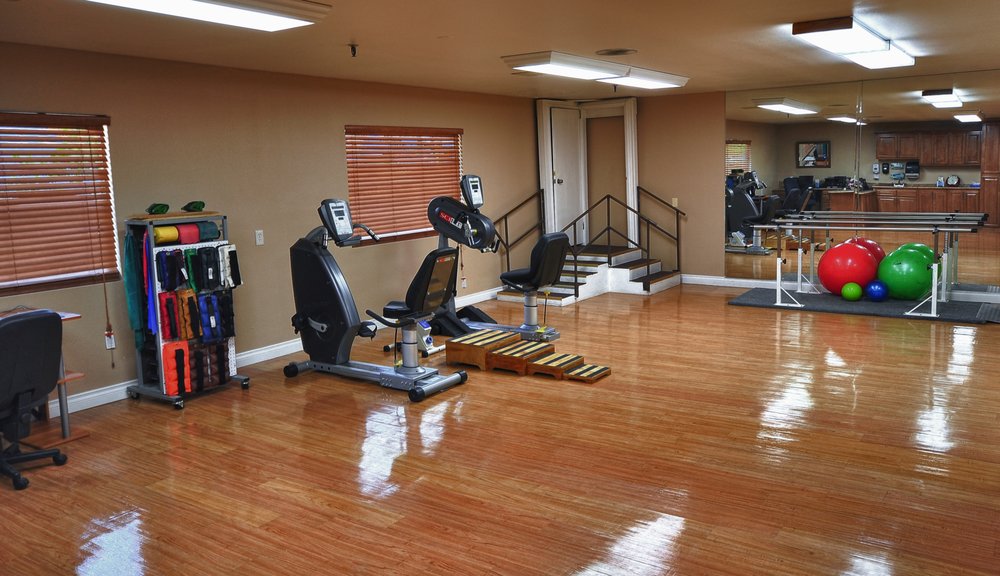
Keeping residents active and socially engaged, a variety of enriching programs and fun-filled activities are conducted for their leisure and wellness. With occupational, physical, and speech therapy, the community goes above and beyond to enhance residents’ living experiences. Make the most of your golden years amidst the community’s dedicated care and state-of-the-art amenities.

(909) 796-0235

Quality ratings

Measured by Centers for Medicare & Medicaid Services (CMS)

Overall rating Info Official CMS rating based on health inspections, staffing and quality measures.
4/5
California average: 3.1/5
Health Inspection Info Official CMS rating based on deficiencies found during state health inspections.
4/5
California average: 2.8/5
Staffing Info Official CMS rating based on nurse staffing hours per resident per day.
3/5
California average: 3.1/5
Quality Measures Info Official CMS rating based on clinical outcomes for residents.
3/5
California average: 4.1/5

Nursing care per resident

Info Average daily nursing hours per resident (adjusted for acuity). Higher values indicate more nursing time per resident.
3h 51m per day

This home provides 9% less nursing time per resident than the state average.

California average: 4h 13m per day

Staffing hours breakdown

Info Hours of care per resident per day, broken down by staff type. Data from CMS Medicare.
Staff type Facility State avg National avg
Registered Nurse (RN) Info Registered nurse hours per resident per day. 23m per day 39m per day 41m per day
LPN / LVN Info Licensed Practical Nurse / Licensed Vocational Nurse hours per resident per day. 1h 8m per day 1h 13m per day 52m per day
Nurse Aide Info Nurse aide hours per resident per day. 2h 35m per day 2h 39m per day 2h 21m per day
Total Nursing (Weekend) Info Total number of nurse staff hours per resident per day on weekends. 3h 43m per day 4h 5m per day 3h 26m per day
Physical Therapist Info Physical therapist staff hours per resident per day. 2m per day 5m per day 4m per day
RN (Weekend) Info Registered nurse hours per resident per day on weekends. 18m per day 30m per day 29m per day

Capacity and availability

Smaller home

May offer a more intimate, personalized care environment.

Total beds 64

This home usually has limited availability

Occupancy is moderate, suggesting balanced demand.

Similar demand to the California average
Occupancy rate 93.3%
Residents per day (avg) 79
Occupancy rate
93.3%
Residents per day (avg)
79

Who this home usually serves

TYPE OF STAY

Primarily short stays

Residents typically stay for brief periods, with frequent admissions and discharges throughout the year.

Might be optimal for
Post-acute recovery Temporary care Transitional stays

Breakdown by payment type

Medicare

23% of new residents, usually for short-term rehab.

Typical stay 1 - 2 months

Private pay

66% of new residents, often for short stays.

Typical stay 3 - 4 months

Medicaid

11% of new residents, often for long-term daily care.

Typical stay 16 days

Finances and operations

Proprietary home
Corporation
Home revenue
$6.4M
Profit
$77.5K
Proprietary home Corporation
Home revenue
$6,432,558.00
Profit
$77,455.00
Payroll costs Info The portion of the home's budget spent on staff, including nurses, caregivers, and other employees who support care and operations.
$2.4M
36.7% of revenue
Other operating costs Info All remaining costs needed to run the home, such as food, utilities, building maintenance, supplies and administrative expenses.
$4.0M
Total costs $6.4M
Bed community size
64-bed community
A moderately sized community that may balance personal attention with shared amenities and social activities.
Years in operation
1 year in operation
A newer community that may feature more recent facilities and programs.
Walk Score
Walk Score: 39 / 100
Somewhat walkable. A few nearby services may be reachable on foot, but most trips require transportation.

About this community

Occupancy Rate
80%
Occupied Beds
51 of 64
Percentage of available beds currently in use by residents.
License Status
LICENSED
Facility Type
RESIDENTIAL CARE ELDERLY
License Date
November 27, 2024

Additional licensing details

County: SAN BERNARDINO
Awards: Best Nursing Homes – Short-Term Rehabilitation award from U.S. News; 4-Star Overall Medicare Rating

Ownership & operating entity

Loma Linda Post Acute is legally operated by LOMA LINDA ALF, LLC.

Care Services

Nursing Services
Rehabilitation Services
Skilled Nursing
Licensed Nurses/CNAs
24-Hour Staffing
Short-Term Rehab

All Levels of Care

Skilled Nursing
Rehabilitation

Programs & Activities

Specific Programs
Skilled Nursing, Rehabilitation, Activities, Social Services

What does this home offer?

Housing options icon

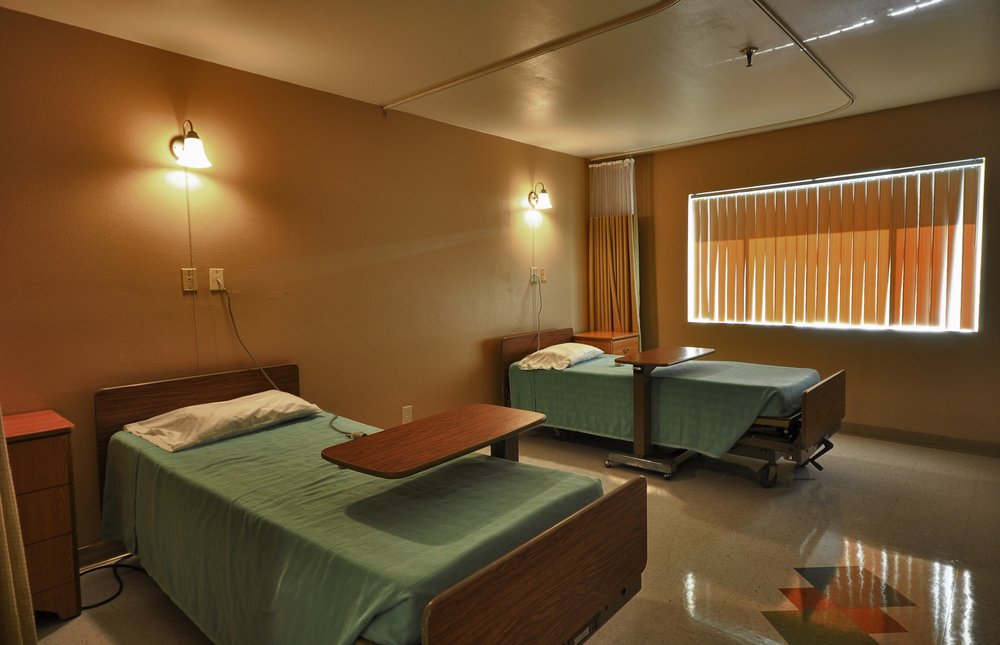
Housing Options: Semi-Private Rooms

Building type icon
Building type icon

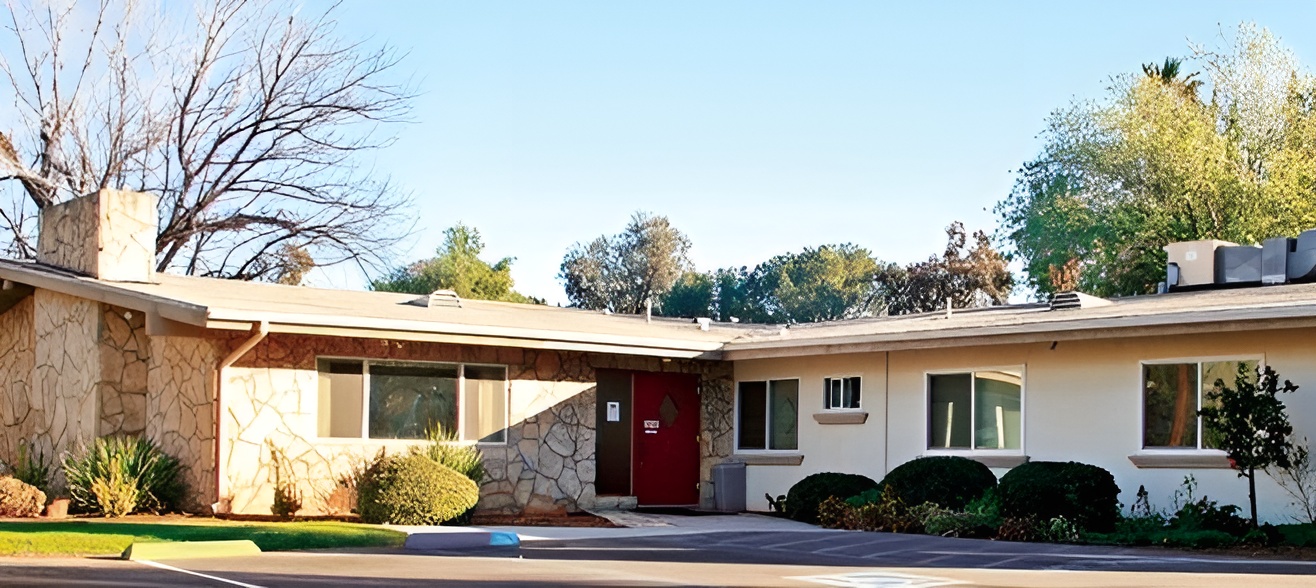
Building Type: Single-story

Dining services icon

Dining Services

Transportation services icon

Transportation Services

Housekeeping icon
Housekeeping icon

Housekeeping Services

Recreational activities icon

Recreational Activities

Exercise program icon

Exercise Programs

Types of Care at Loma Linda Post Acute

Nursing Home
Contact Loma Linda Post Acute

Inspection History

In California, the Department of Social Services (for assisted living facilities) and the Department of Public Health (for nursing homes) conduct inspections to ensure resident safety and regulatory compliance.

2 visits

Breakdown by visit type

0 total complaint visits

2 other visits Info Other visits include regulatory visits that are not routine inspections or complaint investigations, such as administrative check-ins, follow-up reviews, or licensing-related visits.

1 official inspection

3 total citations

Citations indicate regulatory violations. A higher number implies the facility had several areas requiring improvement.

2 serious citations

A violation that poses an immediate risk to resident health or safety, or represents a substantial failure to comply with licensing requirements.

1 moderate citation

A violation that does not pose an immediate risk to resident health or safety but requires correction to remain in compliance.

Latest inspection

Date:November 15, 2024
Type:Original Licensing

Inspection Report Summary for Loma Linda Post Acute

The most recent inspection on November 15, 2024, found the facility in good repair with no deficiencies, indicating it is ready for licensure. Earlier on October 24, 2024, the licensing visit confirmed the applicant and administrator understood the relevant laws and were prepared to operate the facility. Both inspections were part of the pre-licensing process and found no issues or complaints. There were no fines, enforcement actions, or severe findings noted in the reports. The facility’s record shows a clean start with no deficiencies identified.

Compare Nursing Homes around San Bernardino County

The information below is reported by the California Department of Social Services and Department of Public Health.
Arrowhead Springs Healthcare Center
SNF

Nursing Homes 24/7 care needed

San Bernardino (Perris Hills)
119
No
-
69
SANCHEZ GONZALEZ, YAMALIEL
87.3%
$19,659,991.00
$7,377,247.00
37.5%
106.50
5/5
4.5628
4/5
4/5
5/5
32
-
+1%
+8%
+3%
Private / Semi-Private Rooms
Highland Palms Healthcare Center
SNF

Nursing Homes 24/7 care needed

Highland (Cypress)
99
No
A+
57
SIVAPALAN, SIVAKAMI
93.2%
$26,652,256.00
$7,129,881.00
26.8%
91.50
5/5
3.1704
4/5
2/5
5/5
33
-
-32%
-25%
+10%
Private Rooms
Grand Terrace Health Care Center
SNF

Nursing Homes 24/7 care needed

Grand Terrace
59
No
-
67
-
90.5%
$10,440,299.00
$4,433,593.00
42.5%
51.30
4/5
4.1117
4/5
3/5
4/5
30
1
+5%
-3%
+7%
Private / Semi-Private Rooms
Loma Linda Post Acute
SNF

Nursing Homes 24/7 care needed

Loma Linda
83
No
-
39
CHANCELLOR HEALTH CARE INC
79.7%
$6,389,080.00
$2,358,380.00
36.9%
78.50
4/5
3.8491
4/5
3/5
3/5
29
-
-30%
-9%
-6%
Semi-Private Rooms
Valley Healthcare Center
SNF

Nursing Homes 24/7 care needed

San Bernardino
202
No
A+
60
VALE HOLDING COMPANY LLC
80.4%
$30,281,364.00
$10,424,406.00
34.4%
189.90
4/5
4.1836
3/5
4/5
5/5
45
-
-27%
-1%
-5%
Private / Semi-Private / 3 Bed Rooms

Places of interest near Loma Linda Post Acute

Address 0.9 miles from city center

Address 25383 Cole St, Loma Linda, CA 92354

Calculate Travel Distance to Loma Linda Post Acute

Add your location

Address

Staffing Data

Source: CMS Payroll-Based Journal (Q2 2025)

134
Total Staff
134
Employees
0
Contractors
36,329
Total Hours (Quarter)
56
Avg Staff/Day
7.1
Avg Shift (hrs)
Nursing Staff Breakdown
Role Count Avg Shift (hrs) Uses Contractors?
Registered Nurse87.5 No
Licensed Practical Nurse207.9 No
Certified Nursing Assistant677.1 No
Staff by Category
Administration
1 staff
8hs shift avg
Nursing Staff
99 staff
7.3hs shift avg
Physicians & Practitioners
3 staff
7.7hs shift avg
Therapy Services
26 staff
5.5hs shift avg
Activities & Recreation
1 staff
7.9hs shift avg
Social Services
1 staff
5.2hs shift avg
Dietary Services
3 staff
8.2hs shift avg
Other Services
0 staff
0hs shift avg
Role Employees Contractors Total Staff Total Hours Days Worked % of Days Avg Shift (hrs)
Certified Nursing Assistant6706719,34191100%7.1
Licensed Practical Nurse200207,17091100%7.9
Speech Language Pathologist100102,2448189%6.2
Registered Nurse8081,78891100%7.5
RN Director of Nursing4041,3177077%6.9
Physical Therapy Assistant6061,1726673%5.2
Dietitian1015256167%8.6
Other Dietary Services Staff2025176167%7.9
Administrator1015126470%8
Nurse Practitioner1015046369%8
Qualified Activities Professional1014575864%7.9
Clinical Nurse Specialist2024234145%7.4
Respiratory Therapy Technician9093397684%3.5
Qualified Social Worker1011633%5.2
Physical Therapy Aide101611%6

Health Inspection History

Inspections
Total health inspections 9

California average 12.5


Last Health inspection on Jul 2025

Total health citations 29
Citations per inspection
3.22

Health citations are formal notices following inspections when they fail to comply with safety and care standards.

23 of 29 citations resulted from standard inspections; and 6 of 29 resulted from complaint investigations.

Breakdown of citation severity (last 3 years)
Critical Health citations More info 0
100% better than California average

California average: 0.4


Serious Health citations More info 0
100% better than California average

California average: 1

0 critical citations More info California average: 0.4

0 serious citations More info California average: 1

28 moderate citations More info California average: 47.2

1 minor citation More info California average: 1.5
Citations history (last 3 years)
Nutrition moderate citation Jul 03, 2025
Corrected

Pharmacy moderate citation Jul 03, 2025
Corrected

Quality of Care moderate citation Jul 03, 2025
Corrected

Quality of Care moderate citation Jul 03, 2025
Corrected

Facility Characteristics

Source: CMS Long-Term Care Facility Characteristics (Data as of Jan 2026)

Ownership: For-Profit LLC
Resident Census by Payment Source
81 Total Residents
Medicare 24 (29.6%)
Medicaid 37 (45.7%)
Private Pay/Other 20 (24.7%)
Programs & Services
Residents' Group
Family Engagement

Active councils help families stay involved in care decisions and facility operations.

Quality of care over time

These measures show how residents usually do over time at this home, based on health outcomes and preventive care.

High-risk clinical events score Info A composite score based on pressure ulcers, falls with injury, weight loss, walking ability decline, and activities of daily living decline. 8.8
33% worse than California average

California average: 6.6

Functional decline score Info A composite score based on activities of daily living decline, walking ability decline, and incontinence. 16.0
41% worse than California average

California average: 11.3

Long-stay resident measures
Need for Help with Daily Activities Increased Info Percent of long-stay residents whose need for help with daily activities has increased 16.2%
46% worse than California average

California average: 11.1%

Walking Ability Worsened Info Percent of long-stay residents whose ability to move independently worsened 15.8%
31% worse than California average

California average: 12.0%

Low Risk Residents with Bowel/Bladder Incontinence Info Percent of low risk long-stay residents who lose control of their bowels or bladder 16.0%
42% worse than California average

California average: 11.3%

Falls with Major Injury Info Percent of long-stay residents experiencing one or more falls with major injury 0.4%
74% better than California average

California average: 1.7%

High Risk Residents with Pressure Ulcers Info Percent of long-stay high risk residents with pressure ulcers 6.1%
24% worse than California average

California average: 5.0%

Urinary Tract Infection Info Percent of long-stay residents with a urinary tract infection 0.0%
100% better than California average

California average: 1.2%

Lost Too Much Weight Info Percent of long-stay residents who lose too much weight 5.6%
32% worse than California average

California average: 4.2%

Depressive Symptoms Info Percent of long-stay residents who have depressive symptoms 9.1%
36% worse than California average

California average: 6.7%

Antipsychotic Use Info Percent of long-stay residents who received an antipsychotic medication 4.6%
55% better than California average

California average: 10.1%

Pneumococcal Vaccine Info Percent of long-stay residents assessed and appropriately given the pneumococcal vaccine 100.0%
In line with California average

California average: 98.5%

Influenza Vaccine Info Percent of long-stay residents assessed and appropriately given the seasonal influenza vaccine 100.0%
In line with California average

California average: 98.2%

Hospitalizations per 1,000 days Info Number of hospitalizations per 1,000 long-stay resident days. 2.96
32% worse than California average

California average: 2.25

ED visits per 1,000 days Info Number of outpatient emergency department visits per 1,000 long-stay resident days. 1.04
35% better than California average

California average: 1.59

Short-stay resident measures
Pneumococcal Vaccine Info Percent of short-stay residents assessed and appropriately given the pneumococcal vaccine 99.6%
6% better than California average

California average: 94.0%

Antipsychotic medication increase Info Percent of short-stay residents who newly received an antipsychotic medication 2.8%
96% worse than California average

California average: 1.5%

Influenza Vaccine Info Percent of short-stay residents assessed and appropriately given the seasonal influenza vaccine 99.3%
6% better than California average

California average: 93.2%

Re-hospitalized after SNF stay Info Percentage of short-stay residents who were re-hospitalized after their nursing home admission. 25.6%
10% worse than California average

California average: 23.2%

Emergency department visits Info Percentage of short-stay residents who had an outpatient emergency department visit. 12.9%
15% worse than California average

California average: 11.2%

Falls with major injury Info Percentage of SNF residents who experience falls with major injury during their stay. 0.5%
35% better than California average

California average: 0.8%

Ability to care for self at discharge Info Percentage of residents at or above expected ability to care for themselves at discharge. 41.3%
23% worse than California average

California average: 53.7%

Successful return to home or community Info Rate of successful return to home or community from a skilled nursing facility. 45.9%
9% worse than California average

California average: 50.6%

Guides for Better Senior Living

Care Cost Calculator: See Prices in Your Area

Nursing Home Data Explorer

Don’t Wait Too Long: 7 Red Flag Signs Your Parent Needs Assisted Living Now

The True Cost of Assisted Living in 2025 – And How Families Are Paying For It

Understanding Senior Living Costs: Pricing Models, Discounts & Financial Assistance

Financial Aid for California Seniors

Get financial aid guidance

Multipurpose Senior Services Program

MSSP (Medi-Cal Waiver)

Age 65+, California resident, Medi-Cal eligible, nursing home risk.

~$2,829/month (300% FBR, individual).

$2,000 (individual), $3,000 (couple).

County-managed; waitlists possible.

In-Home Supportive Services (IHSS)

California IHSS

Age 65+, California resident, Medicaid-eligible or low-income.

~$1,732/month (individual, Medi-Cal threshold).

$2,000 (individual).

Can hire family as caregivers.

Multipurpose Senior Services Program (MSSP)

CA MSSP

Age 65+, California resident, Medi-Cal-eligible, nursing home-eligible but community-capable.

~$2,829/month (300% FBR, individual).

$2,000 (individual).

Available in 38 counties; waitlists common.

Property Tax Postponement Program (PTP)

CA PTP

Age 62+, California resident, own and live in home, 40% equity.

~$51,500/year (household, adjusted annually).

Equity-based; no strict asset cap.

Deferred taxes accrue interest (5% as of 2024); repaid upon sale/death.

Assisted Living Waiver (ALW)

CA ALW

Age 65+ or disabled, California resident, Medi-Cal-eligible, nursing home-eligible.

~$2,829/month (300% FBR, individual).

$2,000 (individual).

Available in 15 counties (e.g., LA, Sacramento); waitlists common.

California CARES Program

CA CARES

Caregivers of California residents 60+ needing help with 3+ daily activities; no caregiver age limit.

No strict limit; cost-sharing above ~$2,500/month threshold.

Not applicable; need-based.

High demand in urban areas; complements IHSS respite.

Low-Income Home Energy Assistance Program (LIHEAP)

CA LIHEAP

Age 60+ priority, California resident, low-income, utility/heating need.

~$2,510/month (200% of poverty level, individual).

Not applicable; income-focused.

High demand in inland/coastal extremes; weatherization capped at $5,000/home.

Who we are

Your Senior Care Partner, Every Step of the Way

We help families find affordable senior communities and unlock same day discounts, Medicaid, and Medicare options tailored to your needs.

Contact us Today
Tour Icon
Planning a tour? Check our touring checklist.
Chat Icon
Thinking of living here? We can help you speak to a current resident