


Total health inspections
6
Indiana average 6
Last Health inspection on Oct 2025


The Village at Anthony Boulevard is one campus within the Lutheran Life Villages organization, which has operated in Northeast Indiana for over 90 years. Located at 6701 S Anthony Blvd in Fort Wayne’s Anthony Wayne Village neighborhood, the 120-bed community is part of a Continuing Care Retirement Community offering nursing home, assisted living, independent living, and memory care under one umbrella. Getting around the area requires a car; the Walk Score is 17, but Alliance Health Centers – The Bridge of Grace is just over a mile away for acute needs.
Current census sits at 95 residents across 120 beds, a 60.5% occupancy rate. The average length of stay is 178 days. Medicare, Medicaid, and private pay are all accepted.
Memory care here is dedicated to residents with Alzheimer’s disease, dementia, and related conditions, offered at all-inclusive rates according to the facility. Beyond memory care, the community provides skilled nursing, assisted living, and independent living, with rehabilitation and short-term rehab supported by a therapy staff that includes speech language pathologists, physical therapy aides and assistants, occupational therapy aides and assistants, and respiratory therapy technicians. A state-approved Nurse Aide Training and Competency Evaluation Program runs on-site, and the facility participates in clinical research trials. Nursing coverage is reported at 34 minutes of RN time per resident per day, 49 minutes of LPN/LVN time, and 2 hours 47 minutes of nurse aide time, for a total of 3 hours 42 minutes daily.
The Foster Grandparents program, Senior Living Apartments, and a structured Activity Program with a monthly calendar are active named programs. Dining covers gluten-free, vegetarian, low-sugar, and low-salt options under a licensed dietician. A chapel, theater, hair salon, and transportation round out the on-campus amenities, alongside pastoral care and volunteer opportunities. A Resident Council meets on a regular basis.
State inspections have focused on areas including medication management, care planning and documentation, and resident rights and protections.
Lutheran Life Villages – The Village at Anthony Boulevard is a multi-level CCRC campus with a long institutional history in Fort Wayne, a full spectrum of care from independent living through skilled nursing and memory care, and a clinical infrastructure that extends to on-site nurse aide training and research participation. Families considering it for a relative at any stage of care need should note that the campus is car-dependent and that occupancy runs below the state average, suggesting availability is generally not a barrier to placement.
| Staff type | Hours / Day / Resident | vs state avg |
|---|---|---|
|
Registered Nurse (RN)
| 34m per day | ▼ 16% State avg: 40m per day · National avg: 41m per day |
|
LPN / LVN
| 49m per day | ▲ 8% State avg: 46m per day · National avg: 52m per day |
|
Nurse Aide
| 2h 47m per day | ▲ 23% State avg: 2h 16m per day · National avg: 2h 21m per day |
|
Weekend Total Nursing
| 3h 36m per day | ▲ 11% State avg: 3h 14m per day · National avg: 3h 26m per day |
|
Physical Therapist
| 2m per day | ▼ 38% State avg: 4m per day · National avg: 4m per day |
|
Weekend RN
| 37m per day | ▲ 37% State avg: 27m per day · National avg: 29m per day |
Key information about the people who lead and staff this community.
In Indiana, the Department of Health, Division of Long Term Care is the primary regulatory body that performs onsite inspections and quality of care reviews for all licensed facilities.
Inspection score unavailable
Not enough inspection history to generate a score.
Average score for Indiana nursing homes: B 83/100
Deficiencies
| This Facility | IN Average | vs. IN Avg |
|---|---|---|---|
|
Total deficiencies
| 11 | 36 | This facility has 69% fewer total deficiencies than a typical Indiana nursing home (11 vs. IN avg 36).↓ 69% better Rank #76 / 386 Total deficiencies — State benchmarked This home is ranked 76th out of 386 homes in Indiana. Shows this facility's deficiencies compared to the Indiana average among 386 comparable communities in the ranking pool. Rankings are based only on facilities in Indiana that report data for that category. Facilities without available data are excluded from the ranking. |
|
Deficiencies per year
| 3.7 | 12 | This facility has 69% fewer deficiencies per year than a typical Indiana nursing home (3.7 vs. IN avg 12).↓ 69% better |
Indiana average 6
Last Health inspection on Oct 2025
Indiana average 25
Indiana average 4.12
Health citations are formal notices following inspections when they fail to comply with safety and care standards.
4 of 8 citations resulted from standard inspections; and 4 of 8 resulted from complaint investigations.
Indiana average: 0.2
Indiana average: 0.6
Reporting period: October 1 – December 31, 2025 (Q4 2025). Source: CMS Payroll-Based Journal report.
Manages medical care and health needs.
Assists with medical care and medications.
Helps with daily care and mobility.
Total hours from contractors
2,087 contractor hours this quarter
| Certified Nursing Assistant | 45 | 0 | 45 | 17,846 | 92 | 100% | 7.8 |
| Medication Aide/Technician | 17 | 0 | 17 | 5,856 | 92 | 100% | 7.7 |
| Licensed Practical Nurse | 14 | 0 | 14 | 5,280 | 92 | 100% | 7.3 |
| Registered Nurse | 9 | 0 | 9 | 3,565 | 92 | 100% | 8.6 |
| RN Director of Nursing | 5 | 0 | 5 | 1,850 | 91 | 99% | 8.1 |
| Other Dietary Services Staff | 3 | 0 | 3 | 1,418 | 77 | 84% | 7.7 |
| Clinical Nurse Specialist | 2 | 0 | 2 | 843 | 66 | 72% | 7.9 |
| Administrator | 2 | 0 | 2 | 833 | 60 | 65% | 7.5 |
| Dental Services Staff | 2 | 0 | 2 | 719 | 62 | 67% | 6.8 |
| Speech Language Pathologist | 0 | 4 | 4 | 716 | 65 | 71% | 5.5 |
| Nurse Practitioner | 1 | 0 | 1 | 458 | 61 | 66% | 7.5 |
| Dietitian | 1 | 0 | 1 | 428 | 57 | 62% | 7.5 |
| Nurse Aide in Training | 8 | 0 | 8 | 382 | 19 | 21% | 6 |
| Respiratory Therapy Technician | 0 | 3 | 3 | 355 | 62 | 67% | 5.4 |
| Physical Therapy Aide | 0 | 2 | 2 | 344 | 69 | 75% | 4.3 |
| Physical Therapy Assistant | 0 | 1 | 1 | 316 | 62 | 67% | 5.1 |
| Qualified Social Worker | 0 | 2 | 2 | 174 | 62 | 67% | 2.8 |
| Occupational Therapy Aide | 0 | 1 | 1 | 113 | 26 | 28% | 4.3 |
| Occupational Therapy Assistant | 0 | 4 | 4 | 40 | 34 | 37% | 1.1 |
| Medical Director | 0 | 1 | 1 | 29 | 13 | 14% | 2.3 |
Federal penalties imposed by CMS for regulatory violations, including civil money penalties (fines) and denials of payment for new Medicare/Medicaid admissions.
Source: CMS Penalties Database
No penalties in the past 3 years
No civil money penalties or payment denials were reported in the last 3 years.
These measures show how residents usually do over time at this home, based on health outcomes and preventive care.
Indiana average: 8.0
Indiana average: 17.1
Indiana average: 12.0%
Indiana average: 14.4%
Indiana average: 24.6%
Indiana average: 3.9%
Indiana average: 4.4%
Indiana average: 1.2%
Indiana average: 5.7%
Indiana average: 24.1%
Indiana average: 12.4%
Indiana average: 93.7%
Indiana average: 95.4%
Indiana average: 1.60
Indiana average: 1.48
Indiana average: 81.7%
Indiana average: 1.4%
Indiana average: 79.0%
Indiana average: 22.4%
Indiana average: 10.5%
Indiana average: 0.8%
Indiana average: 53.7%
Indiana average: 50.6%
Quality measures are calculated from Minimum Data Set (MDS) assessments. For most measures, lower percentages indicate better care quality.
11% of new residents, usually for short-term rehab.
79% of new residents, often for short stays.
10% of new residents, often for long-term daily care.
Source: CMS Long-Term Care Facility Characteristics (Data as of Jan 2026)
Residents meet regularly to discuss policies, care quality, and activities
State-approved Nurse Aide Training and Competency Evaluation Program on-site
Conducts clinical research trials to develop and test new treatments
Part of a Continuing Care Retirement Community offering multiple care levels
Organized group of residents that meets regularly to discuss facility policies, quality of life, and activities.
Data sourced from CMS Long-Term Care Facility Characteristics quarterly report. Payer mix reflects the current resident census by primary payment source.
Historical financial and operational data for Lutheran Life Villages – The Village at Anthony Boulevard from 2012–2023, based on CMS SNF Cost Reports.
Based on CMS SNF Cost Report for fiscal year ending in 12/2023.
Residents typically stay for brief periods, with frequent admissions and discharges throughout the year.
Most new residents arrive under private pay (79% of admissions), and a typical private pay stay runs around 7 months.
Coverage residents most often arrive under.
Coverage residents most often leave under.
![]() 4.8 miles from city center
4.8 miles from city center
![]() Estimated distance in miles from Fort Wayne's city center to Lutheran Life Villages – The Village at Anthony Boulevard's address, calculated via Google Maps.
Estimated distance in miles from Fort Wayne's city center to Lutheran Life Villages – The Village at Anthony Boulevard's address, calculated via Google Maps.
Add your location
The information below is reported by the Indiana Department of Health, Division of Long Term Care.
| Coventry Meadows Assisted Living | NH AL MC RC | Fort Wayne | 150
Facility
150
IN AVG
116
Rank
#87 / 437 |
84.7%
Facility
84.7%
IN AVG
69.4%
Rank
#66 / 434 | +22% | 3.17
Facility
3.17
IN AVG
3.44
Rank
#172 / 291 | -7% | -8% | $0
Facility
$0
IN AVG
$31.4k
Rank
#1 / 293 | 88
Facility
88
IN AVG
83
Rank
#99 / 384 | 5
Facility
5
IN AVG
25.0
Rank
#11 / 292 | 1.3
Facility
1.3
IN AVG
4.1
Rank
#6 / 292 | - | 124 | A+ |
17
Facility
17
IN AVG
37
Rank
#410 / 587 | Greggory Fuller | $15.0M
Facility
$15.0M
IN AVG
$10.7M
Rank
#32 / 294 | $7.5M
Facility
$7.5M
IN AVG
$4.2M
Rank
#45 / 294 | 50.3%
Facility
50.3%
IN AVG
42%
Rank
#220 / 294 | 155756 | ||||
| Majestic Care of Fort Wayne | NH HC MC RC | Fort Wayne (Lake Shores) | 70
Facility
70
IN AVG
116
Rank
#351 / 437 |
98.6%
Facility
98.6%
IN AVG
69.4%
Rank
#3 / 434 | +42% | 2.13
Facility
2.13
IN AVG
3.44
Rank
#290 / 291 | -36% | -38% | $0
Facility
$0
IN AVG
$31.4k
Rank
#1 / 293 | 84
Facility
84
IN AVG
83
Rank
#140 / 384 | 8
Facility
8
IN AVG
25.0
Rank
#26 / 292 | 1.3
Facility
1.3
IN AVG
4.1
Rank
#6 / 292 | 1 | 68 | A+ |
23
Facility
23
IN AVG
37
Rank
#375 / 587 | Majestic Care Of Fort Wayne LLC | $9.3M
Facility
$9.3M
IN AVG
$10.7M
Rank
#172 / 294 | $3.0M
Facility
$3.0M
IN AVG
$4.2M
Rank
#238 / 294 | 32.2%
Facility
32.2%
IN AVG
42%
Rank
#286 / 294 | 155359 | ||||
| Englewood Health and Rehabilitation Center | NH AL MC | Fort Wayne (Sand Point) | 64
Facility
64
IN AVG
116
Rank
#368 / 437 |
84.4%
Facility
84.4%
IN AVG
69.4%
Rank
#67 / 434 | +22% | 3.86
Facility
3.86
IN AVG
3.44
Rank
#58 / 291 | -22% | +12% | $0
Facility
$0
IN AVG
$31.4k
Rank
#1 / 293 | 80
Facility
80
IN AVG
83
Rank
#194 / 384 | 6
Facility
6
IN AVG
25.0
Rank
#17 / 292 | 1.2
Facility
1.2
IN AVG
4.1
Rank
#5 / 292 | - | 55 | - |
50
Facility
50
IN AVG
37
Rank
#205 / 587 | Riverview Hospital | $7.0M
Facility
$7.0M
IN AVG
$10.7M
Rank
#214 / 294 | $3.4M
Facility
$3.4M
IN AVG
$4.2M
Rank
#239 / 294 | 48.4%
Facility
48.4%
IN AVG
42%
Rank
#210 / 294 | 155654 | ||||
| Canterbury Nursing and Rehabilitation Center | NH HC MC RC | Fort Wayne | 142
Facility
142
IN AVG
116
Rank
#105 / 437 |
78.9%
Facility
78.9%
IN AVG
69.4%
Rank
#105 / 434 | +14% | 3.06
Facility
3.06
IN AVG
3.44
Rank
#188 / 291 | +51% | -11% | $0
Facility
$0
IN AVG
$31.4k
Rank
#1 / 293 | 76
Facility
76
IN AVG
83
Rank
#241 / 384 | 14
Facility
14
IN AVG
25.0
Rank
#66 / 292 | 2.3
Facility
2.3
IN AVG
4.1
Rank
#40 / 292 | - | 110 | A+ |
62
Facility
62
IN AVG
37
Rank
#131 / 587 | Meeta Anand | $11.4M
Facility
$11.4M
IN AVG
$10.7M
Rank
#102 / 294 | $6.2M
Facility
$6.2M
IN AVG
$4.2M
Rank
#86 / 294 | 55%
Facility
55%
IN AVG
42%
Rank
#148 / 294 | 155656 | ||||
| Lutheran Life Villages – The Village at Anthony Boulevard | NH AL IL MC | Fort Wayne (Anthony Wayne Village) | 120
Facility
120
IN AVG
116
Rank
#167 / 437 |
60.5%
Facility
60.5%
IN AVG
69.4%
Rank
#273 / 434 | -13% | 3.69
Facility
3.69
IN AVG
3.44
Rank
#72 / 291 | -28% | +7% | $0
Facility
$0
IN AVG
$31.4k
Rank
#1 / 293 | - | 8
Facility
8
IN AVG
25.0
Rank
#26 / 292 | 1.3
Facility
1.3
IN AVG
4.1
Rank
#6 / 292 | - | 94 | A+ |
17
Facility
17
IN AVG
37
Rank
#410 / 587 | Alexander Kiefer | $13.4M
Facility
$13.4M
IN AVG
$10.7M
Rank
#38 / 294 | $9.0M
Facility
$9.0M
IN AVG
$4.2M
Rank
#25 / 294 | 66.8%
Facility
66.8%
IN AVG
42%
Rank
#122 / 294 | 155586 |
Lutheran Life Villages – The Village at Anthony Boulevard is located in Fort Wayne, Indiana.
Here are the financial assistance programs available to residents in Indiana.
Lutheran Life Villages – The Village at Anthony Boulevard is in the Anthony Wayne Village neighborhood of Fort Wayne.
Lutheran Life Villages – The Village at Anthony Boulevard has a walk score of 17. Car-dependent. Most errands require a car, with limited nearby walkable options.
Lutheran Life Villages – The Village at Anthony Boulevard's occupancy is 60.5%.
Lutheran Life Villages – The Village at Anthony Boulevard is registered as a non-profit in IN.
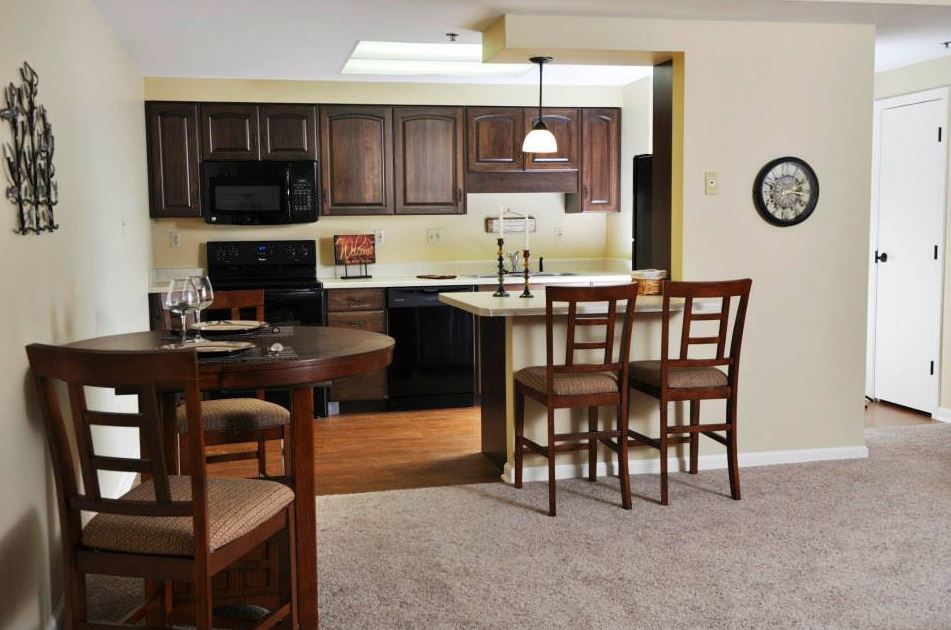
Yes — there are 4 photos of Lutheran Life Villages – The Village at Anthony Boulevard in the photo gallery on this page.
Lutheran Life Villages – The Village at Anthony Boulevard is located at 6701 S Anthony Blvd, Fort Wayne, IN 46816.
(260) 619-6574 will put you in contact with the team at Lutheran Life Villages – The Village at Anthony Boulevard.
Care Cost Calculator: See Prices in Your Area
Nursing Home Data Explorer
Don’t Wait Too Long: 7 Red Flag Signs Your Parent Needs Assisted Living Now
The True Cost of Assisted Living in 2025 – And How Families Are Paying For It
Understanding Senior Living Costs: Pricing Models, Discounts & Financial Assistance


