Lutheran Village at Miller’s Grant
Nursing Home, Assisted Living & Independent Living · Ellicott City, MD
CMS overall rating Info CMS (the Centers for Medicare & Medicaid Services) is the federal agency that rates nursing home quality. Its Overall Rating runs from 1 to 5 stars, combining health inspections, staffing, and quality measures, with inspections weighted most heavily.

Lutheran Village at Miller’s Grant

Nursing Home, Assisted Living & Independent Living · Ellicott City, MD
CMS overall rating Info CMS (the Centers for Medicare & Medicaid Services) is the federal agency that rates nursing home quality. Its Overall Rating runs from 1 to 5 stars, combining health inspections, staffing, and quality measures, with inspections weighted most heavily.
Calculator: See prices in your area
Lutheran Village at Miller’s Grant accepts Medicare and private pay.

Overview of Lutheran Village at Miller’s Grant

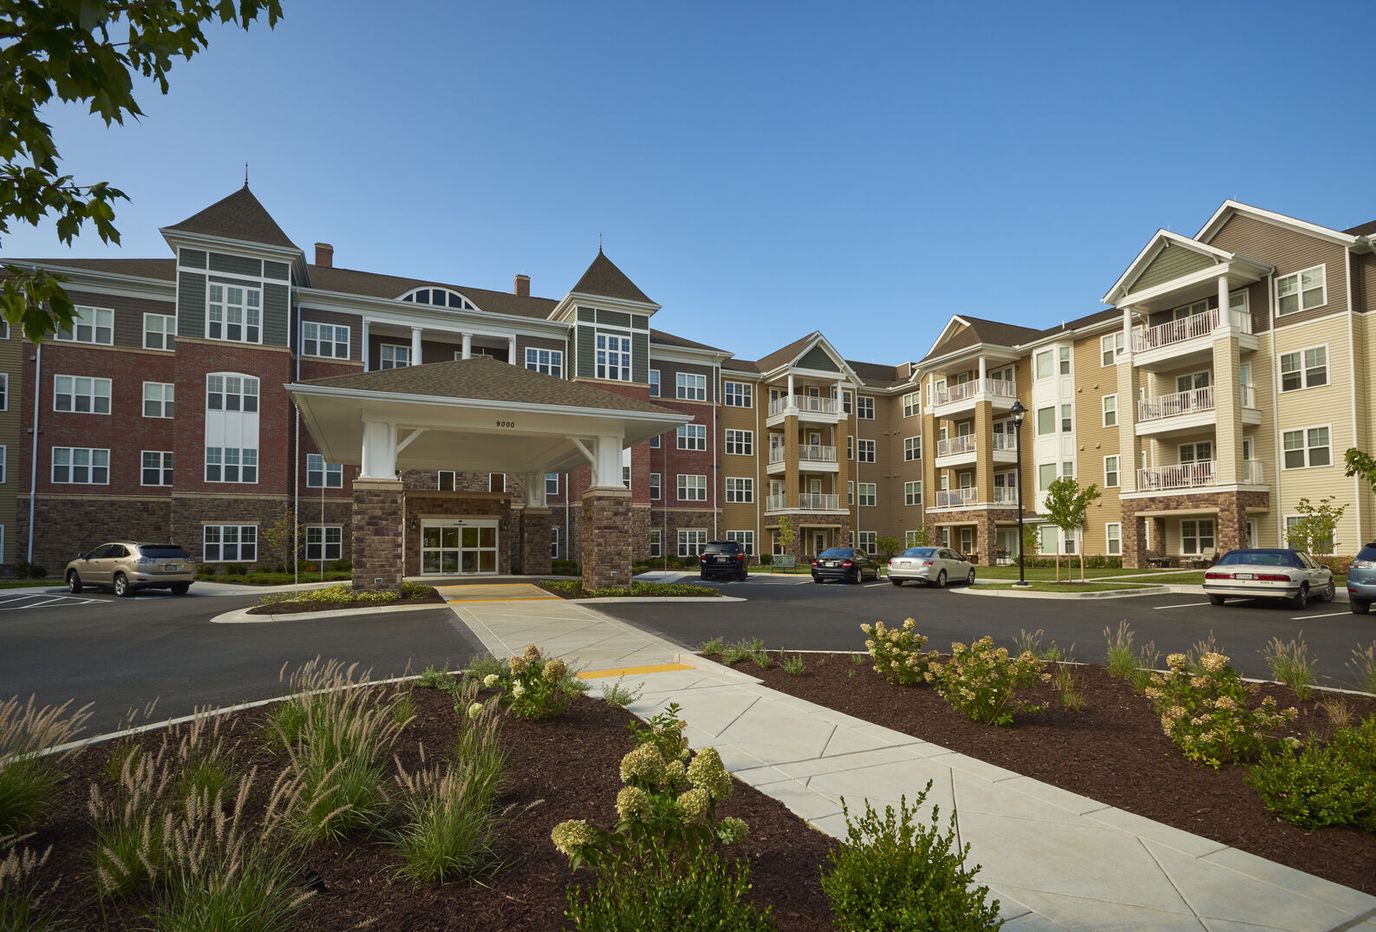
Enjoy your best years at Lutheran Village at Miller’s Grant, an idyllic retreat in Ellicott City, MD, offering independent living, assisted living, short- and long-term care. The community strives to provide the utmost comfort and safety with beautifully furnished and cozy accommodations. Here, residents have a worry-free lifestyle with plenty of maintenance services and convenient apartment features.

Residents can spend their days as they please with a thoughtfully curated calendar of engaging activities and enriching programs. With multiple dining venues, residents enjoy delectable and healthy meals that cater to their dietary needs and preferences. Scheduled transportation is also provided for residents’ convenience. This pet-friendly community is a great option for those seeking independence in retirement, especially with its warm and inviting environment.

Quality ratings

Measured by Centers for Medicare & Medicaid Services (CMS)

Overall rating Info The Overall CMS Rating combines results from health inspections, staffing levels and quality measures. Health inspections carry the most weight. Staffing and quality scores can increase or decrease the final rating based on performance compared to state and national standards.
▲ 64.4% Above MD avg. ▲ 64.4% Above MD avg.MD average: 3.0Click the badge to see the full State ranking.Click here to see the full State ranking.
Health Inspection Info Based on the results of the facility's three most recent standard inspections and any complaint investigations. CMS reviews the number, scope, and severity of deficiencies, with more recent findings weighted more heavily.
▲ 77.5% Above MD avg. ▲ 77.5% Above MD avg.MD average: 2.8Click the badge to see the full State ranking.Click here to see the full State ranking.
Staffing Info Measures average nursing staff hours per resident per day, including Registered Nurses (RNs) and total nursing staff. Ratings are adjusted based on the level of care residents require and are compared to state and national benchmarks.
▲ 64.2% Above MD avg. ▲ 64.2% Above MD avg.MD average: 3.0Click the badge to see the full State ranking.Click here to see the full State ranking.
Quality Measures Info Based on clinical and physical health indicators reported to CMS, such as hospital readmissions, falls, pressure ulcers, and improvements in mobility. These measures reflect how well residents' health needs are being managed.
▼ 18.8% Below MD avg. ▼ 18.8% Below MD avg.MD average: 3.7Click the badge to see the full State ranking.Click here to see the full State ranking.

Staffing hours breakdown

Info Daily nursing hours per resident by staff type, reported to CMS. Higher is generally better — compare this facility to state and national averages to see where staffing stands.

Hours per resident per day — compared to Maryland state averages

Total nursing care / resident Info Total adjusted nursing hours per resident per day, combining RN, LPN, and aide time. CMS adjusts this for case-mix so facilities can be fairly compared.
6h 35m per day
This facility Maryland avg (3h 46m per day)
vs Maryland avg
+74%

1 of 6 metrics below state avg

Standout metric Physical Therapist is +271% above state avg
Staff typeHours / Day / Residentvs state avg
Registered Nurse (RN) Info RNs hold the highest nursing license and can assess residents, interpret test results, and direct care plans. More RN hours per day often signals stronger clinical oversight and faster response to health changes. 1h 27m per day ▲ 77% State avg: 49m per day · National avg: 41m per day
LPN / LVN Info Licensed Practical Nurses (LPNs) or Licensed Vocational Nurses (LVNs) deliver routine hands-on care — medication administration, wound dressing, and monitoring vital signs. They work under RN supervision and make up a large share of daily bedside care. 45m per day ▼ 17% State avg: 55m per day · National avg: 52m per day
Nurse Aide Info Certified Nurse Aides (CNAs) provide the most direct day-to-day assistance: bathing, dressing, feeding, and mobility. Nurse aide hours are typically the largest staffing category and directly affect residents' quality of life. 3h 31m per day ▲ 65% State avg: 2h 8m per day · National avg: 2h 20m per day
Weekend Total Nursing Info Combined nursing hours (RN + LPN + Nurse Aide) per resident per day on weekends. Staffing often drops on weekends — this figure reveals whether the facility maintains adequate coverage outside of weekday hours. 4h 56m per day ▲ 41% State avg: 3h 31m per day · National avg: 3h 27m per day
Physical Therapist Info Hours per resident per day provided by licensed Physical Therapists (PTs) or PT Assistants. PT services help residents recover mobility after injury or illness and are especially important for post-acute (short-stay) rehabilitation. 22m per day ▲ 271% State avg: 6m per day · National avg: 4m per day
Weekend RN Info Registered nurse hours specifically on weekends. Facilities sometimes reduce RN presence on Saturdays and Sundays — a low weekend RN figure compared to weekday hours can indicate reduced clinical oversight when most administrative staff are absent. 1h 5m per day ▲ 77% State avg: 37m per day · National avg: 29m per day

Capacity and availability

Avg. Length of Stay
234 days
Bed community size
36-bed community Rank #244 / 697Bed count — State benchmarkedThis home is ranked 244th out of 697 homes in Maryland. Shows this facility's certified or reported bed count compared to other Maryland facilities. Larger communities may offer more amenities, programs, and on-site services for residents and families.Rankings are based only on facilities in Maryland that report data for that category. Facilities without available data are excluded from the ranking.Click the rank badge to see the full State ranking.Click here to see the full State ranking.
A moderately sized community that may balance personal attention with shared amenities and social activities.
Years in operation
21 years in operation Rank #107 / 208Years in operation — State benchmarkedThis home is ranked 107th out of 208 homes in Maryland. Shows how long this facility has been in operation compared to other Maryland facilities. Longer operating histories may benefit residents, families, and staff.Rankings are based only on facilities in Maryland that report data for that category. Facilities without available data are excluded from the ranking.Click the rank badge to see the full State ranking.Click here to see the full State ranking.
A longer operating history, which may indicate experience navigating regulations and delivering ongoing care.
Walk Score
Walk Score: 19 / 100 Rank #746 / 985Walk Score — State benchmarkedThis home is ranked 746th out of 985 homes in Maryland. Shows how walkable this facility's neighborhood is compared to the average Walk Score across Maryland facilities. Higher scores benefit residents, families, and staff.Rankings are based only on facilities in Maryland that report data for that category. Facilities without available data are excluded from the ranking.Click the rank badge to see the full State ranking.Click here to see the full State ranking.
Car-dependent. Most errands require a car, with limited nearby walkable options.

About this community

Occupancy

Occupancy rate
60%
Similar to the Maryland average: 60%
Occupied beds
21 / 36
Average occupied beds in Maryland homes 104 beds

Awards

Best of Howard for Retirement Living

License Details

Facility TypeAl
CountyHoward
CMS Certification Number215363

Ownership & Operating Entity

Profit StatusNonprofit
Nonprofit OwnershipYes

Room costs

Private Room $331 - $373 per day
Semi-Private Room $344 - $388 per day

Safety & Compliance

Safety Features24/7 campus security.

Hospice Affiliations

Gilchrist Hospice Care

Staffing

Key information about the people who lead and staff this community.

Leadership

CNA Training Program
ContactMs. Paula Oneill, Executive Director

Payment & Insurance

1 service
Accept Medicare

Therapy & Rehabilitation

2 services
Rehabilitation Services
Respite Care

Staffing & Medical

1 service
24-Hour Staffing

Memory & Specialized Care

3 services
No mild Alzheimer's level
Moderate Alzheimer's Level
Severe Alzheimer's Level

Additional Policies & Features

Continuing Care Retirement Community (CCRC)

Amenities & Lifestyle

ActivitiesEngagement in activities such as happy hour, music activities, exercise classes, game night, and cooking
Branded ProgramsFlourish™ Senior Wellness
Religious ServicesChaplaincy services available
Volunteer Program

Dining & Nutrition

Food DescriptionChef-prepared dining with casual and formal dining venues.

Contact Lutheran Village at Miller’s Grant

Health Inspection History

Inspections since 2022
Total health inspections 2

Maryland average 3.9


Last Health inspection on Jun 2025

Total health citations
14 Rank #5 / 149Health citations — State benchmarkedThis home is ranked 5th out of 149 homes in Maryland. Shows this facility's total health deficiency citations benchmarked to the Maryland State average, with a ranking across all 149 MD facilities. Lower citation counts earn a better rank.Rankings are based only on facilities in Maryland that report data for that category. Facilities without available data are excluded from the ranking.Click the rank badge to see the full State ranking.Click here to see the full State ranking.

Maryland average 49.9

Citations per inspection
7

Maryland average 12.81


Health citations are formal notices following inspections when they fail to comply with safety and care standards.

All 14 citations resulted from standard inspections.

Breakdown of citation severity (last 4 years)
Critical health citations
0
100% better than Maryland average

Maryland average: 0.5


Serious health citations
0
100% better than Maryland average

Maryland average: 0.6

0 critical citations Maryland average: 0.5

0 serious citations Maryland average: 0.6

13 moderate citations Maryland average: 47.2

1 minor citation Maryland average: 1.7
Citations history (last 4 years)
Nursing Services moderate citation Jun 26, 2025
Corrected

Nutrition moderate citation Jun 26, 2025
Corrected

Care Planning moderate citation Jun 26, 2025
Corrected

Abuse/Neglect moderate citation Sep 02, 2022
Corrected

Demographics

Resident demographic information for this facility.

Gender

  • Female 83.3%
  • Male 16.7%

Age Distribution

  • 85-94 44.4%
  • 75-84 33.3%
  • 95+ 22.2%

Ethnicity

  • White 83.3%
  • African American 11.1%
  • Asian 5.6%

Infection Prevention & Vaccination

How this facility protects residents through staff vaccination policies and immunization practices.

Influenza Gold Star

Awarded by the Maryland Health Care Commission (MHCC) to healthcare facilities that achieve a high influenza vaccination rate.

Mandatory Vaccination Policy

The facility requires certain vaccinations for staff as part of its infection prevention measures.

Staffing Data

Reporting period: October 1 – December 31, 2025 (Q4 2025). Source: CMS Payroll-Based Journal report.

Total staff 51
Employees 50
Contractors 1
Staff to resident ratio 5.10 : 1
181% more staff per resident than Maryland average
Maryland average ratio: 1.81 : 1 Maryland average ratio: 1.81 : 1See full Maryland ranking
Avg staff/day 14
Average shift 7.3 hours
9% worse than Maryland average
Maryland average: 8 hours Maryland average shift: 8 hoursSee full Maryland ranking
Total staff hours (quarter) 9,425

Nursing staff breakdown

Q4 2025 · Oct 1 – Dec 31 More info This data comes from the CMS Payroll-Based Journal report covering October 1 – December 31, 2025.
Registered Nurse

Manages medical care and health needs.

RN Staff Info 6 total: 5 full-time employees and 1 contractor. 6
Average shift length Info Average shift length. Calculated as total hours divided by days worked and average staff per day. 10.8 hours
Licensed Practical Nurse

Assists with medical care and medications.

LPN Staff Info All 7 LPN Staff are full-time employees. No contractors work on this role. 7
Average shift length Info Average shift length. Calculated as total hours divided by days worked and average staff per day. 7.8 hours
Certified Nursing Assistant

Helps with daily care and mobility.

CNA Staff Info All 14 CNA Staff are full-time employees. No contractors work on this role. 14
Average shift length Info Average shift length. Calculated as total hours divided by days worked and average staff per day. 7.3 hours

Contractor staffing

Q4 2025 · Oct 1 – Dec 31 More info This data comes from the CMS Payroll-Based Journal report covering October 1 – December 31, 2025.

Total hours from contractors

4.5%

421 contractor hours this quarter

Registered Nurse: 1

Staff by category

Q4 2025 · Oct 1 – Dec 31 More info This data comes from the CMS Payroll-Based Journal report covering October 1 – December 31, 2025.
Certified Nursing Assistant140144,28192100%7.3
Registered Nurse5161,33992100%10.8
Licensed Practical Nurse7079628289%7.8
Nurse Practitioner1015126470%8
Administrator1014956672%7.5
Other Dietary Services Staff1014796571%7.4
Speech Language Pathologist2024746267%5.4
Respiratory Therapy Technician5054595863%5
Physical Therapy Assistant4042036166%3.3
Nurse Aide in Training8081932729%6.2
Qualified Social Worker1012289%2.7
Medication Aide/Technician101822%3.9
14 Certified Nursing Assistant
% of Days 100%
6 Registered Nurse
% of Days 100%
7 Licensed Practical Nurse
% of Days 89%
1 Nurse Practitioner
% of Days 70%
1 Administrator
% of Days 72%
1 Other Dietary Services Staff
% of Days 71%
2 Speech Language Pathologist
% of Days 67%
5 Respiratory Therapy Technician
% of Days 63%
4 Physical Therapy Assistant
% of Days 66%
8 Nurse Aide in Training
% of Days 29%
1 Qualified Social Worker
% of Days 9%
1 Medication Aide/Technician
% of Days 2%

Penalties and fines

Federal penalties imposed by CMS for regulatory violations, including civil money penalties (fines) and denials of payment for new Medicare/Medicaid admissions.

Source: CMS Penalties Database

No penalties in the past 3 years

No civil money penalties or payment denials were reported in the last 3 years.

Quality of care over time

These measures show how residents usually do over time at this home, based on health outcomes and preventive care.

High-risk clinical events score Info A composite score based on pressure ulcers, falls with injury, weight loss, walking ability decline, and activities of daily living decline. 6.6
49% better than Maryland average

Maryland average: 12.9

Functional decline score Info A composite score based on activities of daily living decline, walking ability decline, and incontinence. 12.4
52% better than Maryland average

Maryland average: 25.7

Long-stay resident measures
Need for Help with Daily Activities Increased Info Percent of long-stay residents whose need for help with daily activities has increased 16.7%
30% better than Maryland average

Maryland average: 23.7%

Low Risk Residents with Bowel/Bladder Incontinence Info Percent of low risk long-stay residents who lose control of their bowels or bladder 8.0%
69% better than Maryland average

Maryland average: 25.9%

Falls with Major Injury Info Percent of long-stay residents experiencing one or more falls with major injury 0.0%
100% better than Maryland average

Maryland average: 2.3%

High Risk Residents with Pressure Ulcers Info Percent of long-stay high risk residents with pressure ulcers 3.1%
53% better than Maryland average

Maryland average: 6.5%

Urinary Tract Infection Info Percent of long-stay residents with a urinary tract infection 5.3%
228% worse than Maryland average

Maryland average: 1.6%

Depressive Symptoms Info Percent of long-stay residents who have depressive symptoms 0.0%
100% better than Maryland average

Maryland average: 20.2%

Antipsychotic Use Info Percent of long-stay residents who received an antipsychotic medication 35.9%
177% worse than Maryland average

Maryland average: 12.9%

Pneumococcal Vaccine Info Percent of long-stay residents assessed and appropriately given the pneumococcal vaccine 100.0%
9% better than Maryland average

Maryland average: 92.0%

Short-stay resident measures
Pneumococcal Vaccine Info Percent of short-stay residents assessed and appropriately given the pneumococcal vaccine 94.1%
20% better than Maryland average

Maryland average: 78.4%

Antipsychotic medication increase Info Percent of short-stay residents who newly received an antipsychotic medication 8.3%
500% worse than Maryland average

Maryland average: 1.4%

Breakdown by payment type

Medicare

37% of new residents, usually for short-term rehab.

Typical stay 11 days

Private pay

63% of new residents, often for short stays.

Typical stay 2 - 3 years

Facility Characteristics

Source: CMS Long-Term Care Facility Characteristics (Data as of Jan 2026)

Total residents 10
Medicaid
2
20% of residents
Private pay or other
8
80% of residents
Programs & Services
Residents Group

Residents meet regularly to discuss policies, care quality, and activities

CCRC

Part of a Continuing Care Retirement Community offering multiple care levels

Active Resident Council

Organized group of residents that meets regularly to discuss facility policies, quality of life, and activities.

Finances and operations

Based on CMS SNF Cost Report for fiscal year ending in 06/2024.

Nonprofit
Nonprofit Corporation
Net patient revenue Info Net patient revenue — what the home actually collects for resident care, after contractual allowances, bad debt and discounts are subtracted from its gross charges (CMS cost report, Worksheet G-3). It covers resident care only; money the home earns from other sources is shown separately as "Other income."
$23.7M
Net patient income Info Net patient income: net patient revenue minus the home's total operating expenses. A positive figure means it earns more from resident care than it spends to deliver it; a negative figure means the opposite. It excludes non-operating "other income."
-$1.2M
Nonprofit Nonprofit Corporation
Net patient revenue Info Net patient revenue — what the home actually collects for resident care, after contractual allowances, bad debt and discounts are subtracted from its gross charges (CMS cost report, Worksheet G-3). It covers resident care only; money the home earns from other sources is shown separately as "Other income."
$23.7M
Net patient income Info Net patient income: net patient revenue minus the home's total operating expenses. A positive figure means it earns more from resident care than it spends to deliver it; a negative figure means the opposite. It excludes non-operating "other income."
-$1.2M
Other income Info Money the home earns outside of resident care — such as investments, grants, rentals and other non-operating sources (CMS cost report, Worksheet G-3). It is tracked separately from net patient revenue: it is not part of that figure, and it is not included in net patient income.
$6.1M
Payroll costs Info Staff salaries plus wage-related costs — benefits such as payroll taxes, health insurance and retirement — from the home's own accounting records (CMS cost report, Worksheet A). Contract or agency labor is counted separately, under other operating costs.
$6.9M 29% of net patient revenue Info Payroll as a share of revenue: staff salaries and wage-related benefits divided by net patient revenue. A higher figure means more of each revenue dollar goes to staff pay. Rank #148 / 148Payroll % — State benchmarkedThis home is ranked 148th out of 148 homes in Maryland. Shows payroll as a percentage of revenue versus the Maryland average. Well-run Maryland facilities typically land around 49–57% — the top third Statewide. Below 25% may signal understaffing or heavy agency use — read with Staffing ratings.Rankings are based only on facilities in Maryland that report data for that category. Facilities without available data are excluded from the ranking.Click the rank badge to see the full State ranking.Click here to see the full State ranking.
Other operating costs Info Everything it costs to run the home apart from payroll — food, utilities, supplies, maintenance, contract labor and administration. Calculated as total operating expense minus payroll (staff salaries and wage-related benefits).
$18.1M
Total costs Info The home's total operating expense for the year — all the costs of running it, salaries included (CMS cost report, Worksheet G-3).
$24.9M

What does this home offer?

Pets allowed icon
Pets allowed icon

Pets Allowed

Housing options icon

Housing Options: 1 Bed / 2 Bed

Building type icon
Building type icon

Building Type: Mid-rise

Transportation services icon

Transportation Services

Social and recreational activities icon

Social and Recreational Activities

Exercise program icon

Exercise Programs

Parking Available icon

Parking Available

Who this home usually serves

TYPE OF STAY

Primarily short stays

Residents typically stay for brief periods, with frequent admissions and discharges throughout the year.

Most new residents arrive under private pay (63% of admissions), and a typical private pay stay runs around 2 - 3 years.

Admissions
19 total

Coverage residents most often arrive under.

Medicare 37%
Private pay 63%
Discharges
29 total

Coverage residents most often leave under.

Medicare 28%
Private pay 67%
Medicaid 6%

Living Spaces & Floor Plans for Lutheran Village at Miller’s Grant

Dayton V Two Bedroom
Download PDF
Oakland II One Bedroom
Download PDF
Oakland One Bedroom
Download PDF
Snowden One Bedroom
Download PDF

Places of interest near Lutheran Village at Miller’s Grant

Address 2.8 miles from city center Info Estimated distance in miles from Ellicott City's city center to Lutheran Village at Miller’s Grant's address, calculated via Google Maps.

Calculate Travel Distance to Lutheran Village at Miller’s Grant

Add your location

Address

Compare Assisted Living around Ellicott City

The information below is reported by the Maryland Department of Health, Office of Health Care Quality.

Lutheran Village at Miller’s Grant
AL
IL
NH
Ellicott City (Lutheran Village At Miller’s Grant) -
36
Facility 36
MD AVG 43
Rank #244 / 697
-
19
Facility 19
MD AVG 43
Rank #746 / 985
1 Bed / 2 Bed
HeartLands Senior Living at Ellicott City
AL
NH
IL
Ellicott City (Plum Tree) -
182
Facility 182
MD AVG 43
Rank #17 / 697
-
14
Facility 14
MD AVG 43
Rank #788 / 985
Studio / 1 Bed / 2 Bed

Financial Assistance for
Assisted Living in Maryland

Lutheran Village at Miller’s Grant is located in Ellicott City, Maryland.
Here are the financial assistance programs available to residents in Maryland.

Get Financial aid guidance

Community Options Waiver

Maryland Medicaid Community Options Waiver

Age 65+ or disabled
General Maryland resident, Medicaid- eligible, nursing home-level care need.
Income Limits (2025) ~$2,829/month 300% FBR, individual
Asset Limits $2,000 (individual), $3,000 (couple) (excludes home, car).
MD

High urban demand; rural outreach efforts.

Benefits
Personal care (5-7 hours/day, e.g., bathing, dressing) Respite care (up to 240 hours/year) Adult day care ($70/day) Home modifications ($1,500 avg.)

Senior Care Program

Maryland Senior Care

Age 65+
General Maryland resident, at risk of nursing home placement.
Income Limits ~$2,000/month individual, varies by county
Asset Limits $11,000 individual
MD

Limited funding; waitlists common in high-demand areas.

Benefits
In-home care (3-5 hours/week) Respite care (up to 10 days/year) Meals (~$6/meal) Transportation (~5 trips/month) Case management

Maryland Nursing Home Medicaid

Maryland Medical Assistance (Medicaid) Nursing Home Program

Age 65+
General Maryland resident, Medicaid-eligible, requires nursing home-level care.
Income Limits (2025) $943/month (individual); most income applied to care costs.
Asset Limits $2,500 (individual), $3,000 (couple); spousal protections up to $155,356.
MD

Home equity limit $636,000; estate recovery applies post-55.

Benefits
24/7 nursing care Meals Therapy Medications (unlimited per medical need)

Senior Assisted Living Subsidy Program

Maryland Senior Assisted Living Group Home Subsidy

Age 62+
General Maryland resident, in or moving to approved assisted living, low/moderate income.
Income Limits (2025) ~$34,000/year individual, varies by county
Asset Limits Not strict; prioritizes low-income.
MD

Not available statewide; facility must be licensed by MDH.

Benefits
Personal care Meals 24-hour supervision (up to $1,500/month subsidy typical)

Veterans Aid and Attendance (A&A) Benefit

Maryland VA Aid and Attendance

Age
General Wartime veteran/spouse, age 65+ or disabled, needs ADL help, Maryland resident.
Income Limits (2025) Net income minus medical expenses < $1,984/month individual with A&A
Asset Limits $155,356 net worth limit
MD

High veteran population in suburban/rural areas.

Benefits
Cash benefit ($1,478-$2,471/month, varies by status) for care costs

Senior Prescription Drug Assistance Program (SPDAP)

Maryland Senior Prescription Drug Assistance Program

Age 65+
General Maryland resident (6+ months), Medicare Part D enrolled.
Income Limits (2025) $48,560/year individual, 300% FPL
Asset Limits None specified.
MD

Supplements Medicare Part D; annual enrollment required.

Benefits
Up to $40/month premium subsidy Reducing drug costs

Medicare Savings Programs (MSP)

Maryland Medicare Savings Programs

Age 65+
General Maryland resident, Medicare Part A/B enrollee.
Income Limits (2025) $2,014/month (QMB), $2,706/month (SLMB/QI, individual).
Asset Limits $9,090 (individual), $13,630 (couple).
MD

Includes QMB, SLMB, QI categories.

Benefits
Covers premiums (up to $174.70/month Part B) Co-pays Deductibles

Community Personal Assistance Services (CPAS)

Maryland Medicaid Community Personal Assistance Services

Age 65+
General Maryland resident, Medicaid-eligible, needs ADL assistance.
Income Limits (2025) $943/month (individual); spend-down available.
Asset Limits $2,500 (individual), $3,000 (couple).
MD

Consumer-directed option allows hiring family caregivers.

Benefits
Personal care (hours vary, typically 20-30/week) Chores Nurse supervision

Frequently Asked Questions about Lutheran Village at Miller’s Grant

What neighborhood is Lutheran Village at Miller’s Grant in?

Lutheran Village at Miller’s Grant is in the Lutheran Village at Miller’s Grant neighborhood of Ellicott City.

Is Lutheran Village at Miller’s Grant in a walkable area?

Lutheran Village at Miller’s Grant has a walk score of 19. Car-dependent. Most errands require a car, with limited nearby walkable options.

What is the occupancy rate at Lutheran Village at Miller’s Grant?

Lutheran Village at Miller’s Grant's occupancy is 60%.

Does Lutheran Village at Miller’s Grant have different floorplan options?

Yes — see the floorplan options available at Lutheran Village at Miller’s Grant on this page.

Does Lutheran Village at Miller’s Grant operate as a for-profit or non-profit?

Lutheran Village at Miller’s Grant is registered as a non-profit in MD.

How many beds does Lutheran Village at Miller’s Grant have?

Lutheran Village at Miller’s Grant has 36 beds.

Are there photos of Lutheran Village at Miller’s Grant?

Yes — there are 7 photos of Lutheran Village at Miller’s Grant in the photo gallery on this page.

Guides for Better Senior Living

Care Cost Calculator: See Prices in Your Area

Nursing Home Data Explorer

Don’t Wait Too Long: 7 Red Flag Signs Your Parent Needs Assisted Living Now

The True Cost of Assisted Living in 2025 – And How Families Are Paying For It

Understanding Senior Living Costs: Pricing Models, Discounts & Financial Assistance