


Maple Ridge Gracious Retirement Living
Independent Living & Nursing Home · Cedar Park, TX

Maple Ridge Gracious Retirement Living
Independent Living & Nursing Home · Cedar Park, TX
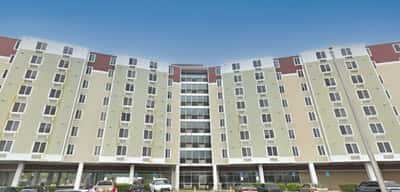
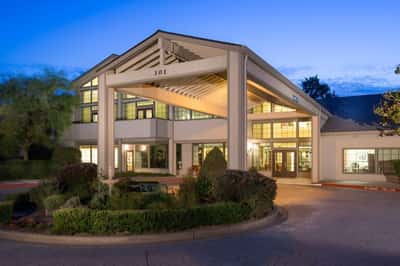
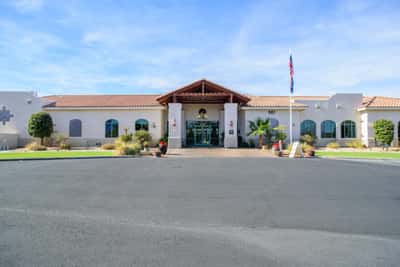
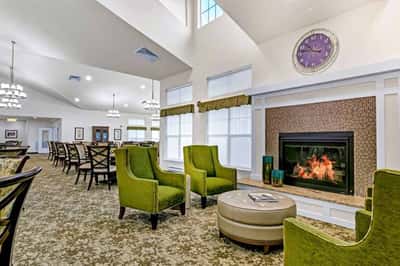
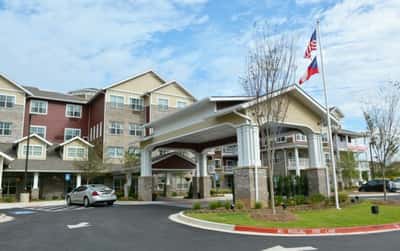
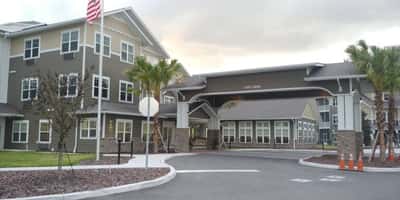
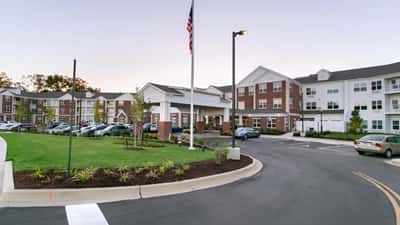
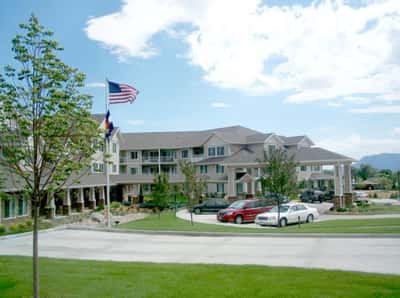
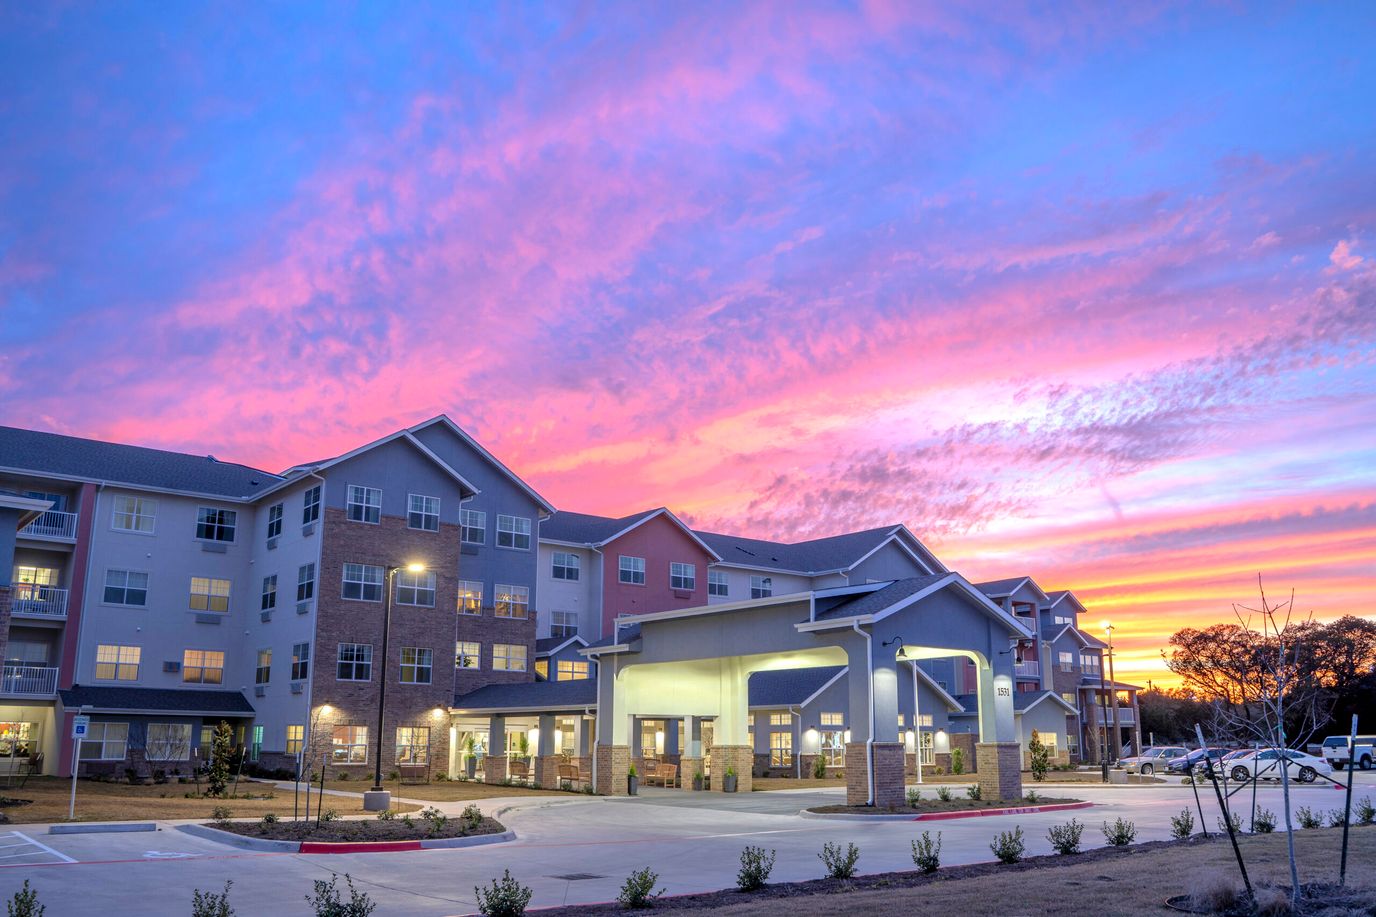
Offering a unique independent living experience, Maple Ridge in Cedar Park is a lively senior living community in Cedar Park, TX that offers an oasis of comfort and warm nostalgia. The community ensures a comfortable living environment with well-designed apartments, each one offering plenty of privacy and safety features like 24-hour emergency pull cords and fire protection systems & sprinklers. Weekly housekeeping, linen services, maintenance, and scheduled transportation helps residents live conveniently and worry-free.
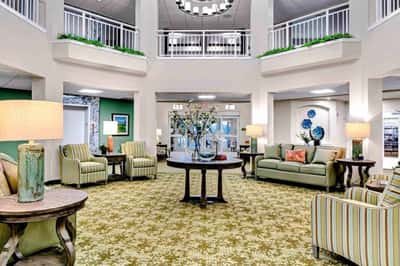
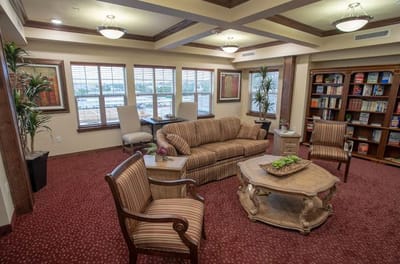
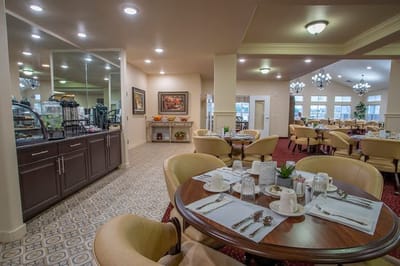
Dedicated to making its residents feel comfortable and inspired to lead a fulfilling life, the community offers nutritious and delicious meals, a jam-packed calendar of activities tailored to everyone’s interests and current capabilities, and a wealth of amenities. Here, residents can elevate their lifestyle with a variety of well-designed common spaces, including a games and crafts space, cozy common areas, a fitness center, salon, theater, library, walking paths, and gardening areas. With welcoming residents, a dedicated team and excellent amenities, residents here are guaranteed to flourish and live a happy life.
Walk Score: 54 / 100 Rank #407 / 1389Walk Score — State benchmarkedThis home is ranked 407th out of 1389 homes in Texas for walk score. Shows how walkable this facility's neighborhood is compared to the average walk score across Texas facilities. Higher scores benefit residents, families, and staff.Facilities with the same value for a metric share the same rank. Rankings are based only on facilities in Texas that report data for that category. Facilities without available data are excluded from the ranking.Click the rank badge to see the full State ranking.Click here to see the full State ranking.
Moderately walkable. Some errands can be accomplished on foot, with a mix of nearby amenities.
BBB Rating: A+ (Not Accredited)
An independent rating from the Better Business Bureau based on factors such as complaint history, transparency, and business practices.
How BBB ratings work
How BBB ratings work
Staffing
Key information about the people who lead and staff this community.
ContactOwner Manager (per BBB, record updated Jul 2026)
What does this home offer?
Pets Allowed
Room Sizes: 390-825 / 480-935 / 940-1,080 sq. ft
Housing Options: Studio / 1 Bed / 2 Bed
Building Type: Mid-rise
Transportation Services
Recreational Activities
Housekeeping Services
Exercise Programs
Living Spaces & Floor Plans for Maple Ridge Gracious Retirement Living
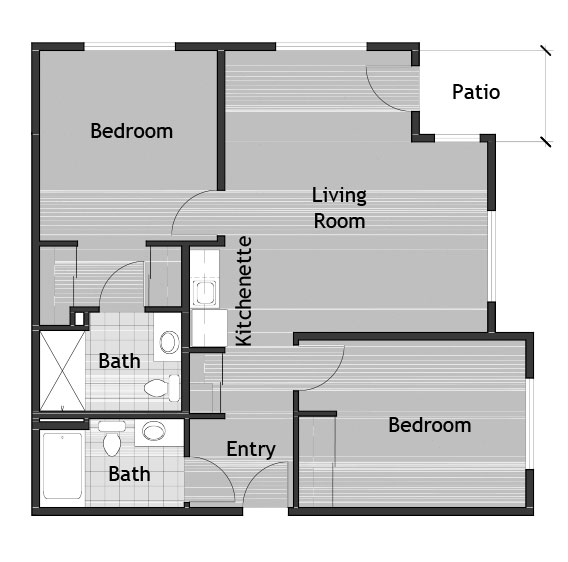
2 bedroom
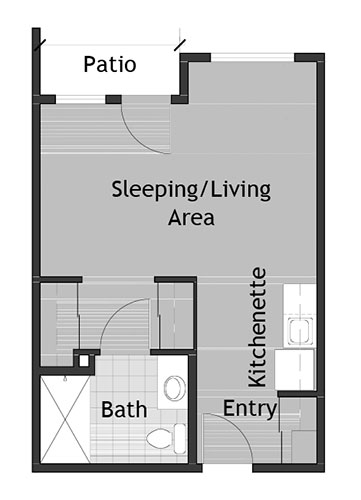
Studio
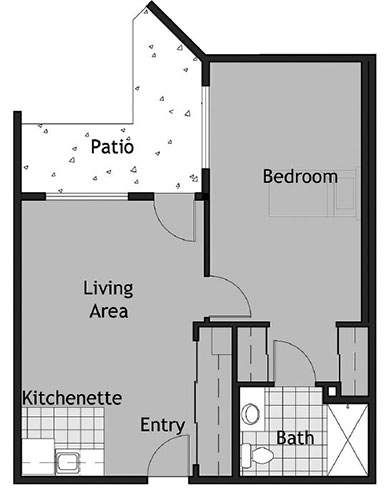
1 Bedroom
Places of interest near Maple Ridge Gracious Retirement Living
![]() 1.4 miles from city center
1.4 miles from city center
![]() Estimated distance in miles from Cedar Park's city center to Maple Ridge Gracious Retirement Living's address, calculated via Google Maps.
Estimated distance in miles from Cedar Park's city center to Maple Ridge Gracious Retirement Living's address, calculated via Google Maps.
Calculate Travel Distance to Maple Ridge Gracious Retirement Living
Add your location
Financial Assistance for
Independent Living in Texas
Maple Ridge Gracious Retirement Living is located in Cedar Park, Texas.
Here are the financial assistance programs available to residents in Texas.
Frequently Asked Questions about Maple Ridge Gracious Retirement Living
Is Maple Ridge Gracious Retirement Living in a walkable area?
Maple Ridge Gracious Retirement Living has a walk score of 54. Moderately walkable. Some errands can be accomplished on foot, with a mix of nearby amenities.
Are pets allowed at Maple Ridge Gracious Retirement Living?
Yes, Maple Ridge Gracious Retirement Living allows residents to bring their pets.
Are there photos of Maple Ridge Gracious Retirement Living?
Yes — there are 4 photos of Maple Ridge Gracious Retirement Living in the photo gallery on this page.
What is the address of Maple Ridge Gracious Retirement Living?
Maple Ridge Gracious Retirement Living is located at 1531 Juliette Way, Cedar Park, TX 78613.
What is the phone number of Maple Ridge Gracious Retirement Living?
(512) 425-0053 will put you in contact with the team at Maple Ridge Gracious Retirement Living.
Guides for Better Senior Living
Care Cost Calculator: See Prices in Your Area
Nursing Home Data Explorer
Don’t Wait Too Long: 7 Red Flag Signs Your Parent Needs Assisted Living Now
The True Cost of Assisted Living in 2025 – And How Families Are Paying For It
Understanding Senior Living Costs: Pricing Models, Discounts & Financial Assistance
Updated on
