Maryville
Nursing Home · Beaverton, OR
CMS overall rating Info The Overall CMS Rating is scored from 1 to 5 stars and combines results from health inspections, staffing levels, and quality measures. Health inspections carry the most weight. Staffing and quality scores can increase or decrease the final rating based on performance compared to state and national standards.

Maryville

Nursing Home · Beaverton, OR
CMS overall rating Info The Overall CMS Rating is scored from 1 to 5 stars and combines results from health inspections, staffing levels, and quality measures. Health inspections carry the most weight. Staffing and quality scores can increase or decrease the final rating based on performance compared to state and national standards.
Calculator: See prices in your area
Maryville accepts Medicare, Medicaid, and private pay.

Overview of Maryville

Maryville is a 185-bed long-term care facility on a 43-acre campus at 14645 SW Farmington Road in Beaverton, Washington County, Oregon, 4.7 miles from the city center. Founded in 1963, the facility is independently owned and operated by St. Mary of Oregon Ministries, a voluntary non-profit of the Roman Catholic Church. Kathleen Perry serves as administrator and compliance officer. The facility is dually certified as a skilled nursing facility and nursing facility under Medicare and Medicaid with CCN 385166. The occupancy rate stands at 73.7 percent with 16 of 185 licensed beds dedicated to memory care.

The facility offers long-term care, memory care, and rehabilitation services including physical therapy, occupational therapy, and speech therapy. In partnership with Consonus Health, Maryville operates three named programs: Stand Strong, Chronic Conditions, and Cognitive Disability Model. Total staffing numbers 408 with a staffing ratio of 3.24 to one. Nursing hours per resident per day total five hours and 38 minutes. Amenities include a gymnasium, dietician support, and chaplaincy services with daily Mass. An active resident council meets regularly. A volunteer program through Valley Catholic students has operated for 18 years.

The Oregon Department of Human Services, Aging and People with Disabilities has conducted ten inspections, eight of which are health inspections. The most recent inspection was October 30, 2025, and the most recent health inspection was April 2025. Over ten inspections, the facility has accumulated 37 citations, 63 deficiencies, and seven severe citations in the last three years. Four fines totaling 214 thousand dollars have been issued. CMS overall rating is three out of five, matching the Oregon average of 3.1. Health inspection rating is two out of five, below the Oregon average of 2.9. Staffing rating is five out of five, significantly above the Oregon average of 3.7. Quality measures rating is four out of five, above the Oregon average of 3.5. The citation and fine history exceeds Oregon norms and warrants detailed review.

Maryville suits seniors requiring skilled nursing, memory care, or rehabilitation in a Catholic mission-driven setting. However, the substantive fine and severe citation pattern requires careful verification. Families should ask administrators directly about the nature of the four fines, corrective actions taken for the seven severe citations, the infection control and safety deficiencies cited, and staffing adequacy in areas flagged during inspections before placement.

(503) 643-8626

Quality ratings

Measured by Centers for Medicare & Medicaid Services (CMS)

Overall rating Info The Overall CMS Rating combines results from health inspections, staffing levels and quality measures. Health inspections carry the most weight. Staffing and quality scores can increase or decrease the final rating based on performance compared to state and national standards.
At OR avg.
Health Inspection Info Based on the results of the facility's three most recent standard inspections and any complaint investigations. CMS reviews the number, scope, and severity of deficiencies, with more recent findings weighted more heavily.
▼ 29.8% Below OR avg.
Staffing Info Measures average nursing staff hours per resident per day, including Registered Nurses (RNs) and total nursing staff. Ratings are adjusted based on the level of care residents require and are compared to state and national benchmarks.
▲ 35.5% Above OR avg.
Quality Measures Info Based on clinical and physical health indicators reported to CMS, such as hospital readmissions, falls, pressure ulcers, and improvements in mobility. These measures reflect how well residents' health needs are being managed.
▲ 15.9% Above OR avg.

Staffing hours breakdown

Info Daily nursing hours per resident by staff type, reported to CMS. Higher is generally better — compare this facility to state and national averages to see where staffing stands.

Hours per resident per day — compared to Oregon state averages

Total nursing care / resident Info This home is ranked 17th out of 78 homes in Oregon.

Total adjusted nursing hours per resident per day, combining RN, LPN, and aide time. CMS adjusts this for case-mix so facilities can be fairly compared.
5h 38m per day
Rank #17 / 78Nurse hours — state benchmarkedThis home is ranked 17th out of 78 homes in Oregon.Shows adjusted nurse hours per resident per day benchmarked to the Oregon average, with a ranking across 78 Oregon SNFs. More hours mean more direct care. The national average is about 3.5 hrs; below 3.0 is a red flag.
This facility Oregon avg (5h 12m per day)
vs Oregon avg
+8%

2 of 6 metrics below state avg

Standout metric Registered Nurse (RN) is +32% above state avg
Staff typeHours / dayvs state avg
Registered Nurse (RN) Info RNs hold the highest nursing license and can assess residents, interpret test results, and direct care plans. More RN hours per day often signals stronger clinical oversight and faster response to health changes. 54m per day ▲ 32% State avg: 41m per day · National avg: 41m per day
LPN / LVN Info Licensed Practical Nurses (LPNs) or Licensed Vocational Nurses (LVNs) deliver routine hands-on care — medication administration, wound dressing, and monitoring vital signs. They work under RN supervision and make up a large share of daily bedside care. 47m per day ▼ 13% State avg: 54m per day · National avg: 52m per day
Nurse Aide Info Certified Nurse Aides (CNAs) provide the most direct day-to-day assistance: bathing, dressing, feeding, and mobility. Nurse aide hours are typically the largest staffing category and directly affect residents' quality of life. 3h 54m per day ▲ 16% State avg: 3h 22m per day · National avg: 2h 20m per day
Total Nursing (Weekend) Info Combined nursing hours (RN + LPN + Nurse Aide) per resident per day on weekends. Staffing often drops on weekends — this figure reveals whether the facility maintains adequate coverage outside of weekday hours. 4h 49m per day ▲ 10% State avg: 4h 23m per day · National avg: 3h 26m per day
Physical Therapist Info Hours per resident per day provided by licensed Physical Therapists (PTs) or PT Assistants. PT services help residents recover mobility after injury or illness and are especially important for post-acute (short-stay) rehabilitation. 4m per day ▼ 20% State avg: 5m per day · National avg: 4m per day
RN (Weekend) Info Registered nurse hours specifically on weekends. Facilities sometimes reduce RN presence on Saturdays and Sundays — a low weekend RN figure compared to weekday hours can indicate reduced clinical oversight when most administrative staff are absent. 27m per day ▲ 4% State avg: 26m per day · National avg: 28m per day

Capacity and availability

Avg. Length of Stay
89 days

Who this home usually serves

TYPE OF STAY

Mix of rehab and long-term care

This home supports both short-term rehab and long-term care, with residents staying for a wide range of durations.

Breakdown by payment type

Medicare

26% of new residents, usually for short-term rehab.

Typical stay 1 - 2 months

Private pay

50% of new residents, often for short stays.

Typical stay 1 - 2 months

Medicaid

24% of new residents, often for long-term daily care.

Typical stay 8 - 9 months

Finances and operations

Voluntary non-profit community
Operated by a church.
Home revenue
$29.2M
Operating deficit
-$794.4K
Voluntary non-profit community Operated by a church.
Home revenue
$29.2M Rank #1 / 73Revenue — state benchmarkedThis home is ranked 1st out of 73 homes in Oregon.Shows this facility's annual revenue compared to the Oregon SNF average. Higher revenue generally means more resources for staffing and capital — read alongside Payroll %.
Operating deficit
-$794.4K
Payroll costs Info The portion of the home's budget spent on staff, including nurses, caregivers, and other employees who support care and operations. Rank #1 / 73Payroll — state benchmarkedThis home is ranked 1st out of 73 homes in Oregon.Shows total annual staff payroll benchmarked to the Oregon average. Higher payroll investment relative to peers often signals better staffing and less reliance on cheaper contract labor.
$16.7M
57.1% of revenue Rank #31 / 73Payroll % — state benchmarkedThis home is ranked 31st out of 73 homes in Oregon.Shows payroll as a percentage of revenue versus the Oregon average. Well-run SNFs often land around 55–65%. Below 25% may signal understaffing or heavy agency use — read with Staffing ratings.
Other operating costs Info All remaining costs needed to run the home, such as food, utilities, building maintenance, supplies and administrative expenses.
$13.3M
Total costs $30.0M
Bed community size
185-bed community
A large-scale community that may provide a wide range of amenities, services, and structured programs.
Years in operation
15 years in operation
A community with a solid operating history and experience delivering ongoing care.
Walk Score
Walk Score: 3 / 100
Car-dependent. Most errands require a car, with limited nearby walkable options.

About this community

Occupancy

Occupancy rate
74%
Rank #23 / 74Occupancy rate — state benchmarkedThis home is ranked 23rd out of 74 homes in Oregon.Shows this facility's occupancy rate versus the Oregon average, with its statewide rank out of 74. Higher occupancy signals strong local demand and financial stability.
Higher than the Oregon average: 65.7%
Occupied beds
136 / 185
Average residents per home in Oregon 55 per day

License Details

Facility TypeSnf/nf Dual Cert
StatusActive
IssuanceJanuary 1, 2011
CountyWashington
CMS Certification Number385166

Ownership & Operating Entity

Maryville is administrated by Kathleen Parry.

Owner NameSisters Of St. Mary Of Oregon Maryville Corp.

Therapy & Rehabilitation

1 service
Rehabilitation Services

Contact Information

Fax(503) 520-1435

Contact Maryville

Inspection History

In Oregon, the Department of Human Services, Aging and People with Disabilities performs unannounced surveys and regular inspections to ensure resident safety in all care settings.

Since 2019 · 7 years of data 37 deficiencies 10 inspections

Inspection Scorecard Info This scorecard compares key inspection, citation, and complaint metrics at this facility against the Oregon state average. Metrics rated ≥15% worse than average are highlighted in red; those ≥15% better are highlighted in green.

Since 2019 vs. Oregon state average
Overall vs. OR average 3 Worse Metrics worse than Oregon average:
• Total deficiencies (19% above)
• Deficiencies per year (20% above)
• Total inspections (43% above)
1 Better Metrics better than Oregon average:
• Deficiencies per inspection (16% below)
Latest Inspection October 30, 2025

Deficiencies Info Deficiencies are formal regulatory issues recorded during state inspections.

MetricThis FacilityOR Averagevs. OR Avg
Total deficiencies Info Formal regulatory issues recorded by inspectors across all inspection types. 3731 This facility has 19% more total deficiencies than a typical Oregon nursing home (37 vs. OR avg 31).↑ 19% worse
Deficiencies per year Info Average deficiencies per year since 2019. 5.34.4 This facility has 20% more deficiencies per year than a typical Oregon nursing home (5.3 vs. OR avg 4.4).↑ 20% worse
Deficiencies per inspection Info Average deficiencies per inspection. 3.74.4 This facility has 16% fewer deficiencies per inspection than a typical Oregon nursing home (3.7 vs. OR avg 4.4).↓ 16% better

Inspections Info State inspections evaluate whether the facility meets health and safety standards.

MetricThis FacilityOR Averagevs. OR Avg
Total inspections Info Combined count of all routine and focused inspections. Excludes complaint investigations. 107 This facility has 43% more total inspections than a typical Oregon nursing home (10 vs. OR avg 7).↑ 43% worse

Inspection Reports Summary Info An editor-reviewed summary of the themes and findings across this facility's recent inspection reports.

The most recent inspection on October 30, 2025, found no deficiencies. Earlier inspections showed a range of deficiencies including issues with resident care such as assistance with activities of daily living, infection prevention, accident hazards, and quality of care. There were no fines, license suspensions, or enforcement actions listed in the available reports. Complaint investigations were generally unsubstantiated or found no deficiencies, with no notable substantiated complaints reported. The inspection history suggests some improvement over time, with the most recent survey showing no deficiencies after a period of mixed findings.

Read the full inspection reports for this facility, including detailed findings and corrective actions.

Show Inspection Reports

Health Inspection History

Inspections
Total health inspections 8

Oregon average 5.1


Last Health inspection on Apr 2025

Total health citations
36 Rank #42 / 76Health citations — state benchmarkedThis home is ranked 42nd out of 76 homes in Oregon.Shows this facility's total health deficiency citations benchmarked to the Oregon state average, with a ranking across all 76 OR SNFs. Lower citation counts earn a better rank.

Oregon average 34

Citations per inspection
4.5 Rank #18 / 76Citations per inspection — state benchmarkedThis home is ranked 18th out of 76 homes in Oregon.Shows average deficiency citations per CMS inspection for this facility versus the Oregon mean across 76 SNFs with citation data. Lower is better.

Oregon average 6.86


Health citations are formal notices following inspections when they fail to comply with safety and care standards.

5 of 36 citations resulted from standard inspections; 22 of 36 resulted from complaint investigations; and 9 of 36 came from combined inspections (standard and complaint).

Breakdown of citation severity (last 7 years)
Critical Health citations More info
2
300% worse than Oregon average

Oregon average: 0.5


Serious Health citations More info 5
317% worse than Oregon average

Oregon average: 1.2

2 critical citations More info Oregon average: 0.5

5 serious citations More info Oregon average: 1.2

29 moderate citations More info Oregon average: 32.1

0 minor citations More info Oregon average: 0.2
Citations history (last 7 years)
Infection Control moderate citation Info Issues related to preventing and controlling infections, including hygiene practices and safety protocols. Apr 11, 2025
Corrected

Quality of Care moderate citation Info Issues related to how well residents receive appropriate treatment and support for their medical and daily care needs. Apr 11, 2025
Corrected

Quality of Care moderate citation Info Issues related to how well residents receive appropriate treatment and support for their medical and daily care needs. Jan 03, 2025
Corrected

Quality of Care serious citation Info Issues related to how well residents receive appropriate treatment and support for their medical and daily care needs. Mar 20, 2024
Corrected

Financial Assistance for
Nursing Home in Oregon

Maryville is located in Beaverton, Oregon.
Here are the financial assistance programs available to residents in Oregon.

Get Financial aid guidance

Oregon Project Independence (OPI)

OPI

Age 60+
General Oregon resident, at risk of nursing home but not Medicaid-eligible.
Income Limits ~$2,000/month individual, varies
Asset Limits $5,000 individual
OR

Cost-sharing required; rural/urban balance.

Benefits
In-home care (3-5 hours/week) Respite (up to 10 days/year) Adult day care (~$70/day) Transportation (~5 trips/month)

Oregon Medicaid Community-Based Care

OR Medicaid CBC

Age 65+ or disabled
General Oregon resident, Medicaid-eligible, nursing home-level care need.
Income Limits (2025) ~$2,829/month 300% FBR, individual
Asset Limits $2,000 (individual), $3,000 (couple).
OR

High demand in urban areas (e.g., Portland).

Benefits
Personal care (5-7 hours/day) Respite (240 hours/year) Adult day care ($70/day) Home modifications ($1,500 avg.)

Program of All-Inclusive Care for the Elderly (PACE)

Oregon PACE (e.g., Providence ElderPlace)

Age 55+
General OR resident (specific counties), NFLOC, safe with PACE support.
Income Limits (2025) ~$2,829/month (Medicaid-eligible); private pay option available.
Asset Limits $2,000 (individual), $3,000 (couple) for Medicaid enrollees.
OR

Available in 11 counties (e.g., Multnomah, Washington); Providence ElderPlace dominant provider.

Benefits
Personal care (5-7 hours/day) Medical care Meals Transportation Respite Therapies

Medicare Savings Program (MSP)

Oregon Medicare Savings Program

Age 65+ or disabled
General OR resident, Medicare Part A/B.
Income Limits (2025) ~$2,510/month (QMB), ~$3,380/month (SLMB), ~$3,598/month (QI)—individual.
Asset Limits $9,430 (individual), $14,130 (couple).
OR

Three tiers; includes Extra Help for Part D; no waitlist.

Benefits
Covers Part B premiums ($174.70/month) Deductibles ($240/year) Copays (~20%)

Family Caregiver Support Program (FCSP)

Oregon Family Caregiver Support Program

Age
General Caregivers of 60+ needing care or 55+ caregivers of others; OR resident; functional needs (2+ ADLs).
Income Limits (2025) No strict cap; prioritizes low-income ~$24,980/year
Asset Limits Not assessed; need-based.
OR

15 regions; rural priority; includes grandparent caregivers.

Benefits
Respite (4-6 hours/week or 5 days/year) Adult day care ($60/day) Training Supplies (~$500/year)

VA Aid and Attendance (A&A) and Housebound Benefits

Oregon VA Aid and Attendance/Housebound

Age 65+ or disabled veteran/spouse
General OR resident, wartime service, need for ADL help (A&A) or homebound.
Income Limits (2025) Net income < ~$1,984/month (veteran with dependent, A&A); pension offsets income.
Asset Limits ~$155,356 net worth limit
OR

High veteran demand; Oregon Veterans’ Homes option.

Benefits
Cash (~$1,433-$2,642/month veteran, ~$951-$1,318 spouse) for care costs (e.g., in-home, assisted living)

Senior Property Tax Deferral Program

Oregon Property Tax Deferral for Disabled and Senior Citizens

Age 62+
General OR resident, homeowner 5+ years, low-income.
Income Limits (2025) ~$58,000/year household, adjusted annually
Asset Limits Home value < county median; equity > 15%.
OR

Deferred taxes accrue 6% interest; repaid upon sale/death.

Benefits
Tax deferral (~$1,000-$3,000/year avg., varies by county)

Elderly Nutrition Program (ENP)

Oregon Elderly Nutrition Program

Age 60+
General OR resident (or spouse of any age); no income limit.
Income Limits (2025) None; donations encouraged.
Asset Limits Not assessed.
OR

Includes Meals on Wheels; prioritizes homebound/low-income.

Benefits
Home-delivered or congregate meals (~$5-$7/meal value, 5 meals/week avg.)

Places of interest near Maryville

Address 4.7 miles from city center Info Estimated distance in miles from Beaverton's city center to Maryville's address, calculated via Google Maps.

Calculate Travel Distance to Maryville

Add your location

Address

Staffing Data (Q2 2025)

This data corresponds to Q2 2025 and is based on CMS Payroll-Based Journal.

Total staff 408
Employees 195
Contractors 213
Staff to resident ratio 3.24:1
11% better than Oregon average

Oregon average ratio: 2.92:1

Avg staff/day 109
Average shift 7.7 hours
0% compared with Oregon average

Oregon average: 7.8 hours

Total staff hours (quarter) 76,498

Nursing staff breakdown

Registered Nurse

Manages medical care and health needs.

Total count 34
Average shift length Info Average shift length. Calculated as total hours divided by days worked and average staff per day. 8.2 hours

This role is partially covered by contractors.

Licensed Practical Nurse

Assists with medical care and medications.

Total count 56
Average shift length Info Average shift length. Calculated as total hours divided by days worked and average staff per day. 7.8 hours

This role is partially covered by contractors.

Certified Nursing Assistant

Helps with daily care and mobility.

Total count 191
Average shift length Info Average shift length. Calculated as total hours divided by days worked and average staff per day. 7.4 hours

This role is partially covered by contractors.

Contractor staffing

Total hours from contractors

21.2%

16,244 contractor hours this quarter

Certified Nursing Assistant: 106 Licensed Practical Nurse: 34 Medication Aide/Technician: 27 Registered Nurse: 19 Speech Language Pathologist: 6 Qualified Social Worker: 6 Physical Therapy Assistant: 5 Respiratory Therapy Technician: 4 Physical Therapy Aide: 3 Occupational Therapy Aide: 2 Occupational Therapy Assistant: 1

Staff by category

Certified Nursing Assistant8510619133,24591100%7.4
Licensed Practical Nurse2234569,69091100%7.8
Medication Aide/Technician2727547,26391100%8.8
Registered Nurse1519345,89291100%8.2
Nurse Aide in Training200205,47591100%7.8
Clinical Nurse Specialist100104,6387785%8.4
Other Dietary Services Staff7072,4549099%7.6
Mental Health Service Worker4041,7697380%7.9
Speech Language Pathologist0661,3257684%6.3
RN Director of Nursing3031,1126571%8.3
Respiratory Therapy Technician0448997684%6.6
Physical Therapy Assistant0557677785%7.2
Physical Therapy Aide0336176369%7.1
Administrator1014806066%8
Nurse Practitioner1013844853%8
Occupational Therapy Aide0222462932%8.5
Qualified Social Worker0662305055%4.3
Occupational Therapy Assistant0111444%3.5
191 Certified Nursing Assistant
% of Days 100%
56 Licensed Practical Nurse
% of Days 100%
54 Medication Aide/Technician
% of Days 100%
34 Registered Nurse
% of Days 100%
20 Nurse Aide in Training
% of Days 100%
10 Clinical Nurse Specialist
% of Days 85%
7 Other Dietary Services Staff
% of Days 99%
4 Mental Health Service Worker
% of Days 80%
6 Speech Language Pathologist
% of Days 84%
3 RN Director of Nursing
% of Days 71%
4 Respiratory Therapy Technician
% of Days 84%
5 Physical Therapy Assistant
% of Days 85%
3 Physical Therapy Aide
% of Days 69%
1 Administrator
% of Days 66%
1 Nurse Practitioner
% of Days 53%
2 Occupational Therapy Aide
% of Days 32%
6 Qualified Social Worker
% of Days 55%
1 Occupational Therapy Assistant
% of Days 4%

Facility Characteristics

Source: CMS Long-Term Care Facility Characteristics (Data as of Jan 2026)

Total residents 126
Medicare
17
13.5% of residents
Medicaid
75
59.5% of residents
Private pay or other
34
27% of residents
Programs & Services
Residents Group

Residents meet regularly to discuss policies, care quality, and activities

Active Resident Council

Organized group of residents that meets regularly to discuss facility policies, quality of life, and activities.

Quality of care over time

These measures show how residents usually do over time at this home, based on health outcomes and preventive care.

High-risk clinical events score Info A composite score based on pressure ulcers, falls with injury, weight loss, walking ability decline, and activities of daily living decline. 8.2
22% better than Oregon average

Oregon average: 10.5

Functional decline score Info A composite score based on activities of daily living decline, walking ability decline, and incontinence. 19.3
9% better than Oregon average

Oregon average: 21.1

Long-stay resident measures
Above average Oregon avg: 3.4 Info CMS star rating based on long-stay quality measure performance. 5 stars = significantly above average, 1 star = significantly below average.
Need for Help with Daily Activities Increased Info Percent of long-stay residents whose need for help with daily activities has increased 16.4%
In line with Oregon average

Oregon average: 16.3%

Walking Ability Worsened Info Percent of long-stay residents whose ability to move independently worsened 16.6%
33% better than Oregon average

Oregon average: 24.9%

Low Risk Residents with Bowel/Bladder Incontinence Info Percent of low risk long-stay residents who lose control of their bowels or bladder 24.7%
9% worse than Oregon average

Oregon average: 22.6%

Falls with Major Injury Info Percent of long-stay residents experiencing one or more falls with major injury 2.3%
In line with Oregon average

Oregon average: 2.4%

High Risk Residents with Pressure Ulcers Info Percent of long-stay high risk residents with pressure ulcers 3.5%
49% better than Oregon average

Oregon average: 6.9%

Urinary Tract Infection Info Percent of long-stay residents with a urinary tract infection 1.8%
13% better than Oregon average

Oregon average: 2.1%

Lost Too Much Weight Info Percent of long-stay residents who lose too much weight 2.0%
62% better than Oregon average

Oregon average: 5.3%

Depressive Symptoms Info Percent of long-stay residents who have depressive symptoms 3.0%
36% better than Oregon average

Oregon average: 4.6%

Antipsychotic Use Info Percent of long-stay residents who received an antipsychotic medication 13.8%
In line with Oregon average

Oregon average: 13.2%

Pneumococcal Vaccine Info Percent of long-stay residents assessed and appropriately given the pneumococcal vaccine 90.5%
5% worse than Oregon average

Oregon average: 95.7%

Influenza Vaccine Info Percent of long-stay residents assessed and appropriately given the seasonal influenza vaccine 98.0%
In line with Oregon average

Oregon average: 95.2%

Hospitalizations per 1,000 days Info Number of hospitalizations per 1,000 long-stay resident days. 1.63
16% worse than Oregon average

Oregon average: 1.40
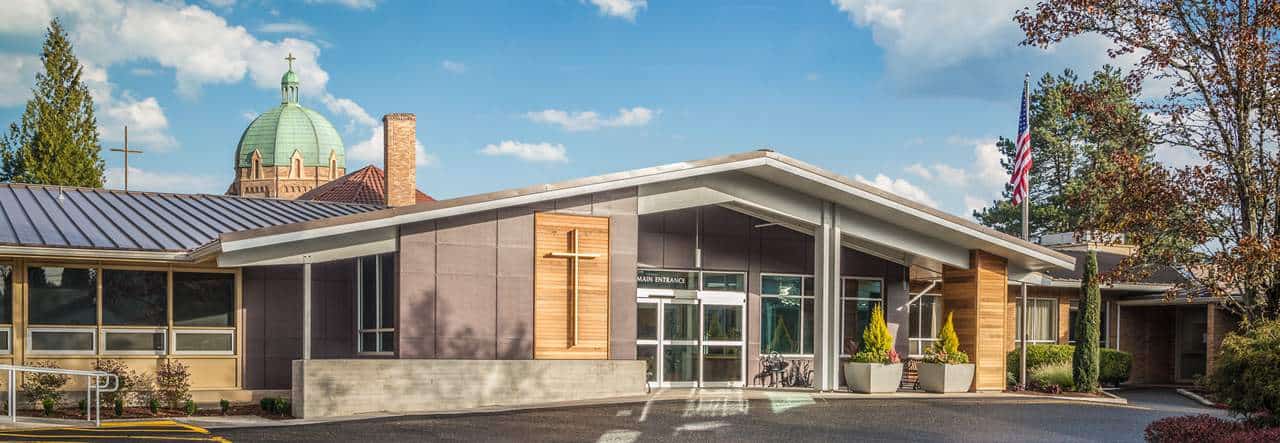
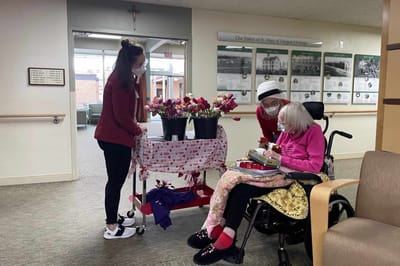
ED visits per 1,000 days Info Number of outpatient emergency department visits per 1,000 long-stay resident days. 0.98
61% better than Oregon average

Oregon average: 2.52

Short-stay resident measures
Significantly above average Oregon avg: 3.2 Info CMS star rating based on short-stay quality measure performance. 5 stars = much above average, 1 star = much below average.
Pneumococcal Vaccine Info Percent of short-stay residents assessed and appropriately given the pneumococcal vaccine 84.5%
In line with Oregon average

Oregon average: 86.2%

Antipsychotic medication increase Info Percent of short-stay residents who newly received an antipsychotic medication 0.2%
87% better than Oregon average

Oregon average: 1.8%

Influenza Vaccine Info Percent of short-stay residents assessed and appropriately given the seasonal influenza vaccine 76.8%
5% worse than Oregon average

Oregon average: 81.2%

Re-hospitalized after SNF stay Info Percentage of short-stay residents who were re-hospitalized after their nursing home admission. 19.0%
12% better than Oregon average

Oregon average: 21.6%

Emergency department visits Info Percentage of short-stay residents who had an outpatient emergency department visit. 10.7%
29% better than Oregon average

Oregon average: 15.1%

Falls with major injury Info Percentage of SNF residents who experience falls with major injury during their stay. 0.0%
100% better than Oregon average

Oregon average: 0.8%

Ability to care for self at discharge Info Percentage of residents at or above expected ability to care for themselves at discharge. 61.7%
15% better than Oregon average

Oregon average: 53.7%

Successful return to home or community Info Rate of successful return to home or community from a skilled nursing facility. 65.3%
29% better than Oregon average

Oregon average: 50.6%

Penalties and fines

Federal penalties imposed by CMS for regulatory violations, including civil money penalties (fines) and denials of payment for new Medicare/Medicaid admissions.

Source: CMS Penalties Database (Data as of Jan 2026)

Total fines amount $214K
258% higher than Oregon average

Oregon average: $60K

Number of fines 4
137% more fines than Oregon average

Oregon average: 1.7

Payment Denials Info Serious action where Medicare and/or Medicaid temporarily stops payments for new residents until issues are fixed. 0
100% fewer payment denials than Oregon average

Oregon average: 0.1

Fines amount comparison
This facility $214K
Oregon average $60K
Penalty History

Penalties are imposed by CMS for violations of federal nursing home regulations.

2 penalties in the past 3 years

Multiple penalties were reported in the last 3 years.

Civil Money Penalty Info Fines imposed for noncompliance, which can be assessed per day or per instance of violation. Dec 18, 2023
$107K
Civil Money Penalty Info Fines imposed for noncompliance, which can be assessed per day or per instance of violation. Aug 17, 2023
$56K

Last updated: Jan 2026

Compare Nursing Home around Beaverton

The information below is reported by the Oregon Department of Human Services, Aging and People with Disabilities.

3 facilities compared · CMS & OR Dept. of Health data · Updated May 2026

Filter by care type
Avamere Rehabilitation of Beaverton
NH

Nursing Home Licensed facility providing 24/7 skilled nursing care for residents with complex, ongoing medical needs. Staffed by RNs, LPNs, and CNAs. Inspected and star-rated annually by CMS. Accepts Medicare (short-term rehab) and Medicaid (long-term care).

AL

Assisted Living A licensed, long-term care setting for seniors or individuals with disabilities who need help with daily activities — like bathing, dressing, and medication management — but not 24-hour skilled nursing. Offers housing, meals, and around-the-clock support while aiming to maximize resident independence.

RC

Respite Care Short-term temporary care — days to weeks — to give family caregivers a break. Full care provided during the stay. Often used after hospitalization or to trial a facility before a permanent placement decision.

Beaverton (Vose)104 73.0% +11%5.21 -26%-1%1184.5172 68 Nair Facility Holdings LLC$17.9M$6.0M33.8%385195
Maryville
NH

Nursing Home Licensed facility providing 24/7 skilled nursing care for residents with complex, ongoing medical needs. Staffed by RNs, LPNs, and CNAs. Inspected and star-rated annually by CMS. Accepts Medicare (short-term rehab) and Medicaid (long-term care).

AL

Assisted Living A licensed, long-term care setting for seniors or individuals with disabilities who need help with daily activities — like bathing, dressing, and medication management — but not 24-hour skilled nursing. Offers housing, meals, and around-the-clock support while aiming to maximize resident independence.

Beaverton185 73.7% +12%5.64 -6%+8%4364.57135 3 St Mary Of Oregon Ministries Oregon$29.2M$10.4M35.6%385166
Maryville Nursing Center
NH

Nursing Home Licensed facility providing 24/7 skilled nursing care for residents with complex, ongoing medical needs. Staffed by RNs, LPNs, and CNAs. Inspected and star-rated annually by CMS. Accepts Medicare (short-term rehab) and Medicaid (long-term care).

AL

Assisted Living A licensed, long-term care setting for seniors or individuals with disabilities who need help with daily activities — like bathing, dressing, and medication management — but not 24-hour skilled nursing. Offers housing, meals, and around-the-clock support while aiming to maximize resident independence.

IL

Independent Living Lifestyle-focused communities for older adults offering dining, activities, and transportation with minimal personal care. Best for active, independent seniors who want community without medical support.

MC

Memory Care Secured, specialized care for people living with Alzheimer's or dementia. Staff trained in cognitive impairment, with higher staff-to-resident ratios and an environment designed to reduce confusion and wandering risk.

Beaverton (Central Beaverton)181 73.7% +12%5.64 -6%+8%4364.57135 55 St Mary Of Oregon Ministries Oregon$29.2M$10.4M35.6%385166

Guides for Better Senior Living

Care Cost Calculator: See Prices in Your Area

Nursing Home Data Explorer

Don’t Wait Too Long: 7 Red Flag Signs Your Parent Needs Assisted Living Now

The True Cost of Assisted Living in 2025 – And How Families Are Paying For It

Understanding Senior Living Costs: Pricing Models, Discounts & Financial Assistance

Frequently Asked Questions about Maryville

Who is the owner of Maryville?

The legal owner and operator of Maryville is Sisters of St. Mary of Oregon Maryville Corp..

Is Maryville in a walkable area?

Maryville has a walk score of 3. Car-dependent. Most errands require a car, with limited nearby walkable options.

What is the occupancy rate at Maryville?

Maryville's occupancy is 74%.

What is the best email address for Maryville?

The team at Maryville can be reached at [email protected].

Who is the administrator of Maryville?

Kathleen Parry is the administrator of Maryville.

How many beds does Maryville have?

Maryville has 185 beds.

Has Maryville had any recent deficiencies or citations?

Maryville has had 37 recently reported deficiencies.

Explore Open Rooms
1 Contact details
2 What type of senior care service are you looking for?
3 What budget do you have in mind for senior care?
4 How soon do you need to find care?
5 Additional details

Thank you for your interest!

Our team will be in touch shortly to help with next steps.