


Total health inspections
10
Ohio average 6.7
Last Health inspection on Nov 2025
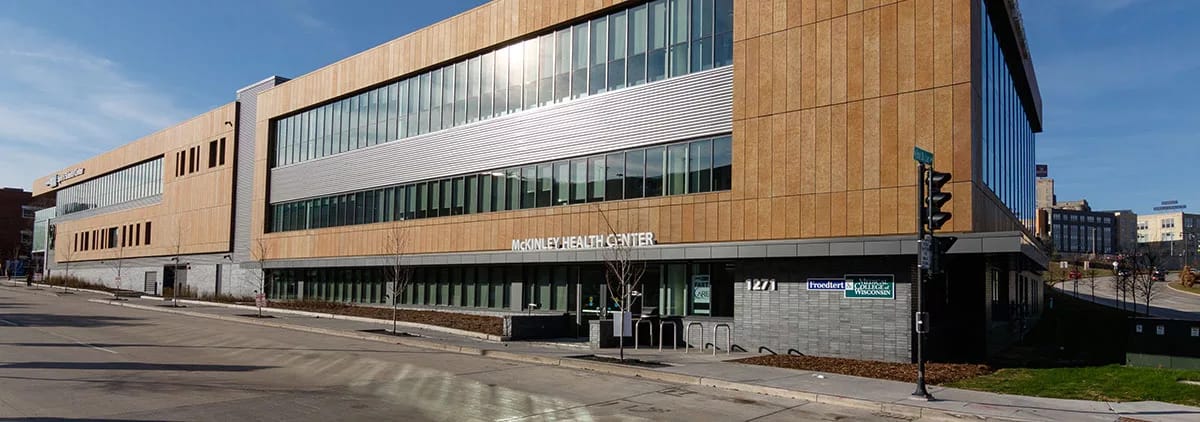

McKinley Health Care Center is a long-term care facility in Canton. A comprehensive community that presents a resort-like lifestyle with world-class hospitality is offered to 53+ adults with personal needs. The health and rehabilitation center’s nursing approach is results-driven and resident-focused on individualized care that contributes to a speedy recovery.
McKinley emphasizes skilled nursing, short-term rehabilitation, and long-term nursing care services. The dedicated team of caregivers strives to meet and follow a resident’s individualized care plan for a maximum healing journey. They house state-of-the-art technologies that help recover a range of medical conditions– wound care, neurological recovery, pain management, IV therapy, and physical, occupational, and speech therapy.
Staffing hours
![]() Daily nursing hours per resident by staff type, reported to CMS. Higher is generally better — compare this facility to state and national averages to see where staffing stands.
Daily nursing hours per resident by staff type, reported to CMS. Higher is generally better — compare this facility to state and national averages to see where staffing stands.
Hours per resident per day vs Ohio averages
Total nursing care
![]() This home is ranked 110th out of 177 homes in Ohio for nurse hours. Total adjusted nursing hours per resident per day, combining RN, LPN, and aide time. CMS adjusts this for case-mix so facilities can be fairly compared.
This home is ranked 110th out of 177 homes in Ohio for nurse hours. Total adjusted nursing hours per resident per day, combining RN, LPN, and aide time. CMS adjusts this for case-mix so facilities can be fairly compared.
3h 20m
6% below state avg5 of 6 metrics below state avg
In Ohio, the Department of Health, Bureau of Survey and Certification conducts unannounced onsite inspections to evaluate the quality of care and environment in all licensed facilities.
Citations
| This Facility | OH Average | vs. OH Avg |
|---|---|---|---|
|
Total citations
| 47 | 2 | This facility has 2250% more total citations than a typical Ohio nursing home (47 vs. OH avg 2).↑ 2250% worse |
|
Citations per inspection
| 4.3 | 0.3 | This facility has 1333% more citations per inspection than a typical Ohio nursing home (4.3 vs. OH avg 0.3).↑ 1333% worse |
Inspections
| This Facility | OH Average | vs. OH Avg |
|---|---|---|---|
|
Total inspections
| 11 | 6 | This facility has had 83% more total inspections than the Ohio average (11 vs. OH avg 6). More inspections can mean more regulatory scrutiny rather than worse care.↑ 83% more |
Ohio average 6.7
Last Health inspection on Nov 2025
Ohio average 30.9
Ohio average 4.59
Health citations are formal notices following inspections when they fail to comply with safety and care standards.
20 of 42 citations resulted from standard inspections; 18 of 42 resulted from complaint investigations; and 4 of 42 came from combined inspections (standard and complaint).
Ohio average: 0.3
Ohio average: 0.9
Reporting period: October 1 – December 31, 2025 (Q4 2025). Source: CMS Payroll-Based Journal report.
Manages medical care and health needs.
Assists with medical care and medications.
Helps with daily care and mobility.
Total hours from contractors
3,108 contractor hours this quarter
| Certified Nursing Assistant | 70 | 65 | 135 | 25,429 | 92 | 100% | 8 |
| Licensed Practical Nurse | 31 | 46 | 77 | 11,918 | 92 | 100% | 8.2 |
| RN Director of Nursing | 4 | 0 | 4 | 1,801 | 66 | 72% | 8.1 |
| Respiratory Therapist | 4 | 0 | 4 | 1,435 | 64 | 70% | 7.1 |
| Registered Nurse | 10 | 0 | 10 | 1,161 | 88 | 96% | 9 |
| Mental Health Service Worker | 2 | 0 | 2 | 880 | 64 | 70% | 8 |
| Qualified Social Worker | 2 | 0 | 2 | 722 | 69 | 75% | 7.2 |
| Speech Language Pathologist | 2 | 0 | 2 | 697 | 58 | 63% | 9.3 |
| Other Dietary Services Staff | 4 | 0 | 4 | 686 | 82 | 89% | 6.6 |
| Occupational Therapy Aide | 3 | 0 | 3 | 638 | 68 | 74% | 7.9 |
| Clinical Nurse Specialist | 6 | 0 | 6 | 522 | 53 | 58% | 8 |
| Dietitian | 1 | 0 | 1 | 496 | 62 | 67% | 8 |
| Administrator | 2 | 0 | 2 | 472 | 59 | 64% | 8 |
| Nurse Practitioner | 1 | 0 | 1 | 472 | 59 | 64% | 8 |
| Qualified Activities Professional | 2 | 0 | 2 | 452 | 58 | 63% | 7.8 |
| Physical Therapy Assistant | 1 | 0 | 1 | 442 | 57 | 62% | 7.8 |
| Respiratory Therapy Technician | 2 | 0 | 2 | 334 | 54 | 59% | 4.8 |
Federal penalties imposed by CMS for regulatory violations, including civil money penalties (fines) and denials of payment for new Medicare/Medicaid admissions.
Source: CMS Penalties Database
No penalties in the past 3 years
No civil money penalties or payment denials were reported in the last 3 years.
These measures show how residents usually do over time at this home, based on health outcomes and preventive care.
Ohio average: 5.8
Ohio average: 12.7
Ohio average: 6.8%
Ohio average: 8.9%
Ohio average: 22.0%
Ohio average: 3.4%
Ohio average: 3.9%
Ohio average: 0.5%
Ohio average: 6.2%
Ohio average: 24.0%
Ohio average: 8.4%
Ohio average: 92.4%
Ohio average: 94.5%
Ohio average: 1.77
Ohio average: 1.83
Ohio average: 78.0%
Ohio average: 1.3%
Ohio average: 75.6%
Ohio average: 25.1%
Ohio average: 12.5%
Ohio average: 0.8%
Ohio average: 53.7%
Quality measures are calculated from Minimum Data Set (MDS) assessments. For most measures, lower percentages indicate better care quality.
27% of new residents, usually for short-term rehab.
13% of new residents, often for short stays.
60% of new residents, often for long-term daily care.
Source: CMS Long-Term Care Facility Characteristics (Data as of Jan 2026)
Residents meet regularly to discuss policies, care quality, and activities
State-approved Nurse Aide Training and Competency Evaluation Program on-site
Organized group of residents that meets regularly to discuss facility policies, quality of life, and activities.
Data sourced from CMS Long-Term Care Facility Characteristics quarterly report. Payer mix reflects the current resident census by primary payment source.
Historical financial and operational data for McKinley Health Care Center from 2011–2023, based on CMS SNF Cost Reports.
Key figures below are for fiscal year ending in 12/2023.
Based on CMS SNF Cost Report for fiscal year ending in 12/2023.
Most residents stay for extended periods and receive ongoing daily care.
Most new residents arrive under Medicaid (60% of admissions), and a typical Medicaid stay runs around 1 - 2 years.
Coverage residents most often arrive under.
Coverage residents most often leave under.
![]() 0.5 miles from city center
0.5 miles from city center
![]() Estimated distance in miles from Canton's city center to McKinley Health Care Center's address, calculated via Google Maps.
Estimated distance in miles from Canton's city center to McKinley Health Care Center's address, calculated via Google Maps.
Add your location
Info below is compiled from CMS reports & the OH Dept. of Health, senior community websites & trusted data sources such as Walk Score & BBB.
Communities are listed from highest to lowest based on our ranking methodology.
| The Pines Healthcare Center | NH HOS MC PC RC SNF | Canton | 80
Facility
80
OH AVG
75
Rank
#132 / 306 |
92.5%
Facility
92.5%
OH AVG
81.7
Rank
#27 / 135 | +13% | 2.76
Facility
2.76
OH AVG
3.54
Rank
#167 / 177 | -29% | -22% | $14.7k
Facility
$14.7k
OH AVG
$74.0k
Rank
#137 / 178 | 20
Facility
20
OH AVG
30.9
Rank
#52 / 178 | 2.9
Facility
2.9
OH AVG
4.6
Rank
#33 / 178 | 1 | 74 | - |
45
Facility
45
OH AVG
42
Rank
#310 / 673 | Heidi Vacco | $8.1MFiscal year ending 12/2023
Facility
$8.1MFiscal year ending 12/2023
OH AVG
$9.6M
Rank
#102 / 172 | $4.1MFiscal year ending 12/2023
Facility
$4.1MFiscal year ending 12/2023
OH AVG
$5.2M
Rank
#114 / 172 | 50.3%Fiscal year ending 12/2023
Facility
50.3%Fiscal year ending 12/2023
OH AVG
55.7%
Rank
#112 / 172 | 365862 | ||||
| Bethany | NH SNF | Canton (Edgefield) | 86
Facility
86
OH AVG
75
Rank
#111 / 306 |
90.7%
Facility
90.7%
OH AVG
81.7
Rank
#36 / 135 | +11% | 5.10
Facility
5.10
OH AVG
3.54
Rank
#10 / 177 | -15% | +44% | $0
Facility
$0
OH AVG
$74.0k
Rank
#1 / 178 | 8
Facility
8
OH AVG
30.9
Rank
#17 / 178 | 4.0
Facility
4.0
OH AVG
4.6
Rank
#79 / 178 | - | 78 | A+ |
54
Facility
54
OH AVG
42
Rank
#209 / 673 | Elizabeth Baum | $8.7MFiscal year ending 12/2023
Facility
$8.7MFiscal year ending 12/2023
OH AVG
$9.6M
Rank
#93 / 172 | $6.3MFiscal year ending 12/2023
Facility
$6.3MFiscal year ending 12/2023
OH AVG
$5.2M
Rank
#44 / 172 | 72.5%Fiscal year ending 12/2023
Facility
72.5%Fiscal year ending 12/2023
OH AVG
55.7%
Rank
#8 / 172 | 366334 | ||||
| Windsor Medical Center | NH ADC AL SNF | North Canton | 20
Facility
20
OH AVG
75
Rank
#294 / 306 |
90.0%
Facility
90.0%
OH AVG
81.7
Rank
#43 / 135 | +10% | 6.36
Facility
6.36
OH AVG
3.54
Rank
#3 / 177 | -12% | +80% | $6.5k
Facility
$6.5k
OH AVG
$74.0k
Rank
#129 / 178 | 5
Facility
5
OH AVG
30.9
Rank
#8 / 178 | 2.5
Facility
2.5
OH AVG
4.6
Rank
#21 / 178 | 1 | 18 | A+ |
31
Facility
31
OH AVG
42
Rank
#433 / 673 | Thomas Swallen | $3.0MFiscal year ending 09/2023
Facility
$3.0MFiscal year ending 09/2023
OH AVG
$9.6M
Rank
#168 / 172 | $3.0MFiscal year ending 09/2023
Facility
$3.0MFiscal year ending 09/2023
OH AVG
$5.2M
Rank
#142 / 172 | 101.7%Fiscal year ending 09/2023
Facility
101.7%Fiscal year ending 09/2023
OH AVG
55.7%
Rank
#2 / 172 | 366456 | ||||
| Canton Christian Home | NH AL RC SNF | Canton | 84
Facility
84
OH AVG
75
Rank
#114 / 306 |
66.7%
Facility
66.7%
OH AVG
81.7
Rank
#119 / 135 | -18% | 4.52
Facility
4.52
OH AVG
3.54
Rank
#17 / 177 | -35% | +28% | $9.1k
Facility
$9.1k
OH AVG
$74.0k
Rank
#130 / 178 | 31
Facility
31
OH AVG
30.9
Rank
#98 / 178 | 6.2
Facility
6.2
OH AVG
4.6
Rank
#157 / 178 | 5 | 56 | A+ |
53
Facility
53
OH AVG
42
Rank
#223 / 673 | Ray Beal | $5.2MFiscal year ending 12/2023
Facility
$5.2MFiscal year ending 12/2023
OH AVG
$9.6M
Rank
#147 / 172 | $3.4MFiscal year ending 12/2023
Facility
$3.4MFiscal year ending 12/2023
OH AVG
$5.2M
Rank
#132 / 172 | 64.3%Fiscal year ending 12/2023
Facility
64.3%Fiscal year ending 12/2023
OH AVG
55.7%
Rank
#34 / 172 | 366300 | ||||
| McKinley Health Care Center | NH PC SNF | Canton (Downtown Canton) | 176
Facility
176
OH AVG
75
Rank
#5 / 306 |
88.6%
Facility
88.6%
OH AVG
81.7
Rank
#54 / 135 | +8% | 3.34
Facility
3.34
OH AVG
3.54
Rank
#110 / 177 | -58% | -6% | $0
Facility
$0
OH AVG
$74.0k
Rank
#1 / 178 | 42
Facility
42
OH AVG
30.9
Rank
#142 / 178 | 4.2
Facility
4.2
OH AVG
4.6
Rank
#93 / 178 | 1 | 156 | - |
84
Facility
84
OH AVG
42
Rank
#11 / 673 | Rothner Health Ventures I | $13.3MFiscal year ending 12/2023
Facility
$13.3MFiscal year ending 12/2023
OH AVG
$9.6M
Rank
#31 / 172 | $7.5MFiscal year ending 12/2023
Facility
$7.5MFiscal year ending 12/2023
OH AVG
$5.2M
Rank
#29 / 172 | 56.2%Fiscal year ending 12/2023
Facility
56.2%Fiscal year ending 12/2023
OH AVG
55.7%
Rank
#77 / 172 | 365655 |
McKinley Health Care Center is located in Canton, Ohio.
Here are the financial assistance programs available to residents in Ohio.
McKinley Health Care Center is in the Downtown Canton neighborhood of Canton.
McKinley Health Care Center has a walk score of 84. Very walkable. Most errands can be accomplished on foot, and many essentials are within a short walk.
McKinley Health Care Center's occupancy is 84.2%.
No, McKinley Health Care Center has a no-pet policy.
McKinley Health Care Center is registered as a for-profit in OH.
McKinley Health Care Center has had 47 reported citations since 2018 according to records from Ohio Department of Aging (ODA).
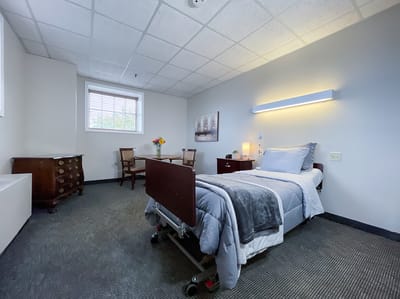
Yes — there are 3 photos of McKinley Health Care Center in the photo gallery on this page.
Care Cost Calculator: See Prices in Your Area
Nursing Home Data Explorer
Don’t Wait Too Long: 7 Red Flag Signs Your Parent Needs Assisted Living Now
The True Cost of Assisted Living in 2025 – And How Families Are Paying For It
Understanding Senior Living Costs: Pricing Models, Discounts & Financial Assistance


